Business Intelligence
How to give your PMs self-serve data access without breaking governance
Enable PMs with self-serve analytics while enforcing RBAC, a semantic layer, automated quality checks, and audit trails for compliance.
Empowering product managers (PMs) with self-serve data tools can cut delays in decision-making by up to 30%. But without proper safeguards, this access risks data breaches, compliance violations, and inconsistent metrics. The key is balancing agility with governance.
Here’s how you can achieve this:
Self-serve tools: Enable PMs to query and analyze data independently without needing SQL expertise or IT support.
Governance framework: Implement role-based access controls (RBAC), tiered datasets (e.g., gold-standard certified data), and automated data quality checks.
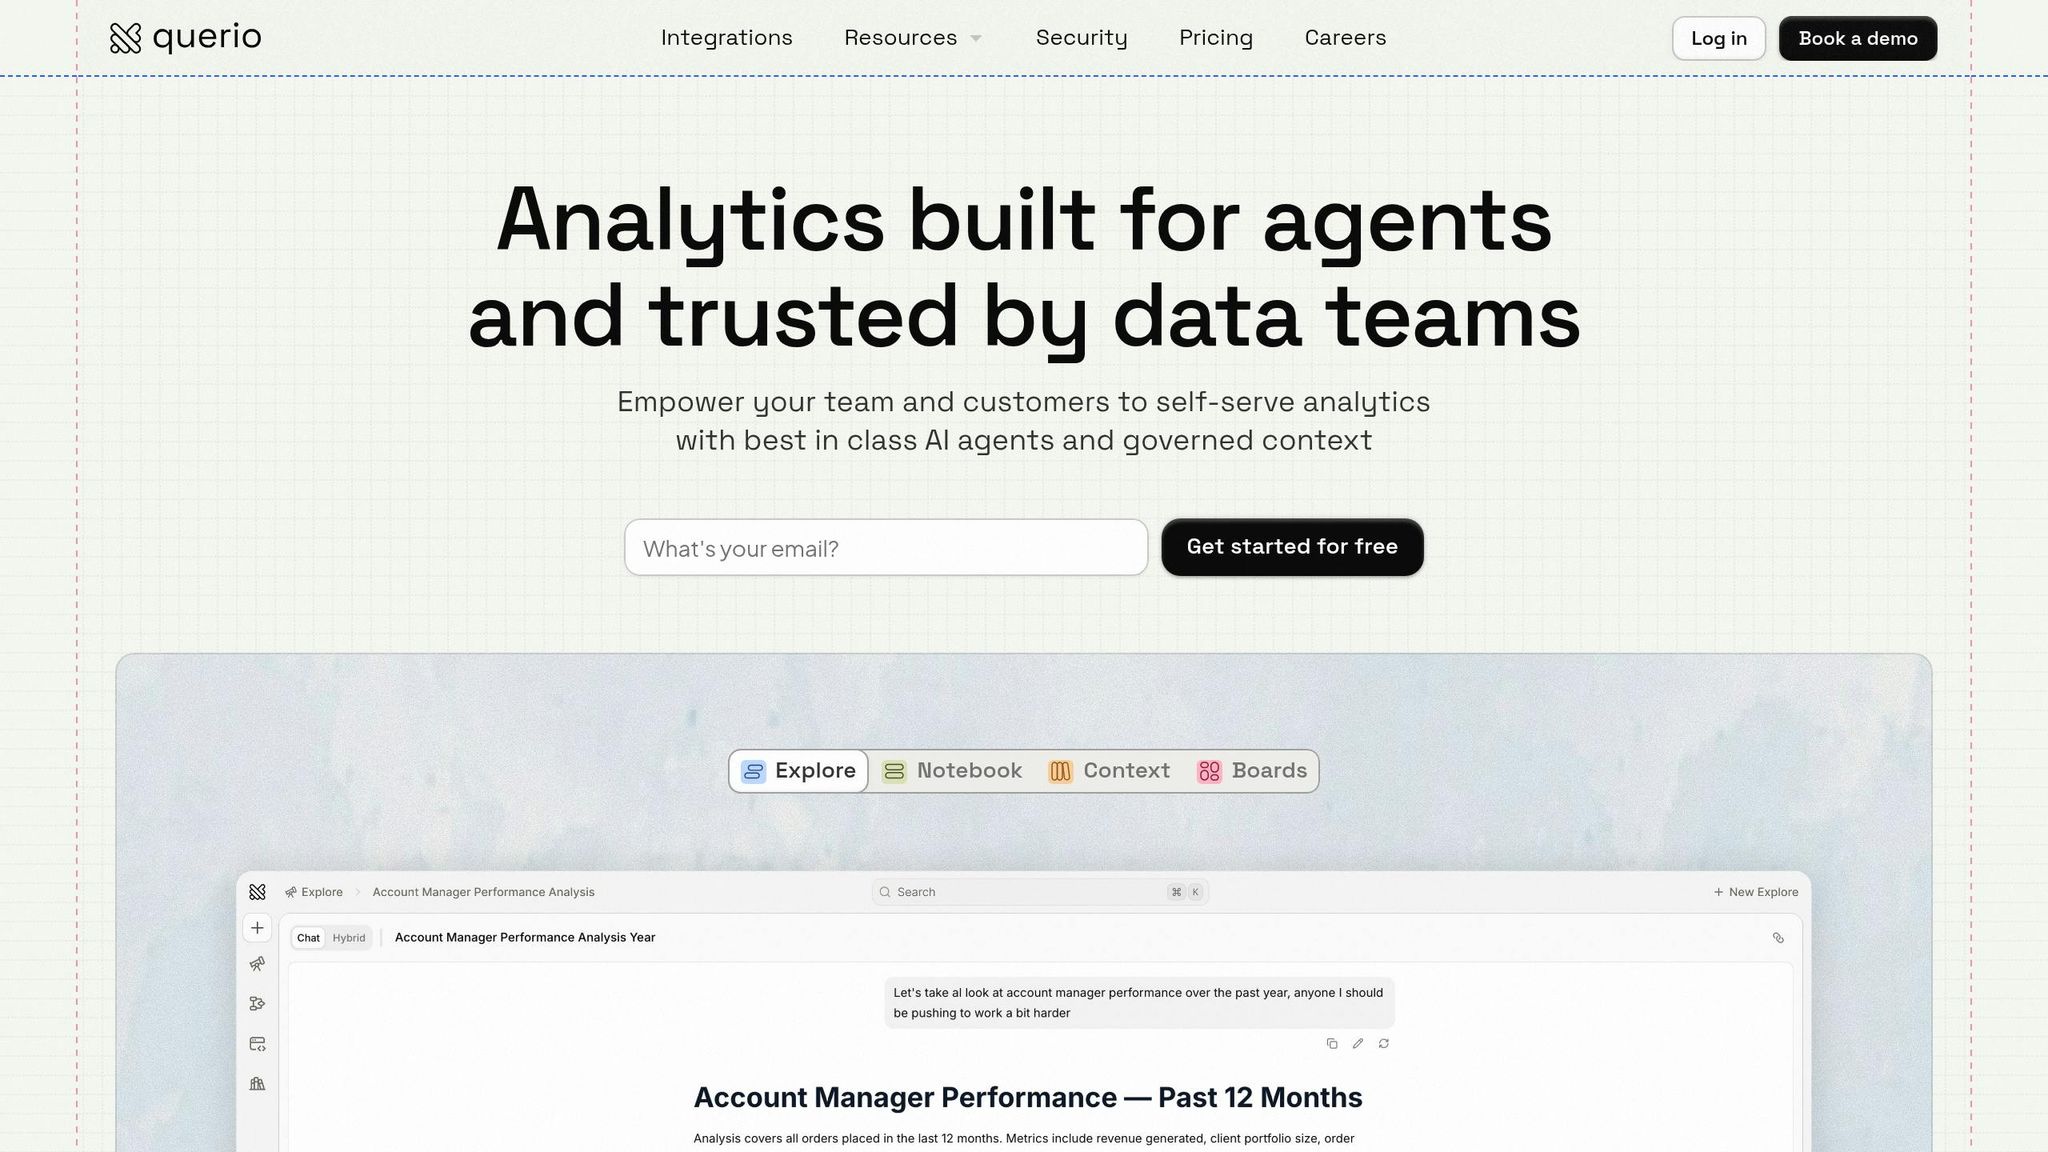
AI-powered platforms: Use tools like Querio to simplify data access while enforcing security, ensuring consistent metrics, and maintaining audit trails.
Semantic layers: Standardize metrics and calculations to avoid conflicting KPIs and streamline analysis.
Automated compliance: Track data lineage, validate queries, and manage metadata to reduce risks.
Organizations that implement these strategies report faster insights, reduced IT workloads, and fewer governance incidents. The process typically takes 6–9 months and requires ongoing monitoring of metrics like tool adoption, compliance violations, and data quality.
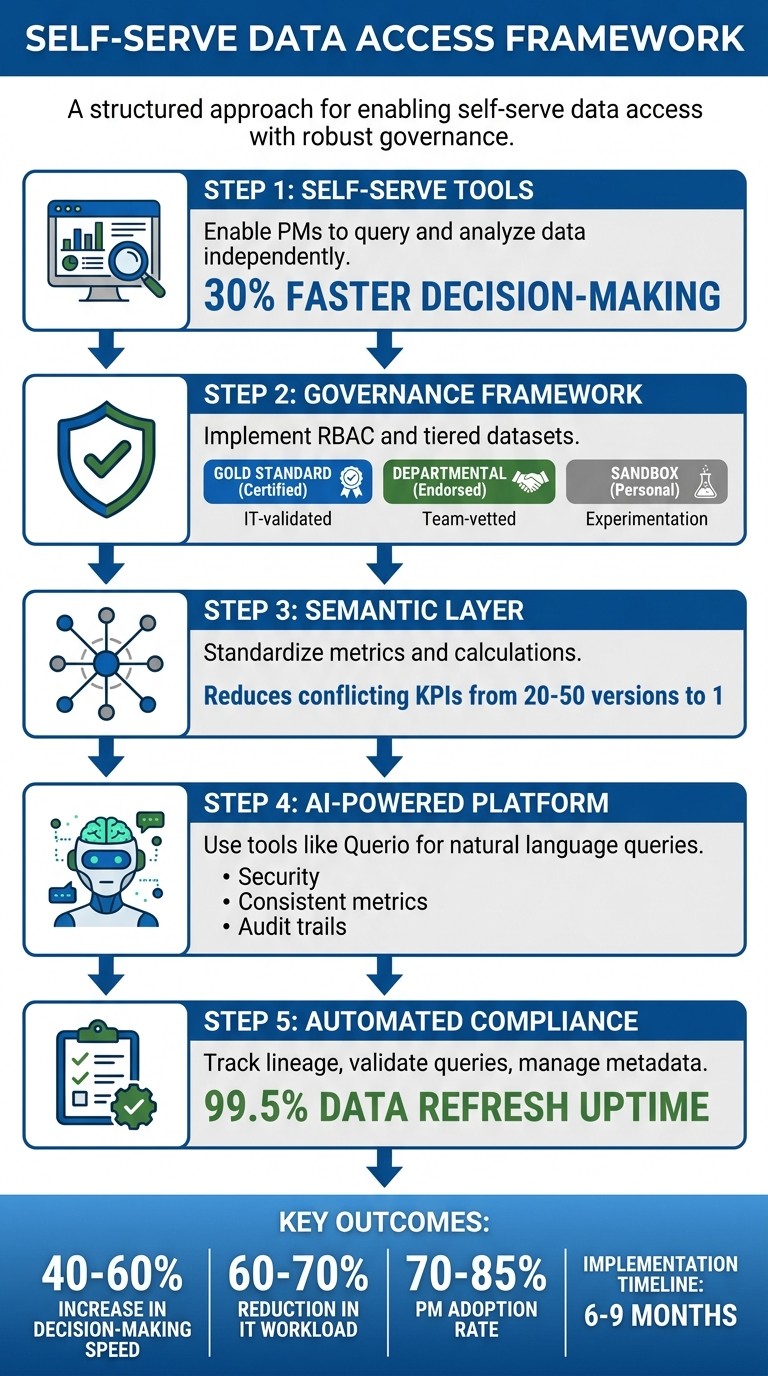
5-Step Framework for Self-Serve Data Access with Governance
Building a Data Governance Framework
A governance framework is all about establishing controls that enhance efficiency without stifling progress. As Andi McAleer, Head of Data & AI Governance at the Financial Times, explains:
"Governance is a catalyst, not a constraint... control enables maximum speed and maximum maneuverability for innovation" [6].
The real challenge lies in striking the right balance. One financial services company experienced this firsthand when an overly restrictive governance model caused Power BI monthly active usage to plummet to just 18% [3]. On the other hand, too little governance can lead to inconsistent metrics, ultimately undermining trust in analytics.
A practical solution is a tiered dataset model that organizes data based on its risk level and usage. Here's how it works:
Certified (Gold Standard): These datasets are IT-validated, serving as the authoritative sources for enterprise KPIs.
Endorsed (Departmental): These datasets are vetted by departmental stewards for team-specific purposes.
Personal (Sandbox): These datasets allow project managers (PMs) to experiment and prototype analyses without impacting production data.
This model provides quick access to low-risk data while keeping sensitive information tightly controlled [3][4]. With this foundation in place, the next step is to build out the core components of a strong governance framework.
Core Components of Governance
Effective governance rests on four key pillars: data quality, accountability, transparency, and standardization.
Data Quality: Automated checks monitor aspects like freshness, volume, and schema changes to ensure reliability [4].
Accountability: Clear ownership roles are essential. For example, Workspace Owners handle user permissions and content lifecycle, while Center of Excellence (CoE) Leads establish naming conventions and global policies [3][5].
Transparency: Sensitivity tags (e.g., Public, Internal, Confidential, Restricted) are applied systematically, flowing from datasets to reports [5][3].
Standardization: Consistent definitions ensure everyone is on the same page.
These principles were the backbone of a successful governance rollout at a multi-division firm. Between 2024 and 2026, the firm scaled from 50 to 5,000 users without a single incident. They certified eight finance datasets and achieved an impressive 82% monthly active usage [3]. Their success came from separating responsibilities: IT and data stewards focused on maintaining the data foundation (quality, security, and logic), while PMs took charge of the presentation layer (visualizations and ad-hoc analysis) [8].
Aligning Governance with Business Objectives
A risk-based approach to governance makes it possible to grant default access to low-risk data while enforcing stricter controls on sensitive information [7]. For instance, product usage metrics might be widely accessible, but customer financial data would require approval workflows and row-level security.
To strengthen accountability, implement a RACI matrix - a tool that clarifies who is Responsible, Accountable, Consulted, and Informed for key decisions, such as changing a KPI definition or certifying a dataset [5][7]. Additionally, replace manual approval processes with policy-driven automation. For example, access requests can be automatically routed to the appropriate domain owner based on metadata tags [7].
Think of governance friction like the brakes on a Formula 1 car: it’s not about halting progress, but about maintaining control while moving at high speeds [6]. By aligning governance with business priorities, organizations can accelerate innovation without sacrificing security or trust.
Setting Up Role-Based Access Controls (RBAC)
RBAC organizes access into three key layers: Data Layer (raw datasets and identifiers), Experience Layer (dashboards and reports), and Capability Layer (rights to export, share, or manage users) [9]. This layered structure ensures product managers (PMs) can work with the data they need while adhering to governance standards. By limiting risky interactions with data, this approach strengthens the overall governance framework.
Start by restricting high-risk actions like bulk exports, access to raw identifiers, and API usage before granting dashboard viewing rights [9]. For instance, a PM reviewing product adoption metrics might need access to aggregated user behavior but shouldn't be able to export a CSV containing individual email addresses or customer IDs. Controlling what data can leave the system helps prevent permanent data breaches.
To avoid "permission creep" - where users accumulate unnecessary access rights over time - use time-bound exceptions. If a PM requires temporary access to sensitive datasets for a specific project, ensure they submit a request with clear approvals and defined expiration dates [9].
Configuring Permissions and Policies
Permissions should match the specific needs of each role. For example:
Executives: Require access to strategic dashboards.
Analysts: Need tools for advanced querying.
Managers: Monitor departmental metrics.
Viewers: Focus on interpreting visualizations.
For tools that handle behavior analytics, restrict access to high-risk features like session replays or personal user views [9].
Using SSO for Secure Authentication
Centralized identity management systems like Azure AD or Okta simplify permission updates when employees join, switch roles, or leave the organization. This automation reduces the manual effort of updating access across multiple tools and minimizes the risk of orphaned accounts with outdated permissions.
With SSO integration, PMs only need to authenticate once to gain access across all connected tools, eliminating the need to manage multiple credentials. For example, if someone moves from a product analyst role to a product manager position, their permissions automatically update through the identity provider and apply to all relevant systems. This ensures permissions stay aligned with user roles and prevents security gaps. At the same time, SSO maintains a smooth user experience, reinforcing the governance model discussed earlier.
Using Querio's Semantic Context Layer
Querio’s semantic context layer works alongside governance frameworks and RBAC controls to ensure consistency throughout data analysis. This layer defines metrics, joins, and logic in a unified way, so every product manager (PM) has a consistent foundation when analyzing data. By establishing one authoritative version of metrics across queries, dashboards, and notebooks, teams can avoid conflicting KPIs. This eliminates the common issue of "metric drift", where multiple teams report varying numbers for the same KPI - a problem that often leads to 20-50 conflicting versions in organizations without semantic governance [2].
The semantic layer acts as a bridge between PMs and the data warehouse. It translates business questions into accurate SQL queries without requiring technical expertise. For instance, when a PM asks, “What was the retention rate for iOS users last month?” Querio uses standardized definitions to pull the correct data, including tables, joins, and calculations. This approach integrates seamlessly with existing data governance implementation and access control structures.
Creating a Centralized Logic Layer
A centralized logic layer reinforces consistent analytics across the board. To build this, start by defining your core metrics in Querio’s semantic layer dashboard. For example, you could create a custom churn rate metric like this:
SUM(CASE WHEN last_login < DATEADD(day, -30, CURRENT_DATE) THEN 1 ELSE 0 END) / COUNT(DISTINCT user_id)
This metric would pull directly from your data warehouse, whether it’s Snowflake or BigQuery [1]. Next, configure the joins between datasets - such as linking product_usage to user_profiles on user_id - so PMs don’t need to worry about database relationships.
Querio also includes version control similar to Git. You can tag updates (e.g., v1.2 for Q2 2026 changes) and roll back if necessary, all while maintaining a complete audit trail [10]. For example, if you redefine "conversion rate" to exclude trial users and focus only on paid users, Querio saves the updated version while preserving the previous one for historical comparisons.
A mid-sized SaaS company that implemented a semantic layer saw dramatic results. By standardizing "user engagement" metrics across 50+ teams, they reduced discrepancies from 28 different definitions to just one. This change cut dashboard build times by 70% - from two weeks to three days - and improved forecast accuracy by 25%.
Enabling Reusable and Accurate Analytics
Once core metrics are established and version control is in place, PMs can reuse these consistent definitions across all analyses. Instead of recreating logic repeatedly, PMs simply reference predefined metrics like "retention_cohort" or "customer_acquisition_cost." Querio automatically applies the correct calculations, filters, and joins. And when a metric is updated - say, by adding Android segmentation to a retention calculation - the change is instantly reflected in all dashboards and queries that use it.
This reusability allows governance to scale without creating bottlenecks. For example, a global analytics team standardized the "session duration" metric across regional PM teams. The result? Query accuracy improved from 62% to 98%, saving 1,200 engineering hours each year. PMs gained the ability to work independently while data teams retained control over business logic.
Querio also integrates RBAC directly into the semantic layer, enabling granular permissions. For instance, PMs might have access to query "product_metrics" but be restricted from editing "finance_joins" or viewing PII fields [10]. This ensures governance remains intact, even as self-serve analytics expand across the organization.
Setting Up Querio for AI-Powered Self-Serve Analytics
With the semantic layer in place, product managers (PMs) can directly query live warehouse data while maintaining governance and accessing real-time insights. Querio integrates seamlessly with existing infrastructures like Snowflake, BigQuery, Amazon Redshift, ClickHouse, or PostgreSQL. This integration eliminates the need to move or duplicate data, ensuring governance is upheld while enabling natural language querying and interactive dashboard creation.
Connecting to Your Data Warehouse
Connecting Querio to your data warehouse is simple and takes about 10 minutes. Start by logging into Querio's admin dashboard, navigating to Data Connections, selecting your warehouse type, and entering the required credentials. For Snowflake, you'll need the account URL, warehouse name, and role; for BigQuery, the project ID; and for Redshift, the cluster endpoint. Authentication is handled securely using OAuth 2.0 or API keys with least-privilege IAM roles, ensuring Querio can access data without making any changes [11].
All connections use TLS 1.3 encryption and zero-copy querying, keeping your data in place to meet compliance standards. For instance, a SaaS company connected its Snowflake warehouse in under 10 minutes, allowing PMs to securely query 50TB of customer data. Post-implementation audits revealed an 85% drop in governance violations compared to their previous BI tool [10].
Querying Data with Natural Language
Querio's AI-powered query tool enables PMs to ask questions in natural language while maintaining strict governance protocols. For example, PMs can type, "What is the monthly active users trend for iOS vs. Android in Q1 2026?" into the AI query bar. Querio interprets the question, maps it to the warehouse schema using the semantic layer, and generates SQL or Python code as needed. A cohort retention analysis, for instance, might produce Python code with Pandas for survival analysis, ready for export to dashboards [12].
The platform's accuracy is driven by a language model fine-tuned on your specific schema, achieving a 95% first-pass success rate. In one case, a PM queried, "Show weekly revenue impact of feature X rollout on enterprise customers in the US East Coast, formatted with USD and MM/DD/YYYY dates." Querio generated SQL that joined usage logs with billing tables, uncovering a $245,000 revenue boost in March 2026 and a 12% increase in conversions. This self-service approach reduced BI team ticket requests by 70% while maintaining governance through automatic lineage audits [12].
Once the desired results are retrieved, PMs can seamlessly transfer insights to dashboards or notebooks for further analysis.
Creating Dashboards and Notebooks
Querio's notebook environment allows for interactive data exploration with SQL and Python cells, complete with AI autocompletion and visualization tools like Matplotlib and Plotly. PMs can duplicate shared notebooks, embed live queries, and export visualizations directly to dashboards. These features maintain role-based access control (RBAC) and audit trails, ensuring governance remains intact.
For example, a PM used a notebook to analyze A/B test results on user engagement, visualized the findings with US-standard bar charts (using comma-separated thousands), and pinned the key charts to a dashboard that refreshed every 15 minutes [11]. Creating dashboards is just as straightforward: click New Dashboard from any query or notebook, drag and drop chart types, and add filters like dropdowns for regional segments (e.g., "US vs. EU"). Reports can also be scheduled for export in US-standard formats (e.g., $1,234.56, 05/06/2026) and shared via public links with view-only RBAC.
In one scenario, a retail PM built a "Product Performance" dashboard to track sales in imperial units (lbs) across states. By sharing this dashboard with executives, the team improved resolution times for stock issues by 40%, all without needing IT involvement [10].
Automating Data Quality and Compliance
Self-serve analytics depends on reliable data. Without automated quality checks and compliance tracking, governance frameworks can quickly crumble. Companies relying on manual processes take three times longer to detect data issues compared to those using automated validation. Additionally, businesses without clear governance are 2.5 times more likely to experience PII exposure incidents [13].
Setting Up Validation Rules and Lineage Tracking
Querio simplifies data validation with a risk-based tiering system. For example:
Raw datasets in sandbox environments undergo minimal checks.
Curated datasets require basic validations like null checks and adherence to freshness SLAs.
Certified datasets - used for executive reporting - must pass rigorous validation, including referential integrity tests, documented lineage, and designated ownership before project managers (PMs) can access them [7].
This tiered structure ensures that low-quality data never reaches decision-makers. For instance, a dataset must clear automated tests for completeness, freshness, and lineage before earning the "Certified" label. Querio visually represents this status with health badges in its interface - a green checkmark means "Passed Quality Checks", giving PMs confidence in the data [13].
Automated lineage tracking further enhances data reliability by documenting every transformation from the source to the dashboard. When a PM queries customer revenue data, Querio automatically logs the warehouse tables accessed, joins applied through the semantic layer, and the business logic enforced. This level of visibility reduces data recovery time from 3–5 days to an average of just 24 hours when issues occur [13].
With validation rules and lineage tracking in place, metadata management adds another layer of protection for data integrity.
Managing Metadata and Audit Logs
Querio's metadata-first design ensures that every dataset carries its definitions, quality indicators, and access policies. This approach prevents metric drift, ensuring consistent data interpretation [14]. Automatic schema change detection compares each data refresh against an approved baseline, flagging any changes - like additions or deletions - before they disrupt dashboards.
Audit logs provide detailed records of every interaction, including user ID, timestamps (formatted as MM/DD/YYYY HH:MM AM/PM), action type, resource accessed, IP address, and result status. These logs are invaluable for compliance reviews and incident investigations. Querio also integrates with enterprise identity systems like Microsoft Entra ID and Okta, automatically revoking access to Querio and data warehouses when an employee’s account is deactivated [15].
To prevent data sprawl and minimize storage costs, Querio automatically flags datasets that haven’t been refreshed in 90 days for decommissioning. These automated processes ensure PMs can access data independently while governance teams maintain the compliance and security standards they need.
Monitoring Governance Performance
Once you've set up governance controls and self-serve analytics, the next step is keeping a close eye on their performance. Without tracking the right metrics, it’s impossible to know if your policies are streamlining data access for product managers (PMs) or unintentionally creating roadblocks. Regular monitoring can help you catch early warning signs like shadow BI practices or certified datasets that aren't being used.
Tracking Key Governance Metrics
To strike the right balance between access and control, focus on metrics that offer clear insights. For instance, Monthly Active Users (MAU) is a great indicator of engagement. Ideally, 70% or more of your licensed users should be actively using the tools each month [3]. Another critical metric is the self-service ratio, which measures how many reports are created by business users versus IT teams. The goal? Hit 60% or higher within 18 months of rolling out your governance framework [3][4].
Certification coverage is another important area to track. This metric shows how much trust departments place in governed data. A strong benchmark is having 80% or more of departments actively using their certified datasets [3]. On the flip side, keep an eye out for shadow BI - unauthorized or redundant data practices. Look for datasets that duplicate certified data sources or personal workspace reports with more than 10 viewers to catch these issues early [3].
A real-world example: Between 2024 and 2026, a financial services firm scaled its Power BI user base from 50 to 5,000 in just 18 months, all without a single data incident. Within the first three months, they certified 8 key finance datasets and hit 82% monthly active usage across 47 certified datasets by the 18-month mark [3]. These metrics not only highlight success but also provide a foundation for ongoing improvements, which we’ll explore in the next section.
Using Dashboards for Continuous Improvement
Governance dashboards, like those from Querio, make it easier to spot trends and fine-tune policies on the fly. For example, you can monitor access violations and policy breaches to address security risks before they escalate. Another key metric to track is the data refresh success rate - certified datasets should maintain at least 99.5% uptime [3]. In one case, the financial services firm used automated decommissioning to identify and retire 140 outdated datasets between months 7 and 12, cutting down on data sprawl and storage costs [3].
Dashboards also help pinpoint where PMs might be hitting roadblocks. If time-to-insight metrics show delays, it’s worth investigating. Are access requests taking longer than the target of 48 hours? Are data quality issues slowing down queries? [3]. Instead of relying on assumptions, use these insights to adjust your governance policies based on actual data.
Conclusion
Giving product managers access to self-serve data doesn’t mean you have to compromise on governance. Instead, it’s about creating smarter systems that strike the right balance. By implementing role-based access controls, a unified semantic layer, and automated validation rules, you can empower product managers without losing control. When these components are aligned, PMs gain the autonomy they need, while your organization retains the oversight it requires.
Governance and accessibility don’t have to clash. Companies that balance the two effectively report a 40-60% increase in decision-making speed, all while staying compliant. The key? Build these controls into your processes from the start, instead of trying to patch governance issues later. Start with broad access and refine it based on real-world risks, not theoretical ones.
Querio's AI-powered platform makes this balance achievable. It connects directly to your data warehouse with read-only access, applies governance through its semantic layer, and ensures every query is traceable with complete audit trails. Product managers can ask questions in plain English and receive precise answers powered by SQL - cutting out IT bottlenecks, eliminating shadow BI practices, and closing compliance gaps. With Querio, queries are consistent, metrics are reliable, and results are fully inspectable, enabling teams to track meaningful, data-driven improvements.
To make this transition successful, focus on three key areas:
Adoption metrics: Aim for 70-85% of PMs actively using self-serve tools within 3-6 months.
Business impact: Measure how quickly and accurately decisions are being made.
Governance metrics: Track compliance violations and audit trail completeness.
Monitor these metrics through dashboards on a monthly basis, and refine policies based on actual usage patterns rather than assumptions. This ensures that every governance decision directly contributes to business results.
When done correctly, shifting from IT-managed reports to PM-owned analytics takes about 6-9 months. The payoff? A 60-70% reduction in IT’s report maintenance workload, faster product development cycles, and smarter decisions powered by real-time data. Start small with a pilot group, validate your governance framework, and scale methodically - always keeping an eye on the metrics that matter most.
FAQs
What data should PMs get by default vs. by request?
Product Managers (PMs) should have direct access to the core data they need for daily decision-making. This includes key metrics, operational dashboards, and relevant real-time data. However, when it comes to more sensitive information - like financial records, personally identifiable information (PII), or data governed by compliance regulations - access should only be granted upon request and after proper governance checks.
This approach strikes a balance: PMs can act swiftly with the data they need, while sensitive information remains protected under strict security and governance protocols.
How do we prevent KPI conflicts in self-serve analytics?
To keep KPI conflicts at bay in self-serve analytics, it's crucial to have governance practices that strike a balance between giving users freedom and maintaining control. Here's how you can achieve that:
Define a centralized semantic layer: This ensures everyone works with consistent data definitions, avoiding misunderstandings and discrepancies.
Enforce role-based access controls (RBAC): Limit data access based on roles to protect sensitive information and maintain order.
Maintain a data catalog: Documenting metadata helps users understand the data's context, lineage, and definitions.
Additionally, regular reviews, open collaboration across teams, and automated compliance checks go a long way in ensuring KPI consistency. These practices help reduce data inconsistencies and prevent unnecessary sprawl.
What governance metrics prove self-serve is working?
Key governance metrics showcase impressive results: up to an 80% reduction in reporting time, fewer errors in forecasts, and a 40-60% decrease in IT support tickets. Additionally, tracking adoption rates provides clear evidence of how well the system is being embraced. Metrics such as faster decision-making and higher user engagement highlight the success of self-serve tools, all while ensuring governance standards remain intact.
Related Blog Posts


