Your Guide to Data Analytics Strategy
Build a powerful data analytics strategy from the ground up. This guide provides actionable steps for startups and PLG companies to turn data into growth.
https://www.youtube.com/watch?v=_eMnqdrZx_Q
published
Outrank AI
data analytics strategy, data strategy, business intelligence, product-led growth, data governance
4fae0b0b-4bb4-4068-b3cc-c5296c7850be
A data analytics strategy is your company's game plan for turning raw information into a real competitive advantage. It’s not just about buying the latest, shiniest tools. Think of it as a business-first roadmap that details how you'll manage, govern, and—most importantly—use your data to hit your most critical goals.
It’s the blueprint that elevates data from a simple byproduct of your operations into your most powerful asset for growth.
Why You Can’t Afford to Ignore a Data Analytics Strategy
Too many companies, especially in the early stages, stumble into the same trap: they collect absolutely massive amounts of data with no real plan, just hoping that brilliant insights will magically materialize. This "collect everything" approach almost always leads to a dead end of wasted resources, confusing reports, and big decisions still being made on gut instinct alone.
A proper data analytics strategy flips that entire model on its head.
Instead of starting with, "We have all this data, what can we do with it?" you begin by asking, "What are the most urgent business problems we need to solve?" This simple but powerful shift ensures that every single bit of effort your data team puts in is directly tied to a tangible outcome.
This process draws a straight line from your core business objectives to the analytics that will track them, which is what ultimately fuels sustainable, predictable growth.
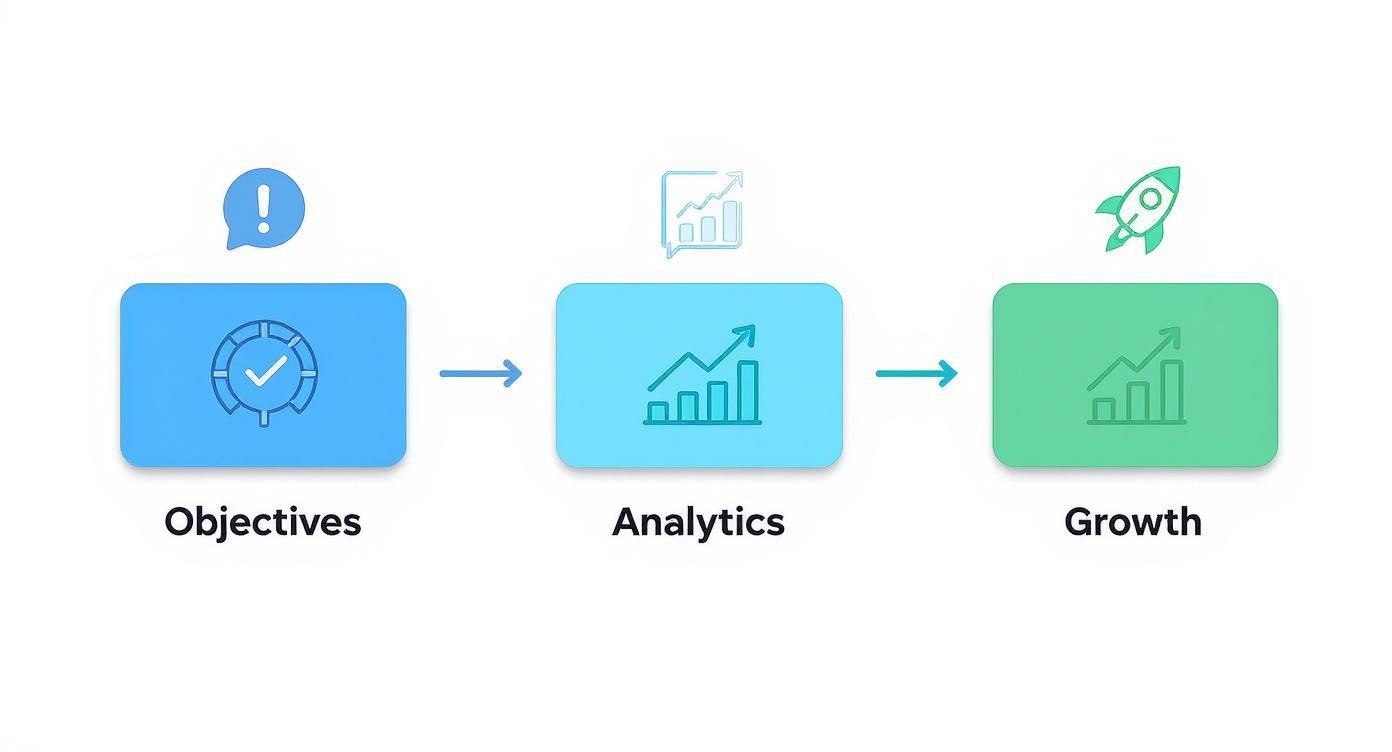
The image above really drives home a critical point: analytics isn't the final destination. It's the bridge that connects your company's high-level mission to real, measurable progress on the ground.
To get started, let’s look at the foundational elements you'll be building. This table outlines the core pillars of a winning data strategy, giving you a quick reference for what’s ahead.
Core Pillars of a Winning Data Analytics Strategy
Pillar | Core Objective | Common Pitfall to Avoid |
|---|---|---|
Objectives & Metrics | Align all data efforts with specific, measurable business goals. | Measuring vanity metrics that don't correlate to actual business success. |
Data Governance & Lineage | Establish clear ownership and trust in your data's quality and origins. | Treating data as a "black box" where no one knows the source of truth. |
Architecture & Tooling | Build a scalable, efficient tech stack that meets current and future needs. | Buying expensive tools before having a clear strategy for using them. |
Operationalization | Make data accessible and actionable for everyone through reports, self-serve, etc. | Creating dashboards that look impressive but don't lead to any real action. |
Adoption & Change | Foster a company-wide culture that values and uses data in daily decisions. | Assuming that just building analytics tools will make people use them. |
Each pillar builds on the last, creating a solid foundation for becoming a truly data-informed organization.
Tying Your Data Directly to Business Goals
A solid strategy forces you to make sure your data work is always purposeful. If you're a product-led company, for instance, this means aligning every analytics project with goals like boosting user activation, reducing customer churn, or driving adoption of a new feature. By defining these goals first, you create a clear and logical framework for deciding what to measure and why it matters.
Let's take a team focused on reducing churn. They aren't just staring at a single churn rate metric all day. Instead, they're building an analytical system designed to answer much deeper, more valuable questions:
Which specific user segments are most likely to churn in the next 30 days?
What in-app behaviors and actions correlate with long-term retention?
Did our last big feature release actually have a positive impact on our 90-day retention rate?
Getting answers to questions like these requires far more than a simple dashboard. It demands a deliberate, thought-out strategy for collecting the right data, modeling it correctly, and interpreting the results.
A data analytics strategy isn't some dense, technical document that lives on your data team's hard drive. It's a business plan that spells out how you will use information to make smarter decisions, build better products, and move faster than your competition.
Moving From Reactive Reporting to Proactive Insight
Without a strategy, data teams inevitably get stuck in a reactive hamster wheel. They spend all their time fielding an endless stream of one-off requests for reports and random data pulls from across the company. This firefighting leaves them with zero time for the proactive, exploratory analysis that actually uncovers hidden growth opportunities.
A formal strategy empowers your team to break that cycle by building a scalable, reliable foundation for generating insights.
This means creating a cohesive system where data flows seamlessly from all your different sources—your app, CRM, payment processor—into a central repository where it’s clean, organized, and ready for analysis. The components that make up this system are often called the modern analytics stack, and they are what turn messy raw data into valuable business intelligence.
Ultimately, a successful data analytics strategy creates a shared language around metrics. It empowers everyone, from the CEO down to individual product managers, to use data confidently in their day-to-day work. It's the critical difference between a company that has data and one that is truly data-driven. This guide will give you the practical roadmap to build that capability from the ground up.
Defining Your Business Goals and KPIs

Before you write a single query or even think about a dashboard, you have to answer the most important question: "Why are we even doing this?" A data strategy without clear business goals is just an expensive hobby. It’s how you end up with beautiful charts that nobody looks at and a data team that feels more like a report factory than a strategic partner.
Your starting point should never be the data itself. It has to be a specific, high-level business ambition. This is how you tether every analytics effort directly to revenue, growth, and customer value from day one.
From Ambition to Actionable Metrics
High-level goals like "improve user engagement" are great for a mission statement, but they're useless for actual analysis. They're too fuzzy to measure or influence directly. The real work is breaking these lofty ambitions down into tangible, measurable Key Performance Indicators (KPIs).
For product-led companies, this translation is everything. It’s the difference between guessing what works and knowing exactly which levers to pull.
Here’s what that looks like in practice:
Vague Goal: Improve user retention.
Specific Objective: Reduce new user drop-off in the first 7 days.
Actionable KPI: Decrease the percentage of users who sign up but don’t complete the core onboarding flow from 40% to 25% by the end of Q3.
See the difference? That level of specificity gives your team a clear target. Now you know exactly what data to collect (onboarding funnel events), what metric to track (onboarding completion rate), and what success looks like. For a deeper dive, check out our guide to understanding Key Performance Indicators and connecting them to your business strategy.
Using the Metrics Tree Framework
One of the best tools I’ve found for this is the "Metrics Tree." It’s a simple but incredibly effective way to visualize how high-level objectives break down into smaller, contributing metrics that individual teams can actually control.
Let’s say your primary goal is to increase Monthly Recurring Revenue (MRR). Your metrics tree might look something like this:
Level 1 (Main Goal): Increase MRR
Level 2 (Contributing Factors):
Increase New MRR
Increase Expansion MRR
Decrease Churned MRR
Level 3 (Tactical Levers):
For New MRR: Increase website conversion rate, improve trial-to-paid conversion.
For Expansion MRR: Increase adoption of add-on features, drive upgrades to higher tiers.
For Churned MRR: Reduce subscription cancellations, decrease payment failures.
This framework forces clarity. A product team can own feature adoption to drive expansion, while the marketing team is laser-focused on trial conversion to boost new MRR. Everyone understands exactly how their work ladders up to the big picture.
Getting Everyone on the Same Page
Here’s a hard truth: your data strategy can't be built in a silo. It needs buy-in from leadership, product, marketing, sales—everyone. The best way to get it is through collaborative workshops where you align on the most urgent business questions.
Don't ask stakeholders "What data do you want?" Ask them "What are the most important decisions you need to make this quarter, and what information do you lack to make them confidently?" This simple reframe shifts the entire conversation from data outputs to business outcomes.
Get everyone in a room with a whiteboard and map out the goals and their corresponding metrics together. This collaborative process ensures the final KPIs aren't just a list from the data team; it's a shared roadmap the whole company is invested in.
A few tips for running a successful alignment workshop:
Start with the "Why": Kick things off by reviewing the company's annual or quarterly objectives (OKRs). This grounds the conversation in what already matters.
Brainstorm Questions, Not Metrics: Ask teams to list the questions they wish they could answer. This uncovers the real analytical needs hiding behind their requests.
Prioritize Ruthlessly: You can't measure everything at once. Force a prioritization exercise to identify the top three to five questions that would have the biggest business impact if answered. These become the bedrock of your initial data strategy.
This alignment ensures your analytics work is laser-focused from the start, helping you build momentum and prove value fast.
2. Mapping Your Data Landscape and Governance
Alright, you've got your North Star metrics figured out. Now it’s time to look inward and get a handle on the raw materials you're working with: your data.
For most startups, data isn’t in one neat place. It's scattered across a dozen different SaaS tools—product events are in Segment or Mixpanel, CRM contacts are in HubSpot, and support tickets are sitting in Zendesk. It can feel like a mess.
This is where so many data initiatives trip up before they even start. If you don't know what data you have, where it lives, or if you can even trust it, any analysis you attempt is built on a house of cards. The goal here isn’t to boil the ocean, but to create a simple, practical inventory that starts turning that chaos into a reliable asset.
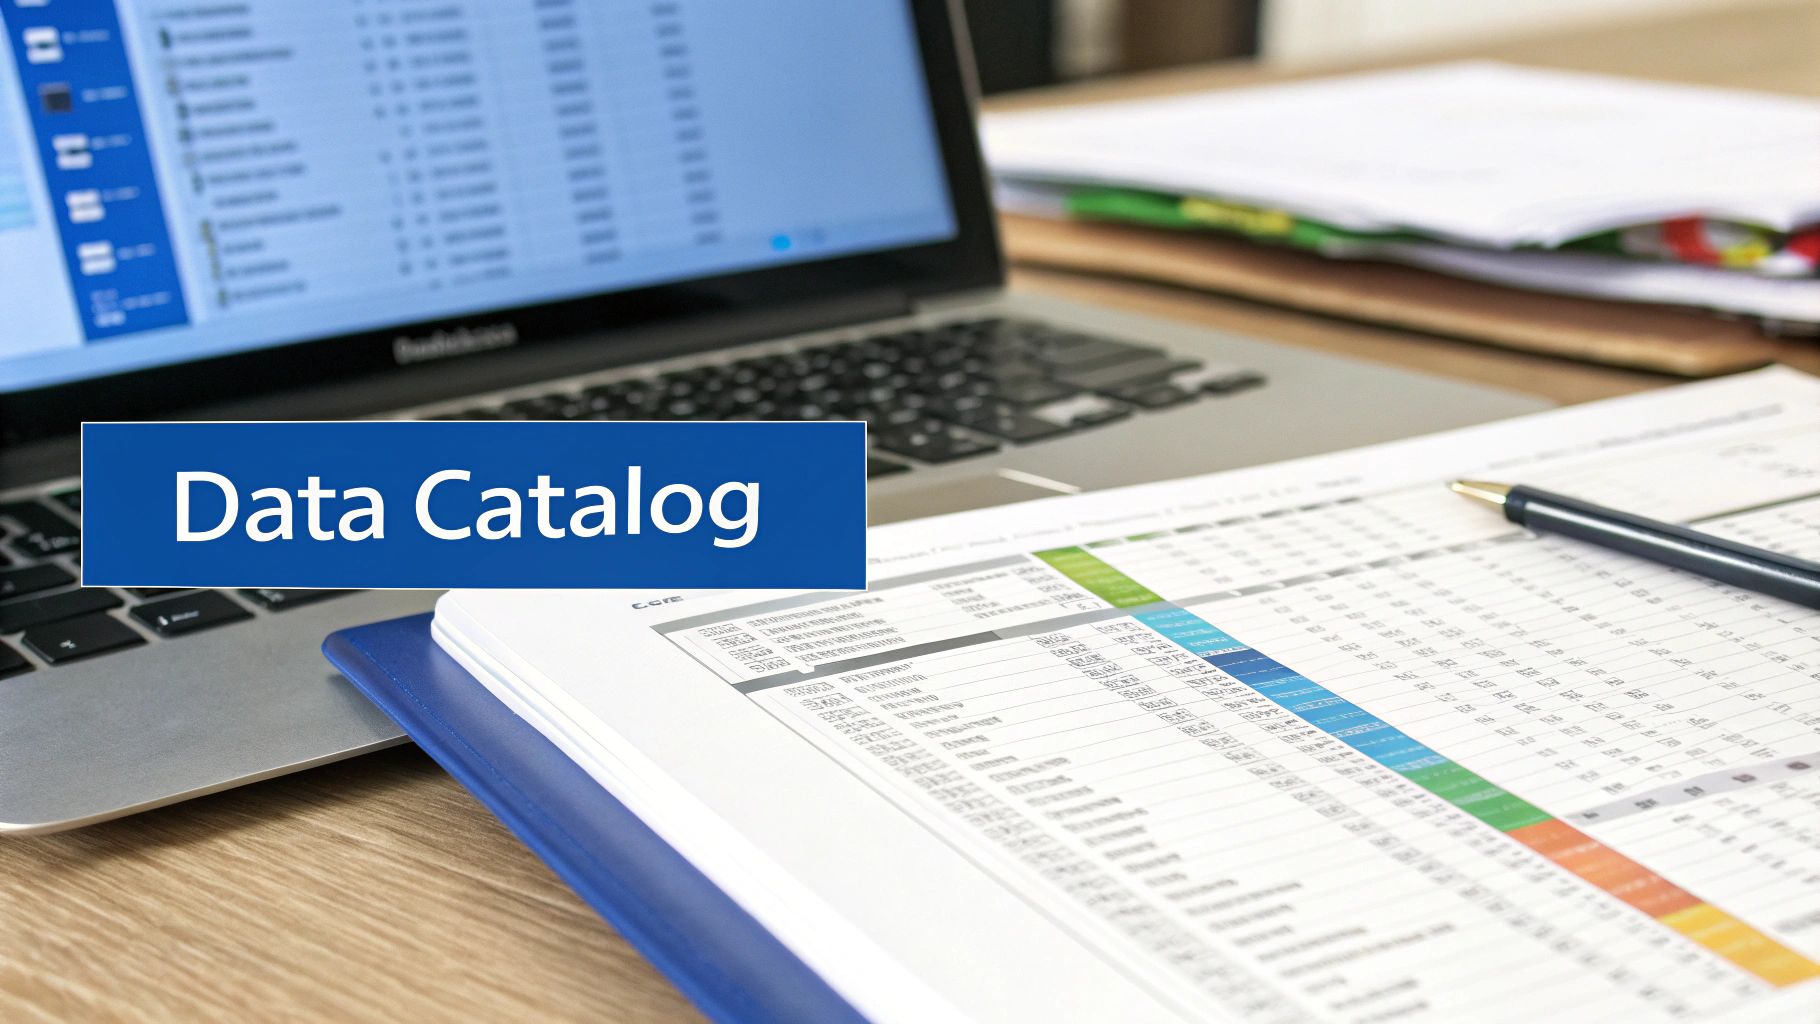
Creating Your First Data Catalog
The term "data catalog" sounds intimidating and frankly, a bit corporate. But it doesn't have to be. For a startup, it's just a simple inventory of your data sources. Think of it as your single source of truth for all things data, documenting what you have and who's responsible for it.
Seriously, just start with a spreadsheet.
For each data source (your production database, Google Analytics, Stripe, HubSpot, etc.), jot down a few key things:
Data Source: What is it? (e.g., "PostgreSQL Production DB").
Key Data Points: What’s the good stuff in there? Think user sign-up events, subscription status, or customer support ticket history.
Data Owner: Who’s the go-to person for this data? This is usually a product manager for feature data or a sales ops leader for the CRM.
Quality Assessment: A simple gut check. Is the data High, Medium, or Low quality? Be honest.
This process alone is incredibly valuable. It forces conversations about where your most important information actually lives and flags any obvious quality issues early, saving you from massive headaches later.
Establishing Lightweight Data Governance
"Data governance" is another one of those phrases that can make people at a fast-moving company want to run for the hills. It conjures up images of slow committees and bureaucratic red tape.
But for a startup, governance is simply about establishing trust and consistency. It’s making sure that when your marketing and product teams both talk about an "active user," they're actually talking about the same thing.
This is absolutely critical for a successful data analytics strategy. Without shared definitions, different teams will pull different numbers for the same metric. Trust in data plummets, and confusion reigns.
Don't try to build a perfect, all-encompassing governance policy from day one. Instead, just define your top five most critical business terms. Getting everyone aligned on what 'Active User,' 'New Customer,' and 'Churn Event' actually mean will solve 80% of your initial data squabbles.
Start with a shared document—a simple glossary. For each key term, define it in plain English, note the data source used to calculate it, and name the person or team who owns that definition. This simple act of writing it down creates accountability and a shared language.
As you grow, you can explore more structured data governance best practices that scale with you.
Why a Solid Data Foundation Matters Now More Than Ever
Taking the time to map things out isn't just busywork; it's more important than ever. The demand for clear, actionable data is exploding and changing how companies are built.
The global data analytics market, valued at around $65 billion in 2024, is on track to hit over $400 billion by 2032. That's a compound annual growth rate of 25.5%, a massive signal that data-driven decision-making is becoming standard practice. You can dig into the numbers from Fortune Business Insights to see just how fast this shift is happening.
Mapping your data and setting up basic governance are foundational business activities. They ensure that as you scale, your data remains a trusted asset, not a source of frustration. This clarity is what allows platforms like Querio to connect to your sources and deliver answers everyone can rely on—because the underlying definitions and locations of your data are finally understood by the whole team.
Choosing Your Analytics Stack and Tools
You've defined your business goals and mapped out your data. Now for the fun part: the technology. Picking the right tools is a huge step in your data analytics strategy, but it’s easy to get lost in the sea of options. The real secret is to choose a stack that solves your problems today without cornering you tomorrow.
For a growing company, this is always a balancing act between power, cost, and simplicity. You need a setup that can scale with your data and complexity, but you probably don't have a massive engineering team to manage it. This practical mindset keeps you from sinking a ton of cash into an overly complex system you just don't need yet.
https://www.youtube.com/embed/_eMnqdrZx_Q
Deconstructing the Modern Data Stack
The "modern data stack" isn't a single product. It’s more like a team of specialized tools that you assemble to work together. Each piece has a specific job in the journey from raw data to a game-changing insight.
Here are the core components you’ll need to think about:
Data Warehouse: This is home base for all your structured data. It's the central library for all things analytics. Big names like Snowflake, Google BigQuery, and Amazon Redshift are built for speed and can grow right alongside you.
ETL/ELT Tools: Think of these as the plumbing. They move data from all your sources—your CRM, product database, marketing platforms—into your data warehouse. Tools like Fivetran and Airbyte automate this, saving your engineers from a world of headache.
Visualization and BI Platforms: This is the layer your team actually sees and interacts with. It’s where data becomes charts, graphs, and dashboards. Platforms like Tableau, Looker, or Power BI help everyone see and understand what the data is telling them.
Going this route gives you tons of flexibility, but it also comes with a catch: complexity. You become the system integrator, responsible for making sure all the pieces talk to each other. That can be a pretty heavy lift.
The Rise of Unified Analytics Platforms
There’s another way, and it's getting a lot of traction, especially with startups and mid-sized companies: the unified analytics platform. Instead of you stitching everything together, these solutions bundle the most important functions into one cohesive system.
A platform like Querio, for example, brings data integration, modeling, and self-service analytics into one place. This slashes the overhead of managing a stack with multiple vendors. It means someone on the marketing team can ask a question in plain English and get an answer instantly, without waiting for a data analyst to build a report in a totally separate BI tool.
This all-in-one approach streamlines your entire data strategy. It creates a single source of truth that's actually accessible to everyone, not just the data experts.
The best tool for your company is the one that gets used. A simpler, unified platform with high adoption will always deliver more value than a powerful, complex stack that only a few experts know how to operate.
This shift isn't just a trend; it's a reflection of where the market is headed. The global data analytics market is estimated at $50 billion in 2024 and is projected to explode to $659 billion by 2034. That massive growth is being driven by the AI and machine learning that power the very self-service features making modern platforms so valuable. You can dive deeper into this explosive market growth on Precedence Research.
As you select your stack, it's smart to think about what's next. Integrating modern machine learning operations will be key. Taking a look at these MLOps best practices can help ensure the tools you choose today can support more advanced analytics down the road. The right architectural choices now will set the stage for a much more powerful data analytics strategy tomorrow.
Activating Insights Across Your Organization

You can build the most elegant data stack and craft a brilliant strategy, but it's all just an academic exercise if the insights stay locked away with the data team. This is where the rubber meets the road. The final, and arguably most important, phase is operationalization—solving that stubborn "last mile" problem of turning analysis into real-world business decisions.
It's all about getting the right information to the right person, in the right format, exactly when they need it. This is how you move from simply looking at historical reports to creating a dynamic culture where data is an active partner in every decision. When you get this right, insights aren't just seen; they're acted upon.
Beyond the Executive Dashboard
Of course, every strategy needs a set of core dashboards for leadership. These are your high-level health monitors, tracking the big-picture KPIs you defined at the start. They’re absolutely essential for keeping executives in the loop and ensuring everyone is pulling in the same direction.
But a truly data-driven company doesn't stop there. The real magic happens when data empowers decisions at every level—from a product manager deciding which feature to prioritize next, to a customer success manager spotting an at-risk account before they churn. Relying only on a few centralized dashboards creates a bottleneck and forces your team into a constant state of reaction.
To get from passive reporting to proactive action, you need to deliver insights in three distinct ways:
Centralized Dashboards: The classic, top-down view for leadership and team performance tracking.
Self-Serve Analytics: Giving non-technical folks the power to explore data and answer their own questions, no data team ticket required.
Embedded Analytics: Pushing insights directly into the tools your teams are already using all day, every day.
Each of these serves a different need. A mature data strategy weaves all three together to build a complete system for putting insights to work.
Empowering Teams with Self-Serve Analytics
The whole point of self-serve analytics is to break the dependency on your data team for every little question. When a marketing manager can, on their own, figure out which campaigns drove the best signups last month, the entire organization picks up speed.
But here’s the catch: you can't just hand everyone a BI tool and say, "Have at it." That's a surefire recipe for frustration, conflicting metrics, and a total breakdown of trust in the data.
For self-serve to actually work, you need two things:
A Tool People Can Actually Use: Your team needs a platform that doesn't demand they learn SQL. Modern tools like Querio let users ask questions in plain English, making data exploration feel more like a conversation.
A Foundation of Trust and Training: You have to invest in training and have solid data governance in place. People need to know where to find what they're looking for and, more importantly, trust that the definitions are consistent across the board.
The goal of self-serve isn't to make everyone a data analyst. It's to give every person the confidence to use data to make their own work better. That's the bedrock of a data-informed culture.
This shift also frees up your data team. Instead of being swamped with ad-hoc requests for simple CSV pulls, they can focus on high-impact, strategic work, like building predictive models or deep-dive analyses that uncover the next big growth opportunity.
Putting Insights Where the Work Happens
Embedded analytics is the most seamless way to weave data into daily workflows. Instead of forcing your team to stop what they’re doing and log into a separate BI tool, you bring the insights directly to them.
This approach is incredibly powerful because it connects data directly to action. For instance, a sales leader doesn't just get a report of accounts ready for an upsell; they see a "High Upsell Potential" tag right next to an account's name in their CRM.
Think about these real-world scenarios:
For Product Teams: An embedded dashboard inside your admin panel shows real-time adoption of a new feature right after launch.
For Customer Success: A customer health score and recent usage data appear directly in their support tool, like Zendesk or Intercom.
For IoT Businesses: When dealing with the Internet of Things, effective IoT data analytics strategies are crucial for turning raw sensor data into actionable alerts for field technicians.
Looking at the broader market, predictive analytics still holds the largest share, making up 40.12% of revenue in 2024. This shows how much companies want to anticipate what's next. The real evolution, however, is toward prescriptive analytics—tools that not only predict an outcome but also recommend the best course of action. This is a perfect fit for embedded use cases.
By embedding analytics, you remove the friction. You make the data-informed decision the path of least resistance. This is where a platform like Querio really shines, offering SDKs that let you drop white-label dashboards and "Ask your data" features right into your own application, making insights a native part of the experience.
7. Fostering Adoption and Measuring Success
You can build the most elegant, technically sound data analytics platform in the world, but it’s completely worthless if no one uses it. This final stretch isn't a technical challenge; it’s a human one. It's all about change management.
Success here means making data-informed decisions the default, not the exception. It's about fundamentally shifting how your team operates. This starts by empowering your people, which means more than just handing them a login to a new tool. You have to actively build data literacy across the company, transforming analytics from an intimidating task into an indispensable part of everyone's daily work.
Driving a Culture of Data Literacy
To get your teams genuinely bought in, learning has to be accessible and, frankly, interesting. Formal training sessions are fine, but I’ve found that peer-to-peer, informal learning often sticks much better.
Host Lunch-and-Learns: Forget generic tutorials. Get your product team to walk everyone through how they used a self-serve tool to dissect a recent feature launch. A real-world success story is incredibly powerful.
Appoint Data Champions: Look for those enthusiastic users in marketing, sales, or customer success. Give them a bit of extra training and officially empower them to be the go-to person for their teammates’ questions.
These champions are your secret weapon. They become the translators who bridge the gap between the hardcore data folks and the rest of the business, making analytics feel relevant and approachable.
The real win is creating a feedback loop where teams don't just consume insights—they question them, explore on their own, and contribute back. That collaborative spirit is the true sign of a healthy data culture.
Proving Value and Ensuring Longevity
To keep the momentum going, especially with the leadership team, you have to constantly show the value your analytics strategy is creating. In the early days, focus on small, tangible wins. Did the sales team close a key deal 20% faster because of a new lead-scoring model? Shout that from the rooftops.
As things mature, your measurement needs to get more formal. You need to track both adoption and tangible business impact. You should be able to confidently answer questions like:
Adoption: How many people are actively using our BI tool each week? What percentage of teams are now building their own reports instead of filing a ticket?
Impact: Our churn prediction model was supposed to cut churn by 5%. Did it? What was the actual ROI on that project?
Tying your analytics work directly to financial outcomes is how you secure a budget for next year. For a deep dive into this, check out this guide on measuring the ROI of your AI and BI efforts; it provides a great framework for proving value.
Ultimately, a successful data strategy isn’t a one-and-done project. It’s a living program that gets better through constant feedback, measurement, and iteration.
Frequently Asked Questions
Where Should a Small Startup Even Start with a Data Strategy?
Don't try to boil the ocean. The biggest trap for early-stage companies is trying to analyze everything all at once. It's overwhelming and rarely leads to a clear win.
Instead, pick one—and only one—critical business question to tackle. A great place to start is often a burning issue like, "Why are so many new users dropping off in their first week?" Focus all your initial energy on solving just that. This means identifying the one or two data sources you need, like product usage events, and building your first simple process around that single, high-impact problem.
Nailing that first use case builds the momentum and internal trust you need to justify expanding your data analytics strategy later.
How Can We Build a Data-Driven Culture if We Don't Have a Data Team?
You have to make data a part of the daily conversation, but in a way that isn't intimidating. Start by creating a single, reliable dashboard that tracks just three to five core business metrics. These should be numbers everyone in the company can understand and rally behind.
Then, find a "data champion" on a non-technical team, like marketing or product. Train them to be the go-to person for that dashboard. Their enthusiasm will be infectious.
The goal is to make data accessible and trustworthy, not just available. Celebrate every small win. When a decision is made based on data, broadcast it in Slack or at the all-hands meeting. This is how you build cultural momentum.
What's the Single Biggest Mistake Companies Make with Their Data Strategy?
Easy—they focus on the tools before the strategy. So many companies get lured in by a slick demo for an expensive analytics platform, thinking the software itself is the solution. It never is.
A tool is useless if you haven't first defined what you're trying to achieve. Without clear business objectives, the right metrics to track, and a plan for ensuring your data is clean, you've just bought a very expensive, empty garage. A solid strategy always starts with the questions you need to answer, not the tech you want to buy.
Ready to build a data analytics strategy that empowers your entire team? Querio is an AI-powered platform that lets anyone ask questions in plain English and get trusted answers in seconds. See how you can turn curiosity into clarity and make better decisions faster.

