Business Intelligence
natural language query business intelligence ThoughtSpot vs Power BI vs Tableau 2025
Compare NLQ features, ease of use, pricing, and scalability of ThoughtSpot, Power BI, and Tableau to choose the right BI platform.
In 2025, natural language query (NLQ) features in business intelligence (BI) tools made data analysis accessible to non-technical users. By simply asking questions in plain English, teams could quickly extract insights without needing SQL expertise. This article compares three leading BI tools - ThoughtSpot, Power BI, and Tableau - focusing on their NLQ capabilities, ease of use, pricing, and scalability.
Key Takeaways:
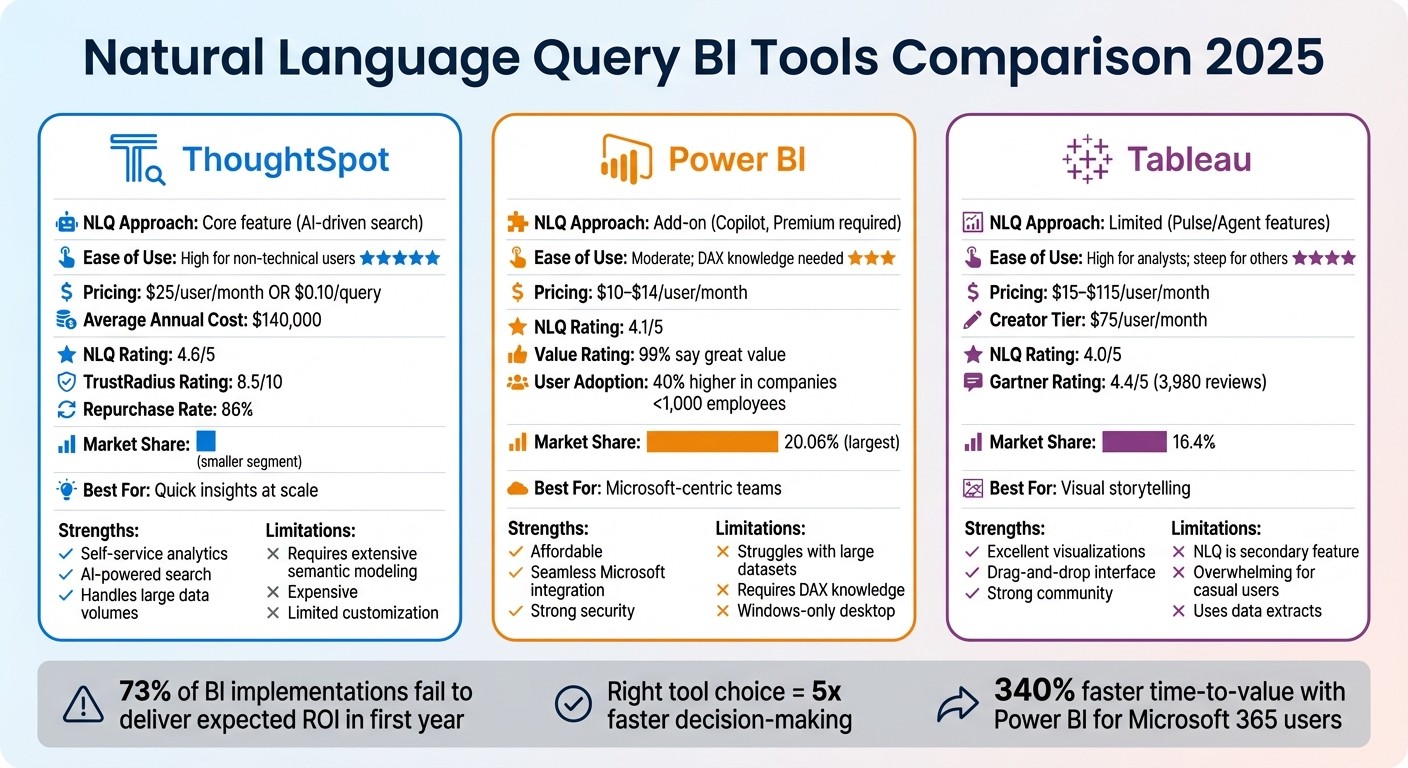
ThoughtSpot: Best for self-service analytics with AI-powered NLQ but requires upfront setup and is costly.
Power BI: Affordable and integrates seamlessly with Microsoft tools, but has limitations with large datasets and requires DAX knowledge.
Tableau: Known for visual storytelling and polished dashboards but less intuitive for NLQ and casual users.
Quick Comparison:
Feature | ThoughtSpot | Power BI | Tableau |
|---|---|---|---|
NLQ Approach | Core feature (AI-driven search) | Add-on (Copilot, Premium required) | Limited (Pulse/Agent features) |
Ease of Use | High for non-technical users | Moderate; DAX knowledge needed | High for analysts; steep for others |
Pricing | $25/user/month or $0.10/query | $10–$14/user/month | $15–$115/user/month |
Best For | Quick insights at scale | Microsoft-centric teams | Visual storytelling |
Choosing the right BI tool depends on your team's technical skills, budget, and data needs. ThoughtSpot excels in NLQ and scalability, Power BI offers strong integrations at a low cost, and Tableau is ideal for creating impactful visuals. Dive into the details to see which platform aligns with your goals.
ThoughtSpot vs Power BI vs Tableau: 2025 BI Tools Comparison
How To Use Natural Language Query (Q&A) In Power BI - Detailed Review [2022 Update]
ThoughtSpot: AI-Powered Search and Insights
ThoughtSpot stands out as an AI-first platform where search-based BI takes center stage. Unlike Power BI's drag-and-drop tools or Tableau's visual canvas, ThoughtSpot lets users type questions like "Who are our top 10 customers by revenue this quarter?" and receive instant answers. It queries data warehouses in real time, eliminating the delays associated with outdated data extracts.
What ThoughtSpot Does Well
ThoughtSpot shines in self-service analytics, especially for non-technical users. Its Spotter Coach feature helps administrators refine AI performance by curating synonyms and processing user feedback, enabling the system to adapt to a company's specific terminology over time [4]. The Matching Panel enhances transparency by showing how user queries map to specific data columns, fostering trust in the results [4]. This clarity makes it a strong tool for data-driven decision-making, a critical requirement for BI tools in 2025.
The platform is also built to handle large data volumes effectively. Users appreciate its fast, ad-hoc reporting capabilities and sleek interface, earning it an 8.5/10 rating on TrustRadius, with 86% of verified users indicating they would repurchase it [7].
"ThoughtSpot provided a twist on the typical Analytics / report builder interface. The natural language query building is just so much easier to use."
Verified User, TrustRadius [7]
Where ThoughtSpot Falls Short
However, ThoughtSpot's natural language search isn't plug-and-play. It demands extensive semantic modeling upfront, requiring your data team to carefully prepare column names, synonyms, and indexing rules - a process ThoughtSpot refers to as "Model Readiness" [2][5]. For organizations with less mature data practices, this setup can delay the platform's value [6].
Pricing is another hurdle. On average, organizations pay around $140,000 annually for licenses and usage. Entry-level pricing starts at $25 per user per month or $0.10 per query, while ThoughtSpot Analytics Pro costs $50 per user per month (billed annually for 25–1,000 users) [5][7].
Customization is also a limitation. The platform struggles with pixel-perfect reporting. Metrics generated through AI search often remain "temporary expressions" and can't be seamlessly integrated into the governed semantic layer [2][4]. For teams needing highly customized visualizations or regulatory-compliant reports, this can be a significant drawback [6][7].
Who Should Use ThoughtSpot
ThoughtSpot is ideal for organizations with well-established data infrastructure and teams seeking quick, exploratory insights rather than static dashboards. If your company has a robust cloud data warehouse and the resources to invest in semantic modeling, ThoughtSpot offers powerful self-service capabilities [6]. It's particularly useful for departments like sales, marketing, or operations, where team members frequently need answers to varied questions without relying on analysts.
However, if your focus is on regulatory reporting, extensive visual customization, or operating within a tight budget, ThoughtSpot may not be the best fit. In the next section, we'll explore how Power BI approaches natural language queries and the advantages of its integration capabilities.
Power BI: Microsoft Integration and Low Cost
Power BI stands out as an affordable option that works seamlessly with Microsoft 365, Azure, and Excel. If your organization relies on these tools, Power BI slots right into your existing setup without needing extra infrastructure or complicated authentication processes. Its Copilot feature, powered by Azure OpenAI, transforms plain-English prompts into visuals and DAX queries, making it easier to interact with your data. Additionally, its integration with Bing and Office allows it to recognize synonyms - like interpreting "area" as "region" in your specific business context [3][8][10].
What Power BI Does Well
One of Power BI's biggest draws is its cost-effectiveness. The desktop version is free, and the Pro tier starts at just $10–$14 per user per month [12]. For perspective, ThoughtSpot averages $140,000 annually, and Tableau Creator costs $75 per user per month [5][7]. It's no surprise that 99% of TrustRadius users say Power BI offers great value for its price [7].
Beyond affordability, Copilot simplifies generating complex DAX queries for on-the-fly calculations, like year-over-year growth or unique ratios that aren't prebuilt into your data model. It also benefits from Microsoft's security features, such as Row-Level Security (RLS) and Column-Level Security (CLS), ensuring users only access data they're authorized to see [3][9][10].
Where Power BI Falls Short
While Power BI's natural language tools are helpful, they come with limitations. The older Q&A feature will be phased out by December 2026, and Copilot - currently only available in English on paid plans - might not handle very large or complex datasets effectively [8][10]. Users have reported that the platform can slow down or become cumbersome when dealing with massive datasets [6][7][11].
Another hurdle is the need to learn DAX, a powerful but challenging formula language [12]. Additionally, Power BI Desktop is limited to Windows, which can be a dealbreaker for Mac-centric teams. Its support for NoSQL databases and REST APIs has also lagged behind some newer competitors [12].
Who Should Use Power BI
Power BI is an excellent fit for organizations already entrenched in the Microsoft ecosystem or those working within tight budgets. If your team relies on tools like Excel, Teams, and Azure, Power BI integrates smoothly, saving time and money. It works particularly well for small to mid-sized businesses needing strong BI features without the financial strain of pricier tools. However, if your work involves handling enormous datasets, advanced natural language queries without heavy DAX modeling, or requires cross-platform compatibility, Power BI's limitations might pose challenges.
Next, we’ll dive into how Tableau’s focus on visuals complements these capabilities.
Tableau: Visual Analysis and Flexibility
Tableau has earned a strong reputation for its ability to turn raw data into visually engaging dashboards. With a solid 4.4/5 rating on Gartner Peer Insights based on feedback from 3,980 users [15], it’s often celebrated for its drag-and-drop interface and essential features of modern business intelligence tools, including wide data connectivity,. Tableau thrives within an established ecosystem and boasts a supportive community of users who rely on its desktop tools for tackling complex visual tasks [14][6]. If your main goal is to create visually impactful dashboards for leadership presentations or external stakeholders, Tableau delivers on that front [6]. Let’s take a closer look at its strengths and limitations.
What Tableau Does Well
Tableau stands out when it comes to data storytelling. It excels in visual analytics, allowing users to build interactive dashboards that present insights in a clear and engaging way [6][13]. Its extensive feature set supports advanced visual storytelling, making it a go-to choice for presentations where clarity and polish are essential. The intuitive drag-and-drop interface simplifies the process of creating sophisticated visualizations with AI tools, even for users without coding experience [15].
Where Tableau Falls Short
Despite its strengths in visualization, Tableau lags in natural language BI capabilities. Unlike ThoughtSpot’s AI-driven search or Power BI’s Copilot integration, Tableau places less emphasis on natural language querying [14]. Xavier Pladevall, Co-founder & CEO of Index, highlights this limitation:
"Tableau excels at visualization depth but treats natural language querying as a secondary feature" [14]
The Tableau Agent is confined to worksheets and dashboards, limiting its ability to handle complex, multi-step calculations through natural language [4]. Moreover, the platform’s interface can be overwhelming for non-technical users who need quick answers without diving into visualization tools [14].
Who Should Use Tableau
Tableau is best suited for organizations that value detailed visual analysis and data storytelling over quick, conversational data exploration. It’s particularly effective for teams with experienced analysts tasked with creating polished dashboards for executives or client-facing reports. However, for businesses focused on empowering non-technical users to ask straightforward questions in plain English and receive immediate answers, Tableau’s approach may feel less intuitive. The platform shines when visual impact takes precedence over ease of access for casual users.
Feature Comparison: ThoughtSpot vs Power BI vs Tableau
Let’s dig into how these three BI platforms stack up against each other. By comparing their features, we can see clear distinctions in how they handle natural language queries (NLQ), pricing, and AI capabilities. While all aim to make data accessible to business users, their methods are quite different.
Power BI commands the largest market share at 20.06%, with Tableau following at 16.4% [1]. Power BI’s dominance owes much to its competitive pricing and seamless integration with Microsoft 365. Pricing for these tools varies: Power BI starts at $10–$14 per user per month, ThoughtSpot charges $25 per user per month or $0.10 per query, and Tableau ranges widely from $15 to $115 per user per month [5][16]. But pricing is just one piece of the puzzle - how they handle NLQ is a major differentiator.
ThoughtSpot stands out by centering its entire experience around search, with NLQ as a core feature accessible to all users via its Spotter AI Agent. In contrast, Power BI and Tableau treat NLQ as an optional feature. Power BI’s Copilot, for example, requires a Premium or Fabric license, while Tableau’s Pulse and Agent features operate separately from the main dashboard. Tejal Solanki, Senior BI Developer at SR Analytics, captures this distinction perfectly:
"Tableau is the iPhone of BI tools – beautiful, powerful, and probably overkill for 70% of users" [1].
Here’s a quick breakdown of how these platforms compare on key features: (similar to other conversational AI BI tools)
Feature | ThoughtSpot | Power BI | Tableau |
|---|---|---|---|
NLQ Approach | Search-driven (Core) | Q&A / Copilot (Add-on) | Pulse / Agent (Add-on) |
AI Capability | Advanced (Spotter AI Agent) | Basic to Moderate (Copilot) | Moderate (Tableau Pulse) |
Ease of Use | High for non-technical users | Moderate; requires DAX | High for analysts; steep for others |
Setup Time | Weeks (requires modeling) | Days to Weeks | Weeks |
Pricing Model | Per-user or Usage-based | Per-user & Capacity-based | Tiered (Creator/Explorer/Viewer) |
Data Handling | Live connection to cloud warehouses | Import mode or DirectQuery | Frequent use of data extracts |
Best For | Self-service at scale | Microsoft-centric teams | Visual storytelling/Data scientists |
This side-by-side comparison highlights the trade-offs you’ll need to weigh when selecting the right BI tool for your needs. Whether you prioritize ease of use, advanced AI, or seamless integration, each platform has its strengths and limitations.
How to Choose the Right BI Platform
Questions to Ask Before Choosing
Start by examining your current tech stack. For instance, organizations already using Microsoft 365, Azure, and Teams can see a 340% faster time-to-value with Power BI. This speed boost comes from existing integrations like data connections, security protocols, and user authentication being ready to go [1].
Next, think about your team's technical skills. If your organization has fewer than 1,000 employees, simpler tools like Power BI often lead to 40% higher user adoption rates compared to Tableau [1]. Teams with limited technical expertise might benefit from ThoughtSpot, which has a higher natural language query rating (4.6/5) compared to Power BI (4.1/5) and Tableau (4.0/5) [18].
Budget is another key factor. Here's a quick breakdown of costs:
Power BI: $10–$14 per user per month
ThoughtSpot: $25 per user per month or $0.10 per query
Tableau: $15 to $115 per user per month [16]
Finally, evaluate the semantic layer each platform offers. This layer determines how well the AI understands business terms like "churned user" or "high-value customer." Options include DAX models in Power BI, Data Index in Tableau, and governed Worksheets in ThoughtSpot [2][4]. Transparency is also key. ThoughtSpot shows a matching panel that maps tokens to data, Power BI Copilot explains which fields were used, but Tableau Agent is less clear in its reasoning [2][3].
Once you've assessed your current needs, think about how the platform will perform as your data and team grow.
Planning for Growth and Scale
As your organization scales, the ability to handle larger data volumes and a growing user base becomes critical. ThoughtSpot stands out here, querying live cloud data warehouses without requiring extracts. This makes it a strong choice for managing large datasets. Financial Analyst Purity Wairimu from Nestlé shared:
"ThoughtSpot's scalability is impressive; it can handle large data easily, and performance has been powerful and reliable" [17].
Power BI offers moderate scalability, balancing between Import mode and DirectQuery, while Tableau’s reliance on extracts can lead to bottlenecks as data grows.
It's worth noting that 73% of BI implementations fail to deliver expected ROI within the first year, often because companies choose tools based on hype rather than their actual needs [1]. To avoid this, run a pilot program with real users and data. Test the platform's compatibility with your data warehouse - whether it's Snowflake, BigQuery, or Azure Synapse - before making a final decision.
Conclusion
Selecting the best platform means aligning its features with what your team truly needs. Power BI stands out for its affordability and smooth integration with Microsoft tools, making it a great choice if you're already using Microsoft 365 or Azure. Tableau, on the other hand, shines in creating visually compelling narratives, catering to data analysts who need advanced visualizations. Then there's ThoughtSpot, which focuses on natural language BI platform, enabling non-technical users to uncover insights without building complex dashboards.
These differences aren't just theoretical - they can directly impact your business. For instance, small businesses with fewer than 1,000 employees often see Power BI adoption rates jump by 40% due to its simplicity [1]. On the other hand, teams struggling with technical barriers may find ThoughtSpot's self-service analytics a more practical solution.
"Tableau is the iPhone of BI tools – beautiful, powerful, and probably overkill for 70% of users" - Tejal Solanki, SR Analytics [1]
To make the right decision, focus on your team's actual needs rather than being swayed by flashy demos. A pilot program using real data and workflows can help you evaluate how well a platform integrates with your existing systems. Companies that choose the right BI tool often make decisions up to five times faster, turning data analysis into a competitive advantage instead of a bottleneck [1].
Ultimately, the goal is to empower your team with a tool they’ll use daily - one that simplifies access to insights and accelerates decision-making in today’s AI-driven landscape. It's not about having the most features; it's about finding a platform that fits seamlessly into your team’s workflow and helps them make better decisions faster.
FAQs
What makes ThoughtSpot a top choice for natural language queries in business intelligence?
ThoughtSpot shines with its AI-driven natural language query features, enabling users to simply type questions in plain English and instantly receive clear, visual insights. This eliminates the need for technical skills or knowledge of SQL, making data exploration quicker and easier for everyone in a team.
The platform also incorporates AI-powered tools like automated insights and anomaly detection, which help users identify trends and patterns without hassle. By connecting to live data sources, ThoughtSpot delivers real-time visualizations, ensuring decision-makers have access to the latest information. Its user-friendly design and ability to scale make it a powerful solution for encouraging a data-focused approach and helping teams make smarter, faster choices.
How does Power BI work with Microsoft tools, and what challenges might arise?
Power BI works effortlessly with Microsoft tools like Excel, Teams, and SharePoint, allowing users to import, analyze, and share data within platforms they already know. Its connection to Azure cloud services adds another layer of capability, offering scalable data storage, advanced analytics, and AI-driven insights to enhance enterprise workflows.
That said, Power BI's tight integration with the Microsoft ecosystem can pose challenges for businesses that rely on non-Microsoft tools. While it does support a wide range of third-party connectors, some integrations may require additional setup or technical expertise. For companies in heavily regulated industries, implementing Power BI can also be tricky due to strict governance and security standards. Microsoft is actively addressing these challenges, but they remain considerations for many organizations.
Why might Tableau be challenging for non-technical users looking for quick insights?
Tableau can be tricky for non-technical users who need fast insights. It often demands a solid grasp of data preparation and visualization methods, which can slow things down. Building and understanding dashboards in Tableau tends to take more time and technical know-how compared to platforms that use AI-powered natural language queries.
For those who value quick and straightforward data exploration, Tableau’s focus on traditional visualizations might seem less user-friendly - especially when stacked up against tools designed for instant, search-based analysis.
Related Blog Posts