Business Intelligence
Querio vs Sigma (2026)
Governed, inspectable BI beats spreadsheet comfort when consistent, auditable KPIs matter.

If you want governed self-serve analytics on top of Snowflake, BigQuery, Redshift, or Postgres, I’d pick Querio. If your team works best in a spreadsheet-style BI tool, I’d pick Sigma.
Here’s the short version:
- Querio is the better fit for teams that care most about metric control, inspectable SQL/Python, and live warehouse access
- Sigma is the better fit for teams that want grid-based analysis, workbook editing, and a setup that feels close to Excel
- For 100–500-person U.S. B2B SaaS teams, the choice usually comes down to:
- AI that shows its work
- one shared metric definition for KPIs like MRR, ARR, churn, and NRR
- cost as usage and seat count grow
- whether analysts and business users can work from the same system
A few points stand out fast:
- Querio has a free plan, and Core is $2,499/month, both with unlimited users
- Sigma can get pricey as seat count and warehouse query usage grow
- Querio keeps logic in a shared context layer
- Sigma often keeps logic closer to the workbook level
- Querio is stronger for trusted KPI reporting
- Sigma is stronger for spreadsheet-style ad hoc work
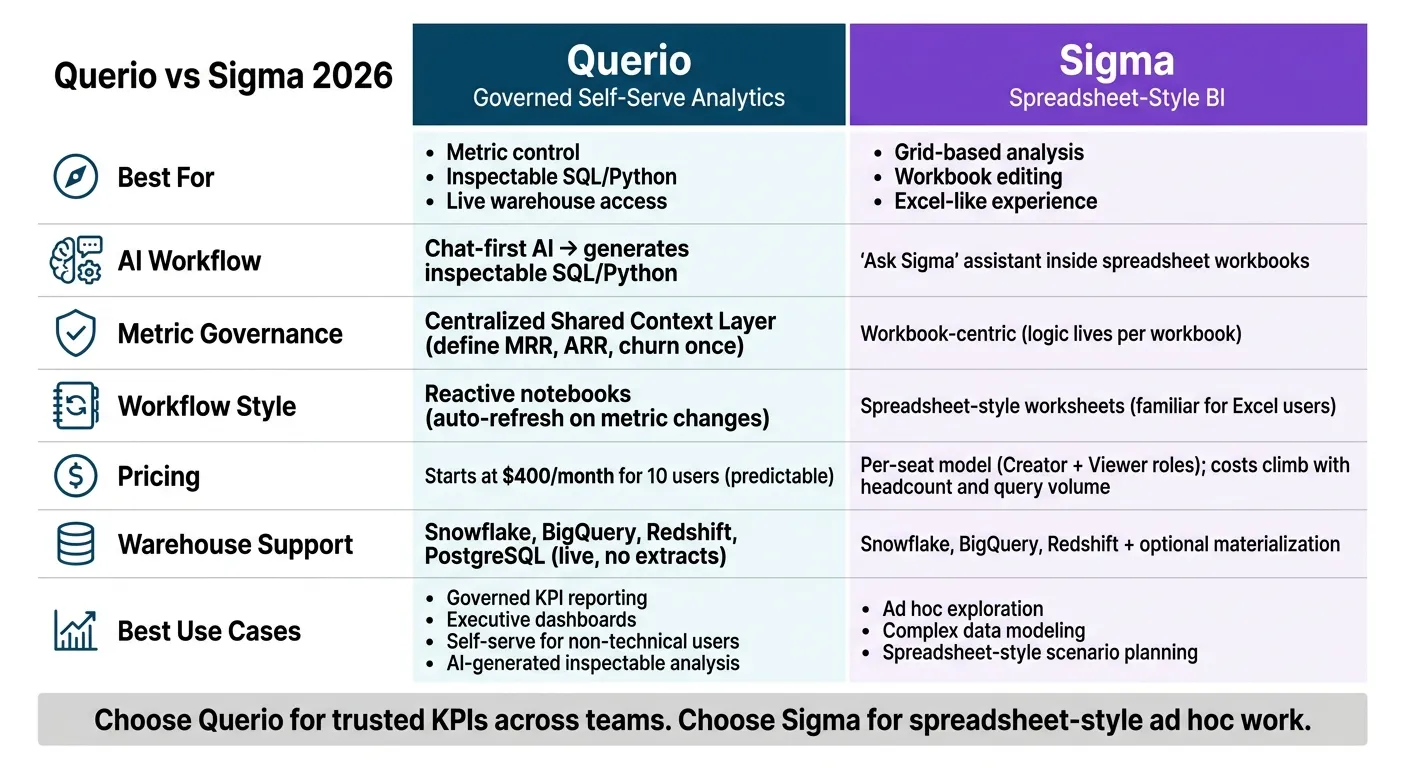
Quick Comparison
| Criteria | Querio | Sigma |
|---|---|---|
| Best for | Governed self-serve analytics | Spreadsheet-style BI |
| AI workflow | Chat-first with SQL/Python output | Ask Sigma inside workbooks |
| Code visibility | Full SQL/Python inspection and editing | More visual, less code-first |
| Metric governance | Shared context layer | More workbook-based |
| Main workflow | Reactive notebooks | Worksheets and grids |
| Non-technical self-serve | Strong with governed setup | Good for spreadsheet-comfortable users |
| Cost shape | Free plan; Core $2,499/mo, unlimited users | Can climb with seats and query load |
If I had to reduce this Business Intelligence tools comparison to one line, it’s this: Querio is the safer pick for trusted numbers across teams, while Sigma is the better pick for users who want BI to feel like a spreadsheet.
What matters most in AI-driven BI in 2026
In 2026, AI-driven BI comes down to one test: can business users get reliable answers without creating more work for analysts? That's the bar now.
The main goal is self-serve analytics that people can use with confidence, without sending analyst ticket volume through the roof.
Natural-language querying, SQL depth, and trust
A tool replying to a plain-English prompt isn't enough. That's the easy part.
What matters is what happens after the answer shows up. Can users see the SQL behind it? Can they edit that SQL if something looks off? Can they trace the result back to a specific table or dbt model?
If the answer is no, people will double-check every result anyway. And once that happens, the whole promise of AI BI starts to fall apart. Trust comes from answers that are tied to SQL people can inspect, change, and trace back to the source.
Governed metrics and warehouse-native setup
A semantic layer keeps shared metrics aligned across teams. For SaaS teams using dbt with Snowflake, BigQuery, Redshift, or Postgres, that matters a lot because it stops metric drift before it turns into a mess.
Set MRR, ARR, churn, NRR, activation, and pipeline metrics once. Then use those same definitions everywhere.
Add a live warehouse connection on top of that - no CSV exports, no stale extracts - and the numbers stay both consistent and current. Warehouse-native pushdown can return large queries fast on Snowflake, BigQuery, Redshift, or Postgres [1].
Fit for analysts and business teams
This tradeoff gets clear the moment one platform has to support both analysts and non-technical teams from the same warehouse.
Analysts need room to go deep. Business users need governed access that doesn't let things drift off course.
When a platform works well for analysts but confuses business users, support tickets pile up. When it's easy for business users but blocks analysts from doing deeper work, the data team often ends up keeping a separate setup for actual investigation.
The best setups do both in one governed workflow: deep analysis for analysts and self-serve access for business users. Those are also the same criteria used to compare Querio and Sigma in the side-by-side section below.
Querio vs Sigma side by side
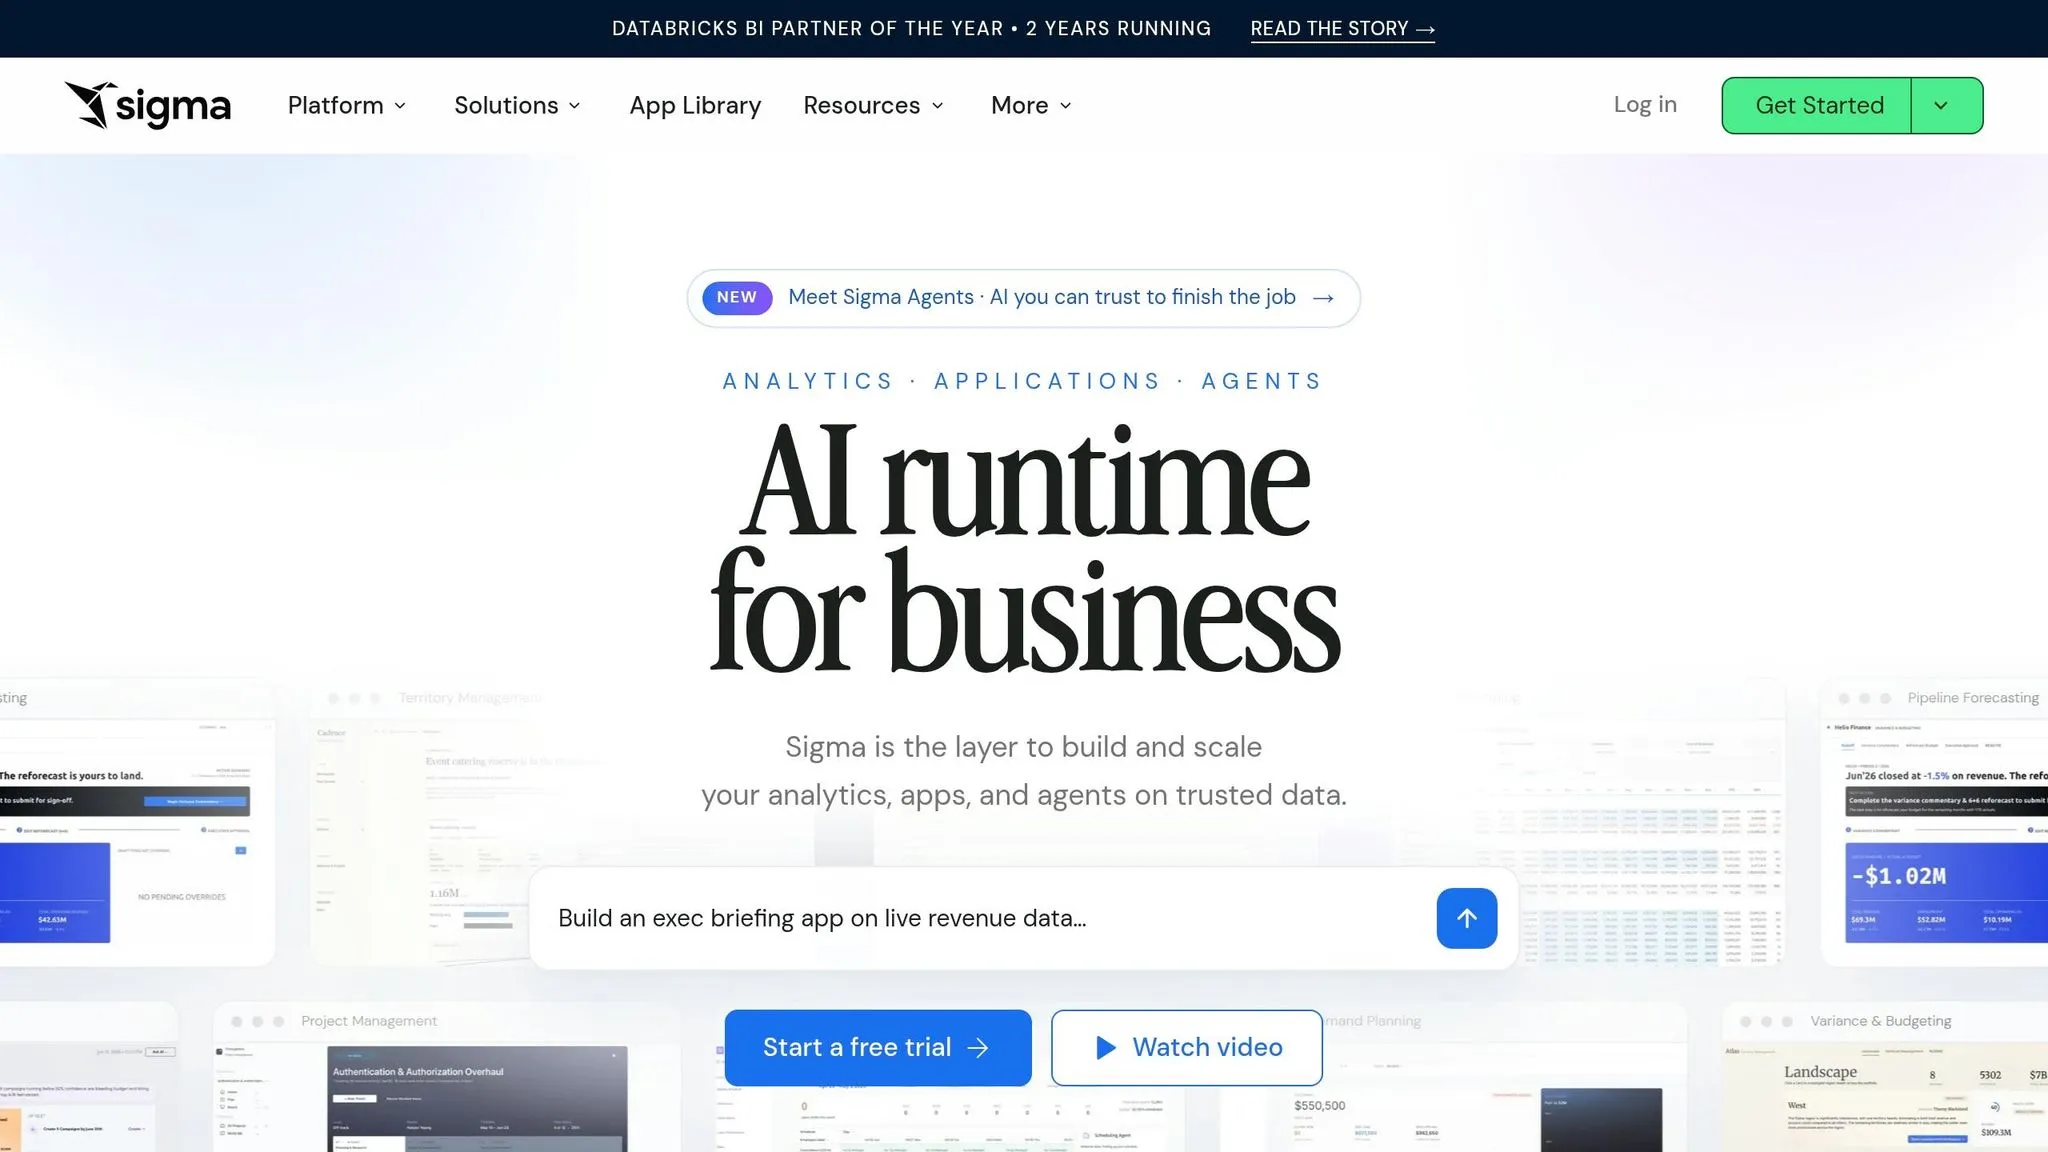
The biggest differences come down to code inspection, metric governance, and how each product fits the way analysts and business teams actually work day to day.
| Feature | Querio | Sigma |
|---|---|---|
| Architecture | Warehouse-native, live warehouse queries | Warehouse-native, live + optional materialization |
| AI Experience | Chat-first AI that generates SQL/Python | AI-assisted; "Ask Sigma" within workbooks |
| SQL/Python Transparency | Fully inspectable and editable | Visual-first, with lineage views |
| Semantic Layer | Centralized Shared Context Layer | Lighter, workbook-centric modeling |
| Workflow | Reactive notebooks | Spreadsheet-style worksheets |
| Collaboration | Shared notebooks with governed metrics | Real-time collaborative workbook editing |
AI analysis: natural language, follow-ups, and inspectable code
Querio is built around a chat-first, code-transparent loop. Its AI agent writes SQL or Python that you can see, edit, and run against live warehouse data in Snowflake, BigQuery, Redshift, or Postgres. When you ask follow-up questions, the work continues in the same notebook. That means the logic stays out in the open instead of disappearing behind a black box.
Sigma's AI assistant, "Ask Sigma", lives inside a spreadsheet-style workbook. It can handle fast Q&A and generate SQL for certain tasks, but the experience stays centered on the grid, not on code. If your team is comfortable in Excel, that will feel familiar fast. If your analysts want to check each step of an AI-generated answer, Querio gives them more direct visibility.
Metrics consistency, governance, and collaboration
Querio uses a Shared Context Layer so data teams can define metrics like MRR, churn, NRR, activation, and pipeline once. Those definitions then carry across notebooks, dashboards, and AI-generated answers automatically. That cuts down on the "same metric, different number" problem that slows teams down.
Sigma handles governance in a more workbook-centered way. Metric logic lives inside each workbook, so staying consistent across dashboards depends more on team habits and review processes. For teams doing cross-functional reporting across finance, product, and GTM, that can turn into repeated maintenance work.
Workflow: reactive notebooks vs spreadsheet-style analysis
Querio uses reactive notebooks, so if you change a metric definition or update a filter, connected results refresh on their own. For small data teams juggling requests from a lot of stakeholders, that can save time and reduce cleanup work.
Sigma leans into spreadsheet-style worksheets. That makes ad hoc analysis easier for finance and ops users who don't want to write SQL. Sigma also offers optional materialization with Snowflake Dynamic Tables, which can help performance on more complex workloads, but it also adds operational overhead and compute costs [1].
At that point, the choice usually comes down to this: do you need faster ad hoc analysis in a familiar spreadsheet setup, or tighter KPI control with visible code and shared metric definitions?
Best fit by use case and team
Those workflow differences usually shape the buying call. Sigma works well for analyst-led work that feels close to a spreadsheet. Querio makes more sense for governed, warehouse-native self-serve. So the real question is simple: how does your team already work with data day to day?
| Use Case | Stronger Fit | Tradeoff to Know |
|---|---|---|
| Ad hoc exploration | Sigma | Fast for analysts and Excel power users, but workbook-specific logic can lead to metric drift across teams [1] |
| Governed KPI reporting | Querio | Shared context layer keeps MRR, ARR, and churn definitions consistent; less spreadsheet-style editing |
| Executive dashboards | Querio | Inspectable SQL/Python and governed metrics give leadership a single, trustworthy source of truth |
| Complex data modeling | Sigma | Familiar for spreadsheet users; complex joins may still require manual SQL or YAML modeling [1] |
| Self-serve for non-technical users | Querio | Natural-language querying lowers the barrier, but a data team still has to define the context layer |
The use cases below make the split clearer.
Ad hoc analysis, KPI reporting, and executive dashboards
For exploratory analysis, Sigma’s spreadsheet grid gives analysts a familiar place to test ideas and dig into data. It can also handle large warehouse queries fast by leaning on warehouse caches [1]. That said, workbook-specific datasets can create a quiet problem: two teams may end up defining the same KPI in two different ways.
That becomes a bigger issue in recurring KPI reviews and executive dashboards. When leadership asks for MRR, NRR, or activation, they usually don’t want three versions of the same number. Querio handles this with a shared context layer, so those metric definitions are set once and then reused across notebooks, dashboards, and AI-generated answers.
Who should choose Querio
Querio is the better fit if your data team supports a growing group of stakeholders across RevOps, finance, and product and doesn’t want to rebuild metric definitions every time a new request comes in. Its live connections to Snowflake, BigQuery, Redshift, and Postgres, along with inspectable SQL and Python, let business users self-serve without depending on hidden logic.
Who may prefer Sigma
Sigma is a strong pick for analyst-heavy teams that want a BI tool with a spreadsheet-style interface for formulas and manual modeling. If your team spends a lot of time on scenario planning, financial projections, or ad hoc joins that change shape often, the grid workflow can feel fast and natural. Sigma also supports Input Tables for warehouse write-back [1].
The main thing to watch is cost. Heavy query use can make spend harder to predict [1].
In many cases, the final choice comes down to budget and setup work. A tool can match your workflow on paper, but cost and implementation effort decide whether that fit holds up in practice.
Pricing, setup, and final take
Total cost for a 100–500-person SaaS team
Once you know the workflow fits, the last buying filters are usually cost and rollout. And licensing is only one piece of the bill. Warehouse compute, setup time, and maintenance can change the total cost quite a bit based on how each platform is used.
Querio has a free plan, and Core is $2,499 a month (or $25,000 a year billed annually), with unlimited users on every plan. Setup is mostly about defining the semantic context layer once: joins, metrics, and business logic.
This is where the pricing model starts to matter more. As warehouse usage grows and dashboard volume climbs, Sigma’s per-seat model can get expensive because pricing scales with headcount. Sigma uses Creator and Viewer roles, so adding more people often means adding more cost. On top of that, if workbooks run frequent live queries or Snowflake Dynamic Tables are turned on, warehouse spend can climb even when dashboards are just sitting there idle [1]. In workbook-heavy setups, maintenance can also grow as adoption spreads.
Final recommendation by decision criteria
Choose Querio if you want governed, inspectable self-serve on live warehouse data. Choose Sigma if your team leans toward spreadsheet-style analysis.
Querio connects directly to Snowflake, BigQuery, Amazon Redshift, and PostgreSQL. It also gives teams governed metric definitions, inspectable SQL and Python, and self-serve access for non-technical stakeholders.
| Decision Criteria | Stronger Fit |
|---|---|
| Governed KPI definitions across teams | Querio |
| Predictable cost as usage grows | Querio |
| Spreadsheet-style ad hoc analysis | Sigma |
| AI-generated, inspectable analysis | Querio |
| Self-serve for non-technical users | Querio |
Use metric governance, cost predictability, and workflow fit as the final decision filter.
FAQs
How long does setup usually take?
Setup is built to be fast. A full implementation usually takes anywhere from a few minutes to a few days, and many installations are done in as little as 15 minutes.
Because Querio connects straight to your existing data warehouse, you skip the slower setup that often comes with older analytics stacks.
Can we use dbt metrics and models directly?
Yes. Querio is built to work well with dbt, so your team can use existing dbt metrics and models directly instead of rebuilding them in the BI layer.
That same logic flows into Querio’s shared context layer. The result is more consistent metrics, joins, and business terms across AI-generated answers, dashboards, and notebooks.
What changes as more teams adopt it?
As more teams start using Querio, it keeps a reliable single source of truth with its shared context layer. That means metric definitions stay consistent across the company instead of drifting from team to team. No per-seat pricing, unlimited users on every plan, and spending caps on AI credits also make costs easier to predict as usage grows.
Role-based access controls and SSO give data teams a way to open up self-service access to non-technical users without losing control. The analytical logic stays governed, secure, and fully inspectable inside a collaborative, reactive notebook environment.