Business Intelligence
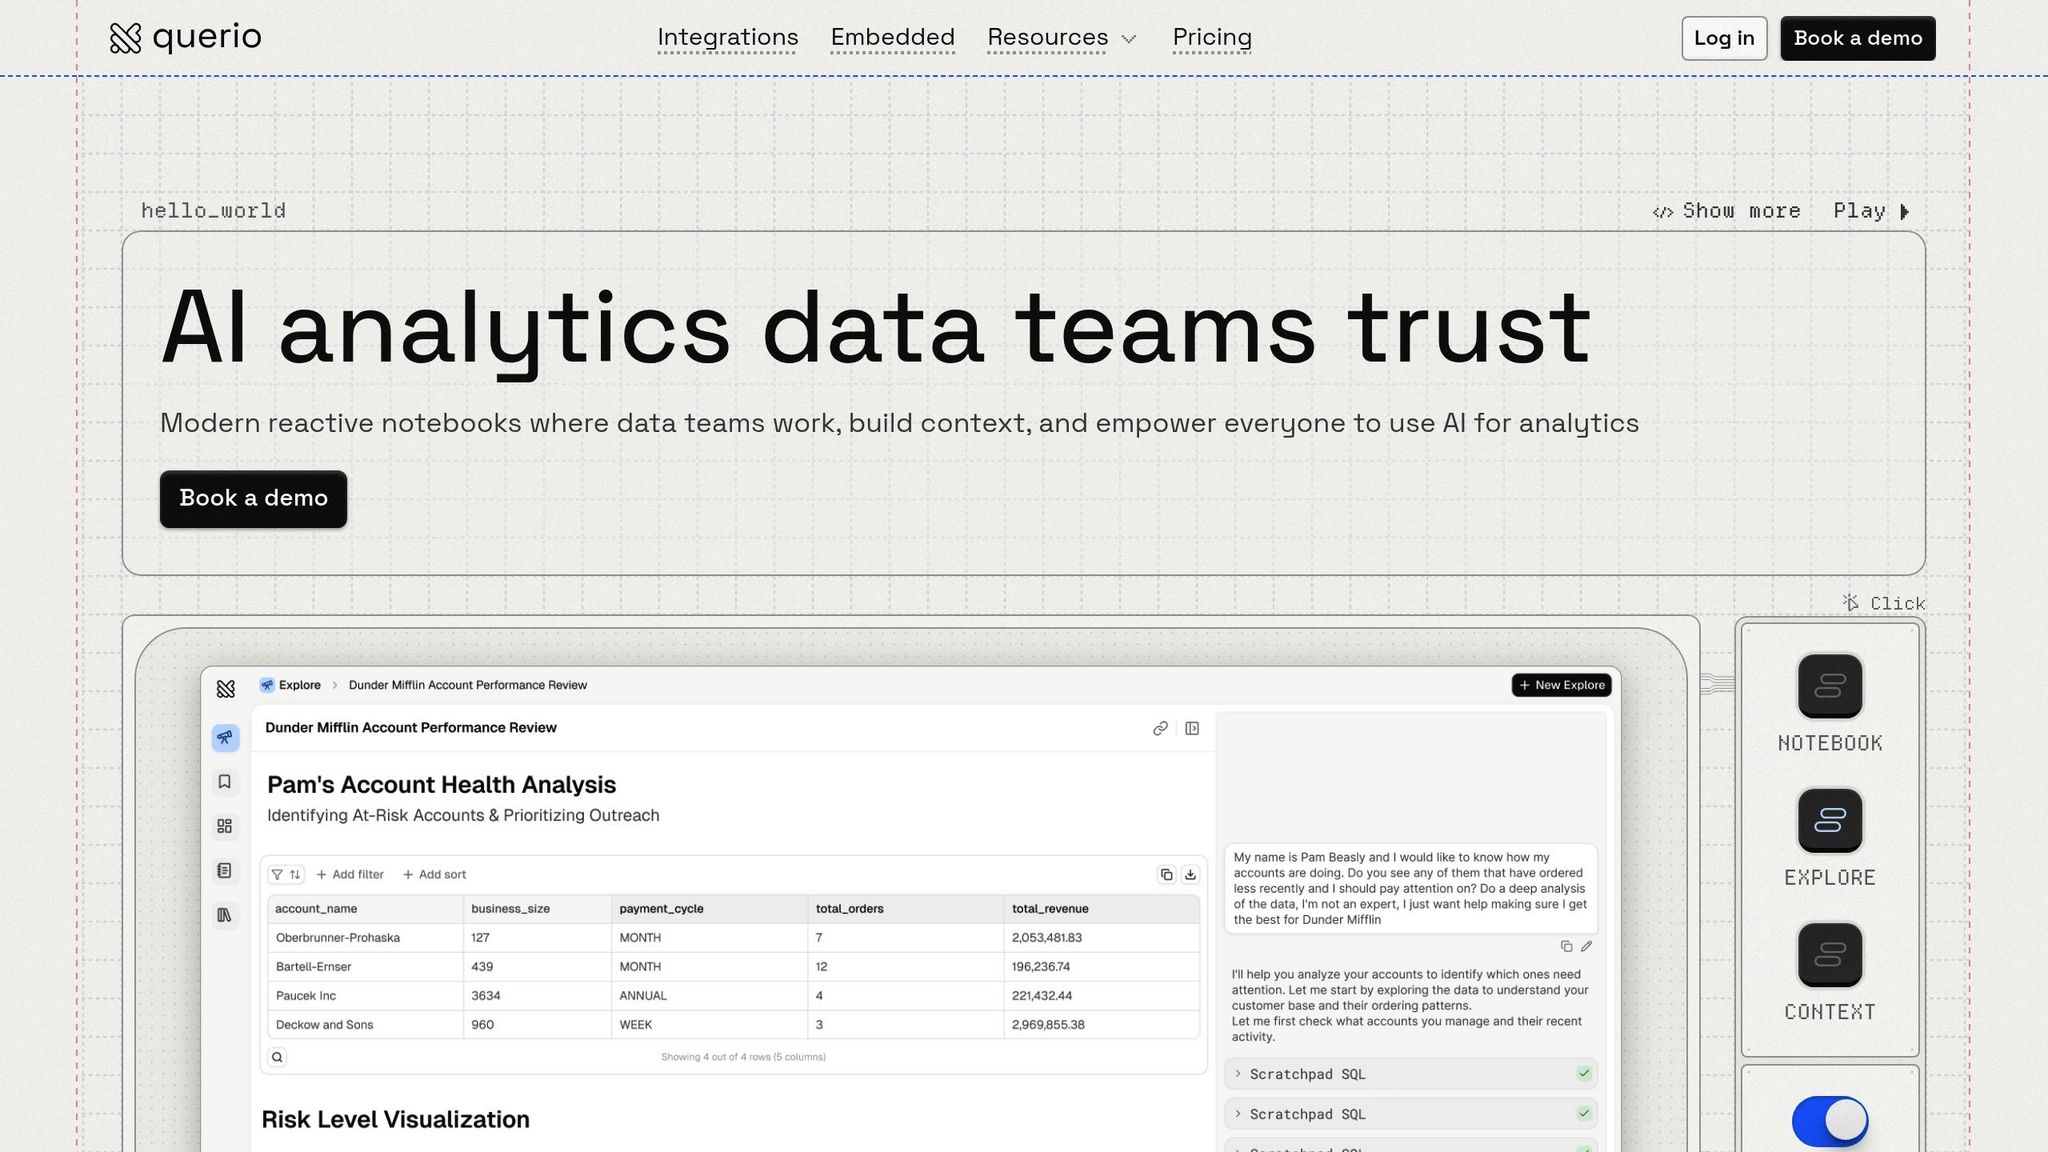
AI Analytics Platforms That Scale with Your Business
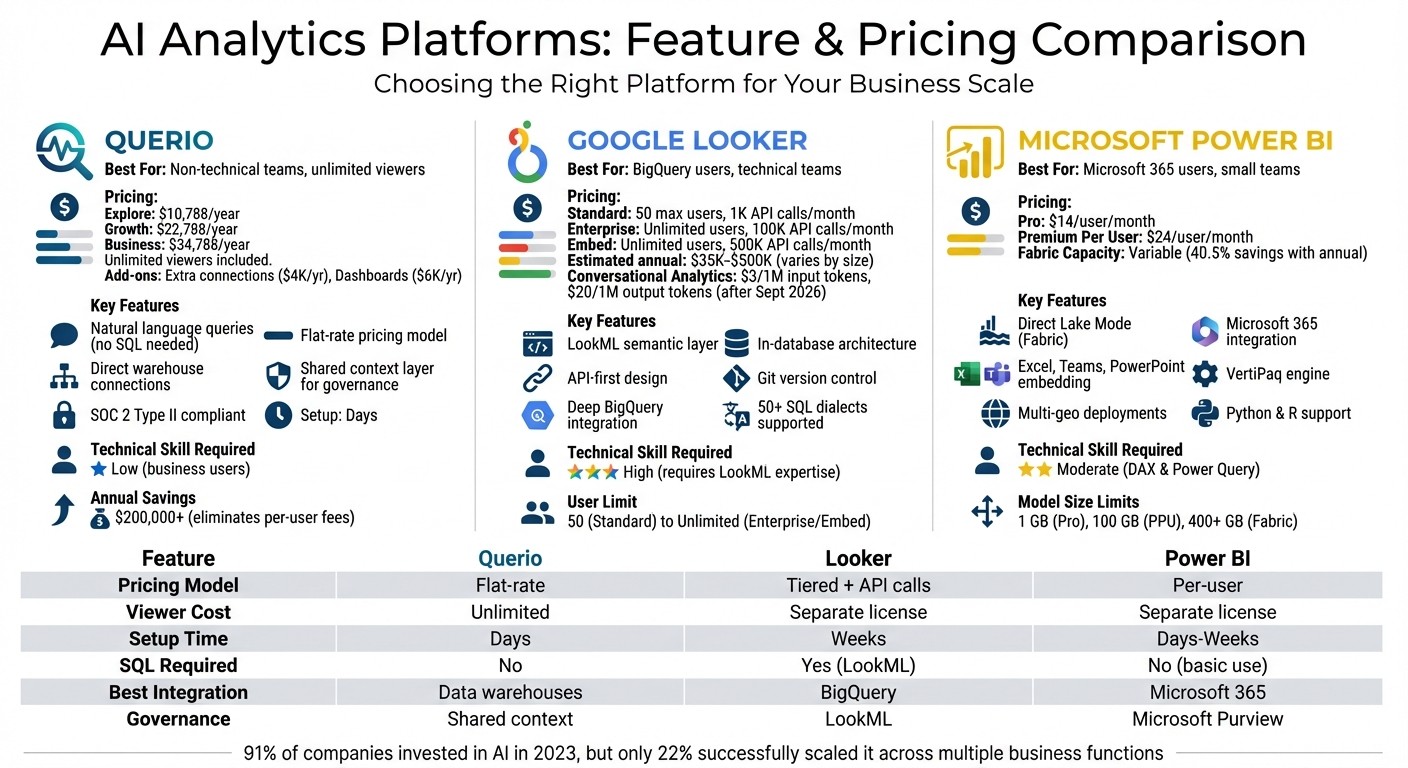
Compare Querio, Google Looker, and Power BI on scalability, governance, integrations, and pricing to choose the right AI analytics platform for your team.
Choosing the right AI analytics platform can help your business manage growing data, ensure performance, and control costs. This article compares three popular platforms - Querio, Google Looker, and Microsoft Power BI - focusing on scalability, governance, integration, and pricing. Here’s a quick breakdown:
Querio: User-friendly, flat-rate pricing for unlimited viewers, is one of the warehouse-native data analysis tools that connects directly to major data warehouses, and supports SQL/Python transparency. This approach enables startup-friendly governance without sacrificing agility.
Google Looker: Strong integration with BigQuery, API-first design, and centralized governance using LookML, but requires technical expertise.
Microsoft Power BI: Affordable for small teams, integrates with Microsoft tools, and supports large-scale deployments with Fabric Capacity.
Each platform suits different needs based on team size, technical skill, and modern analytics infrastructure.
AI Analytics Platforms Comparison: Querio vs Google Looker vs Microsoft Power BI
1. Querio
Scalability
Querio connects directly to major data warehouses like Snowflake, BigQuery, Redshift, ClickHouse, PostgreSQL, MySQL, and MariaDB. This setup allows your queries to run live without needing to rework your architecture or maintain separate analytics databases as transaction volumes grow.
The platform uses AI agents to generate real SQL and Python code, which you can inspect for logic verification and query optimization. This level of transparency helps you identify bottlenecks and fine-tune performance as usage increases.
By cutting out legacy tools, organizations save over $200,000 annually. These savings come from eliminating per-user licensing fees and reducing the technical complexity of managing multiple analytics systems as your team expands [1].
Governance
Querio ensures consistency with its shared context layer. Data teams define joins, metrics, and business terms once, and these definitions apply across all analyses. For example, when your sales team asks for "monthly recurring revenue" in plain English, they’ll get the same calculation that your finance team uses.
The platform also supports versioned logic, so changes to metric definitions won’t disrupt existing reports. Security is covered with role-based access controls, standard SSO integrations, and SOC 2 Type II compliance. For organizations with strict privacy needs, Querio offers a self-hosting option via a Code Execution Environment, giving you full control over data processing [2].
Integration
Querio integrates effortlessly with your existing systems. It connects through encrypted, read-only credentials, avoiding unnecessary data movement. The platform also includes an API for managing AI agent runs and supports embedding analytics into customer-facing applications [2]. This means the same governed logic that powers internal dashboards can also enhance your product.
Because Querio connects to your current infrastructure, setup takes just a few days - no need for lengthy data migrations. Plus, the built-in notebook environment lets analysts work with SQL and Python while staying aligned with your organization’s defined metrics.
Pricing
Querio offers flat-rate pricing with unlimited viewer access:
Explore: $10,788/year
Growth: $22,788/year
Business: $34,788/year
(Annual billing; add 10% for monthly billing.)
Each tier supports unlimited users, eliminating the rising costs tied to per-seat licensing.
Additional features scale with your needs:
Extra database connections: $4,000/year
Dashboards: $6,000/year
Data pipelines (up to three): $10,000/year
Querio also offers a Startup Program for companies with less than $3M in funding, while Enterprise plans include custom schemas, self-hosting, and 24/7 SRE support at custom pricing. For self-hosted deployments, there’s a 50% surcharge with a minimum annual commitment of $60,000.
This pricing structure ensures that Querio remains cost-efficient as your business grows.
2. Google Looker
Scalability
Google Looker uses an in-database architecture, which means your data stays in its original location instead of being copied into extracts or cubes. This setup takes advantage of the processing power of modern cloud data warehouses, like BigQuery, allowing Looker to handle massive datasets without slowing down [4].
The platform's LookML semantic layer ensures consistency by defining business logic centrally with a SQL-based modeling language. This means whether you have 50 users or 5,000, everyone in your organization is working with the same definitions [5]. Plus, because LookML is version-controlled via Git, updates to metrics or definitions can be made seamlessly without disrupting existing reports.
Looker’s API-first design also supports embedded analytics tools that can scale to millions of users. For instance, the Embed Edition can handle up to 500,000 query-based API calls per month, making it a great option for customer-facing applications [3].
Beyond managing large datasets, Looker emphasizes structured governance to maintain data accuracy as your organization grows.
Governance
Looker ensures a single source of truth through its LookML modeling layer. This means joins, calculations, and business terms are defined in one place, ensuring consistent reporting and dashboards as your organization expands.
The platform also prioritizes secure data access, offering features like single sign-on through Google Cloud IAM and private networking. For organizations with strict compliance needs, the Enterprise Edition includes advanced security measures like Customer-Managed Encryption Keys (CMEK) and VPC Service Controls [3] [11].
Integration
Looker integrates seamlessly with your existing tools through its Action Hub. It can send data directly to platforms like Google Drive, Google Sheets, Cloud Storage, and Google Ads. Additionally, integration with Vertex AI allows you to apply machine learning models directly to BigQuery data without the need for complex pipelines [3] [7].
The Connected Sheets feature makes it easy for non-technical users to access governed data from Looker's semantic layer directly in Google Sheets, ensuring data exploration remains aligned with governance standards. For developers, the Conversational Analytics API (introduced in 2025) enables custom BI agent experiences using natural language queries [6].
Pricing
Looker’s pricing model includes platform costs and user licensing, divided into three editions:
Edition | Max Users | Monthly Query API Calls | Key Features |
|---|---|---|---|
Standard | 50 | 1,000 | Includes 10 Standard + 2 Developer users |
Enterprise | Unlimited | 100,000 | VPC-SC, CMEK, enhanced security |
Embed | Unlimited | 500,000 | External analytics with signed embedding |
Licenses are available in three types: Developer (full access including LookML and administration), Standard (dashboard creation and exploration), and Viewer (read-only access). This structure allows organizations to allocate Developer licenses to core data teams while providing cost-effective Viewer licenses for broader access [9] [11].
Estimated annual costs vary based on company size: $35,000–$60,000 for small businesses, $60,000–$150,000 for mid-sized companies, and $150,000–$500,000 for enterprise-level deployments. Additionally, through September 30, 2026, all users get unlimited access to Conversational Analytics. After that, token-based pricing will apply at $3.00 per 1 million input tokens and $20.00 per 1 million output tokens [8] [10].
3. Microsoft Power BI
Scalability
Power BI offers impressive scalability with its Direct Lake Mode in Microsoft Fabric, allowing users to analyze terabytes of data from OneLake without duplicating it. By leveraging the powerful VertiPaq engine, it delivers in-memory performance, even when handling massive datasets [13].
The platform employs a tiered capacity planning approach:
Tier 1: Dedicated capacity for mission-critical reports.
Tier 2: Medium capacity for business operations.
Tier 3: Shared capacities for ad-hoc analysis.
This setup helps optimize resource allocation and manage costs effectively [12].
Another key feature is automatic aggregations, which monitor DirectQuery models and cache frequently accessed data. This reduces backend strain and ensures faster report performance. However, there are some limitations: shared semantic models are capped at 1 GB, and DirectQuery struggles with datasets exceeding 1 million rows [15][14].
Governance
Power BI ensures robust governance through a centralized admin portal, which allows management of licenses, workspace settings, and dataset certifications [21]. For organizations with strict compliance needs, it supports multi-geo deployments and Fabric Realms, helping maintain data residency in line with regional regulations [12].
Authentication is handled via Microsoft Entra ID (formerly Azure AD), offering features like single sign-on and OAuth 2.0 [18]. For advanced governance, Premium and Fabric capacities include tools like deployment pipelines, which visually track changes as content moves from development to testing and production environments [19].
Integration
Power BI seamlessly integrates with the Microsoft 365 ecosystem, enabling users to:
Analyze data directly in Excel.
Embed live reports into Teams.
It also connects to a wide array of data sources, including cloud databases like Azure SQL and Snowflake, as well as SaaS platforms like Salesforce, Google Analytics, and QuickBooks [19].
For developers, Power BI offers Git integration (Azure Repos and GitHub), XMLA endpoints for connecting with multiple tools, and support for Python and R scripts. Grupo Casas Bahia's BI and Analytics Manager highlighted the platform's ease of use:
"we were very happy about how easy the tool was to adopt. With little time to study, we were able to quickly adopt the platform" [19].
These integrations, along with developer-friendly features, make Power BI a versatile tool for businesses of all sizes.
Pricing
Power BI's pricing structure caters to diverse needs:
Pro: $14/user/month (annual billing), suitable for small teams requiring basic sharing.
Premium Per User (PPU): $24/user/month, ideal for advanced AI features and larger models (up to 100 GB).
Fabric Capacity: Variable pricing for enterprise-scale requirements, with annual reservations offering up to 40.5% savings [20].
License Type | Price | Model Size Limit | Daily Refreshes | Best For |
|---|---|---|---|---|
Power BI Pro | $14/user/month | 1 GB | 8 | Small teams, basic sharing |
Premium Per User | $24/user/month | 100 GB | 48 | Advanced AI, larger models |
Fabric Capacity | Variable | 25-400+ GB | 48 | Enterprise-wide distribution |
Organizations can begin with Pro licenses for smaller teams and transition to PPU for enhanced features. When individual licenses for view-only users become cost-prohibitive, switching to Fabric Capacity (starting at F64) offers a more economical solution for enterprise-wide scaling [20][19].
Strengths and Weaknesses
Each platform brings distinct advantages depending on your organization's technical expertise, infrastructure, and growth plans. Querio stands out for making analytics accessible to non-technical teams. It offers a flat annual fee with unlimited viewers and uses natural language querying to eliminate entry barriers. Its shared context layer ensures consistent and governed analytics without requiring specialized modeling languages.
Google Looker excels with its deep integration with BigQuery and compatibility with over 50 SQL dialects. However, its reliance on LookML requires specialized training, which can be a hurdle for some teams. The Standard edition caps usage at 50 users, and its tiered pricing - based on edition and user count - can make cost planning tricky as your team expands.
Microsoft Power BI offers an affordable starting point at $14 per user per month for Pro licenses, making it a great choice for small teams exploring analytics. Its seamless integration with Microsoft 365 tools like Excel, Teams, and PowerPoint reduces friction for organizations already using Microsoft's ecosystem. However, as your data grows, the 1 GB cap on shared semantic models may require upgrades to Premium Per User ($24 per user per month) or Fabric Capacity to handle larger volumes.
These platforms also differ in their technical skill requirements. Querio is designed for business users with no SQL knowledge, ensuring immediate usability. Power BI demands moderate expertise in DAX and Power Query for more advanced analyses, while Looker requires significant technical proficiency due to its reliance on LookML. It's worth noting that while 91% of companies invested in AI in 2023, only 22% successfully scaled it across multiple business functions [22].
When it comes to scalability and governance, each platform implements robust controls in unique ways. Querio uses a shared context layer for metrics and glossary definitions, Looker employs LookML as its semantic layer, and Power BI relies on Microsoft Purview and Fabric for enterprise-wide governance. The best choice depends on your team's skills and growth objectives, with Querio's no-SQL approach being especially appealing for organizations aiming to scale without adding technical complexity.
Conclusion
For teams looking to expand their analytics capabilities without dealing with added complexity or unpredictable costs, Querio offers a practical option. With a flat annual fee starting at $10,788 and support for unlimited viewers, it simplifies budgeting. Its natural language interface also ensures quick and efficient results.
On the other hand, Microsoft Power BI caters to teams already embedded in the Microsoft ecosystem. Its per-user licensing model works well for smaller groups, but as teams grow, managing licenses can become more complicated.
Meanwhile, Google Looker appeals to organizations with highly skilled technical teams and significant investments in BigQuery. However, its steep learning curve and variable pricing structure may pose hurdles for some users.
Each platform serves distinct needs, making the choice dependent on your team’s size, technical expertise, and existing infrastructure.
FAQs
How does Querio's flat-rate pricing support business growth?
Querio offers a flat-rate pricing model that simplifies budgeting for growing businesses. By eliminating per-user fees, it ensures predictable costs, no matter how large your team gets. This means everyone in your organization can access data insights without worrying about extra charges.
With cost barriers out of the way, Querio enables businesses to prioritize data-driven decision-making at scale. Whether you're a small team or experiencing rapid growth, this pricing approach supports your expansion seamlessly, free from hidden fees or unexpected costs.
What skills do I need to use Google Looker effectively?
To make the most of Google Looker, you'll need a good mix of technical skills and business intelligence expertise. On the technical side, it's important to understand Looker’s semantic modeling layer, which helps maintain consistent and reliable metrics, along with being proficient in SQL for building custom data models and handling more complex analyses.
Although Looker is designed to be user-friendly, fully utilizing its capabilities - such as advanced customization, data governance, and seamless integration with cloud platforms - requires a strong foundation in data modeling and data management. Pairing these technical skills with a clear understanding of business goals and strategy will ensure you can unlock the platform's full potential.
How does Microsoft Power BI work with other Microsoft tools?
Microsoft Power BI works effortlessly with other Microsoft tools like Microsoft Dynamics 365, Azure, and Excel, making data analysis and reporting more efficient. This tight integration allows businesses to connect their data sources, create visualizations, and share insights across the Microsoft ecosystem with ease.
With these connections, users can pull data directly from reliable sources, automate reports, and maintain consistency in their decision-making process. For organizations already using Microsoft products, Power BI enhances teamwork and boosts the functionality of tools they’re already familiar with.
Related Blog Posts