Business Intelligence
self service analytics tools 2025 review
Compare six top self-service analytics platforms in 2025 — AI features, data connectivity, governance, pricing, and scalability.
Looking for the best analytics tools in 2025? Here’s what you need to know: Self-service analytics platforms empower teams to work with data independently, without IT bottlenecks. From tracking customer churn to evaluating campaign performance, these tools enable faster, data-driven decisions.
This review covers six leading platforms in 2025: Querio, Microsoft Power BI, Tableau, Looker, Qlik Sense, and Zoho Analytics. Each tool offers features like natural language queries, AI insights, and integration with warehouse-native data analysis tools like Snowflake, BigQuery, and Postgres.
Key Takeaways:
Querio: Focuses on AI-driven natural language queries and Python integration. Best for real-time insights and unlimited viewer users.
Microsoft Power BI: Integrates seamlessly with Azure and Microsoft apps, offering flexible reporting and strong governance.
Tableau: Known for its visual storytelling and drag-and-drop dashboards, ideal for exploring complex datasets.
Looker: A cloud-native tool that excels in governance and live queries through Google Cloud.
Qlik Sense: Features an in-memory analytics engine for flexible exploration and AI-powered insights.
Zoho Analytics: A budget-friendly option with conversational AI and easy data blending for small to mid-sized businesses.
Quick Comparison
Tool | Best For | Key Features | Pricing |
|---|---|---|---|
Querio | AI-driven queries, real-time insights | Natural language queries, Python notebooks, unlimited viewers | Scales with features, no query fees |
Power BI | Enterprise integration | Azure compatibility, advanced governance | Complex pricing, per user |
Tableau | Visual storytelling | Drag-and-drop visuals, curated data sources | Starts at $15/user/month |
Looker | Cloud-native governance | Live queries, Google Cloud integration | Tied to warehouse performance |
Qlik Sense | Flexible exploration | In-memory engine, AI insights | Capacity-based licensing |
Zoho Analytics | Budget-friendly analytics | Conversational AI, easy data blending | Subscription model, low cost |
Each platform has strengths and trade-offs. Choose based on your team's technical skills, budget, and data needs. For deeper insights, continue reading the full review.
How AI Tools can Finally Solve the Self-Service Analytics Problem?
1. Querio
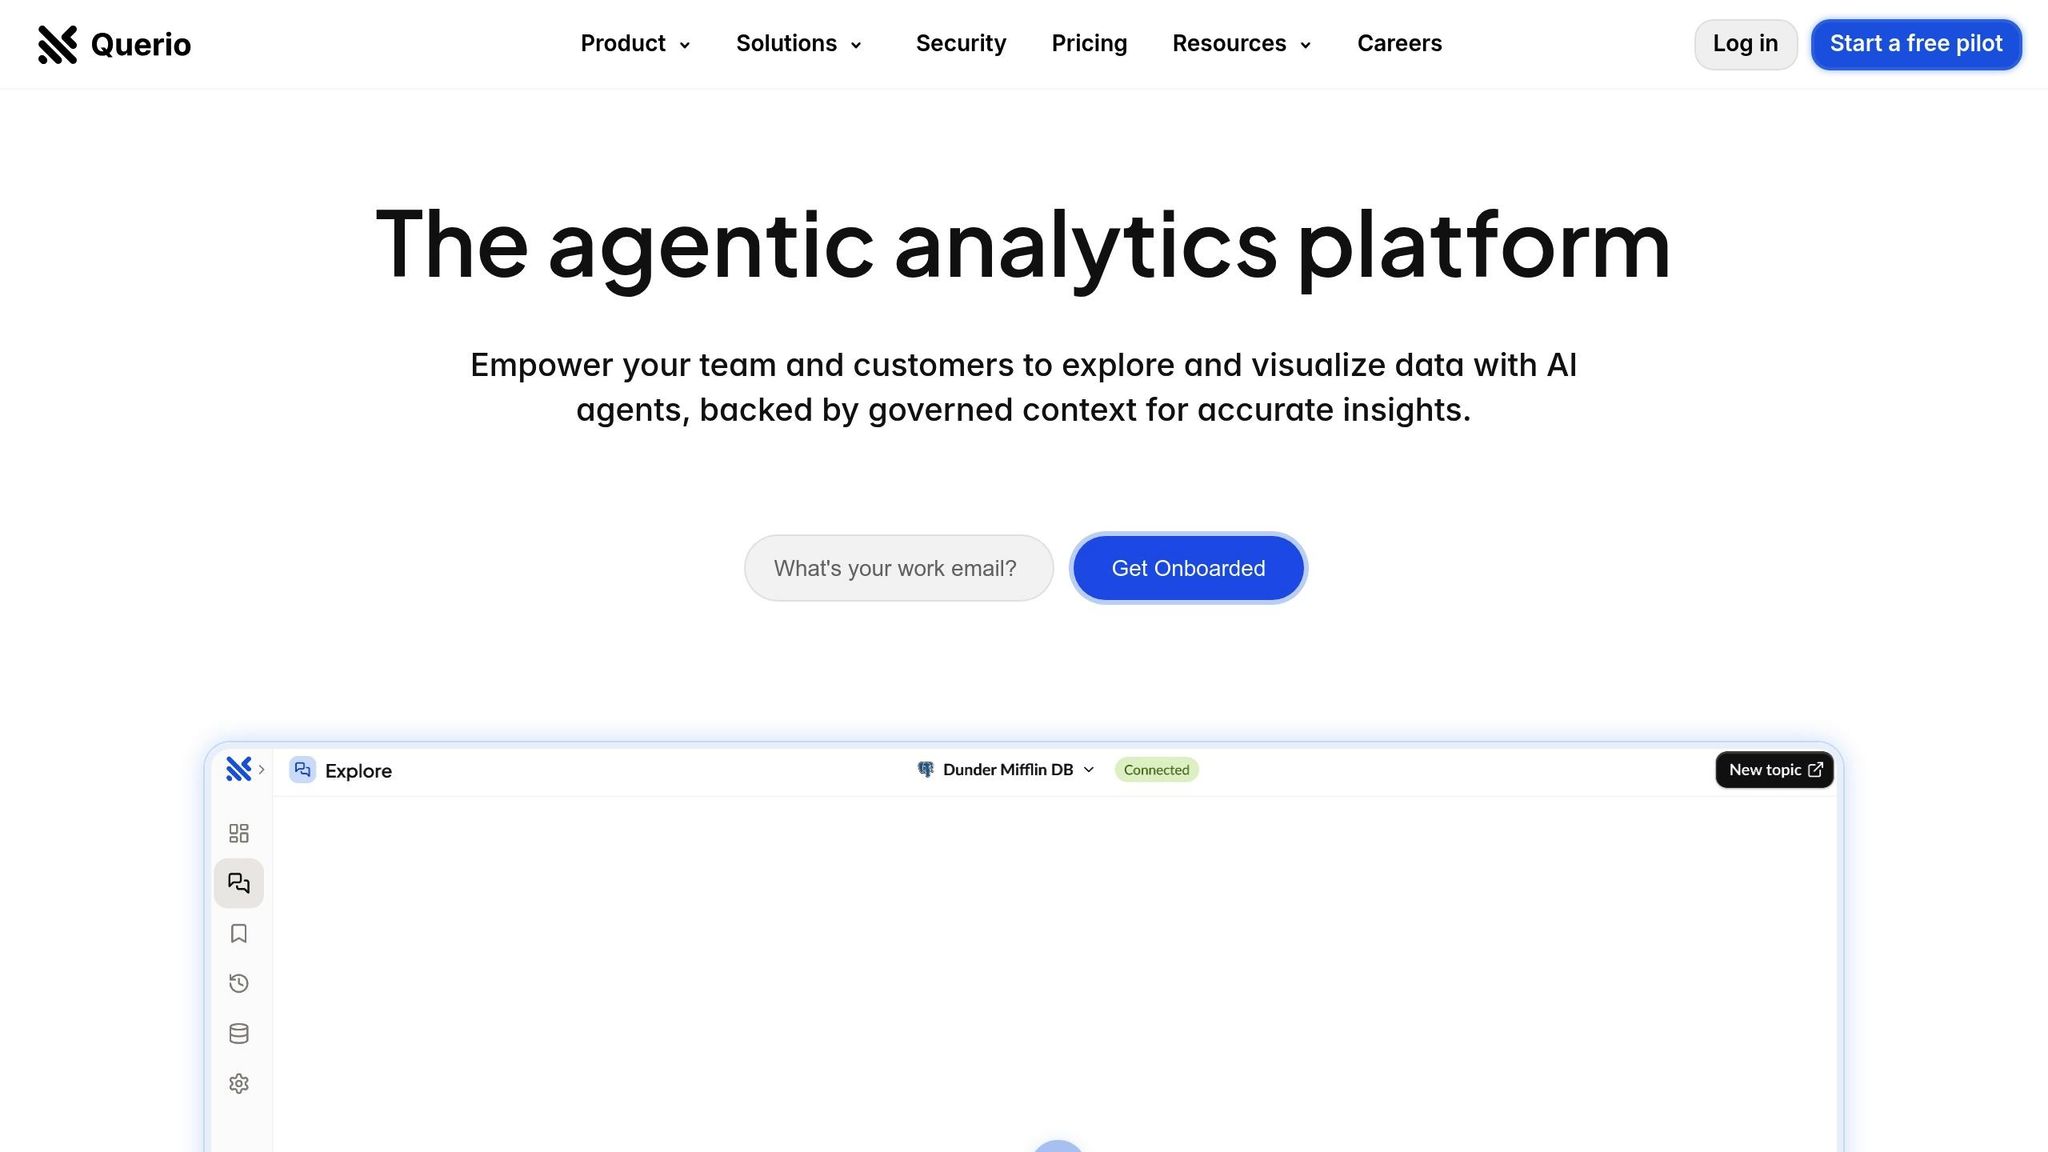
Querio is an AI-powered business intelligence workspace designed to bring data experts and business users together. It connects directly to major data warehouses like Snowflake, BigQuery, and Postgres, offering real-time insights that simplify self-service analytics. With Querio, users can ask questions in plain English - no SQL required.
AI Capabilities
Querio’s standout feature is its natural language processing. For instance, a marketing manager can type something like, "show me customer churn by region last quarter", and instantly see a detailed chart. The platform’s AI translates these conversational queries into SQL, running them directly on your warehouse data.
For deeper analysis, Querio offers a Python notebook environment that integrates SQL and Python with AI assistance. This allows data analysts to start with a simple natural language query and then dive into more advanced analytics - all within the same tool, without losing context.
Another key advantage is Querio’s use of your organization’s context layer. Data teams can predefine table relationships, business metrics, and glossary terms, which the AI uses to ensure consistent results. For example, if a finance analyst asks about "revenue", they’ll get the same calculation used by the executive team.
These features work seamlessly with Querio's strong data connectivity and governance capabilities.
Data Connectivity & Governance
Querio connects directly to your data warehouse with read-only access, enabling real-time queries without the need for ETL pipelines. This means you’re always working with up-to-date production data.
Governance is built around a semantic layer that defines table relationships and business logic, ensuring consistent metrics. Once configured, all users - whether they’re in sales, marketing, or finance - share the same definitions. For example, a sales VP asking about "qualified leads" will see the same data as the marketing team. Security is a priority, with encrypted credentials, SOC 2 Type II compliance, and a 99.9% uptime SLA.
Pricing & TCO
Querio offers a pricing model that’s designed to scale efficiently. Unlike most BI platforms that charge per user, Querio allows unlimited viewer users at no extra cost. This means customer success reps, regional managers, and store associates can all access dashboards without adding to your licensing fees.
Paid seats are only required for power users - those building dashboards, performing custom analyses, or working in the Python notebook environment. Pricing is tiered based on feature access rather than user count, and the platform includes a money-back guarantee. Plus, there are no hidden query fees; while your warehouse may incur compute costs, Querio’s BI layer doesn’t add extra charges for queries.
This approach helps free up analysts to focus on more strategic tasks.
Scalability & Performance
Querio’s architecture ensures high performance by running queries directly on your data warehouse rather than processing data within a separate BI layer. This means its performance scales with your warehouse infrastructure. If your Snowflake or BigQuery setup can handle the workload, Querio can deliver results quickly - even with many users accessing data simultaneously.
The platform also supports embedded analytics, allowing software companies to integrate Querio’s natural language query interface into their own applications. This gives end users the ability to perform self-service analytics while maintaining consistent governance.
Additionally, Querio includes a drag-and-drop dashboard builder, making it easy for teams to create KPI views and schedule reports. Executives can receive regular updates automatically, so they stay informed without needing to log in to the platform.
2. Microsoft Power BI
Microsoft Power BI is a user-friendly analytics tool designed to integrate seamlessly with Microsoft's Azure ecosystem. It offers a flexible platform suitable for everyday reporting as well as more complex analytical tasks. Since it's hosted on Azure, it benefits from strong cloud support, enabling advanced data governance and integration capabilities.
Data Connectivity & Governance
Thanks to its close ties with Azure, Power BI ensures smooth integration with other Microsoft applications, making it easier to connect and manage data. However, as usage grows, managing governance and workspaces can become more challenging. To keep things organized and maintain data integrity, it's crucial to establish clear rules around data access, refresh schedules, and user permissions.
Scalability & Performance
Power BI is known for its fast processing, whether for routine reports or more advanced analytics. That said, working with large datasets requires proper optimization to avoid performance issues. User ratings reflect its reliability, with scores of 4.5/5 on G2 and 4.6/5 on Capterra. For U.S. businesses navigating fast-changing markets in 2025, Power BI's scalability and performance are valuable assets - though scaling effectively calls for careful resource management.
3. Tableau
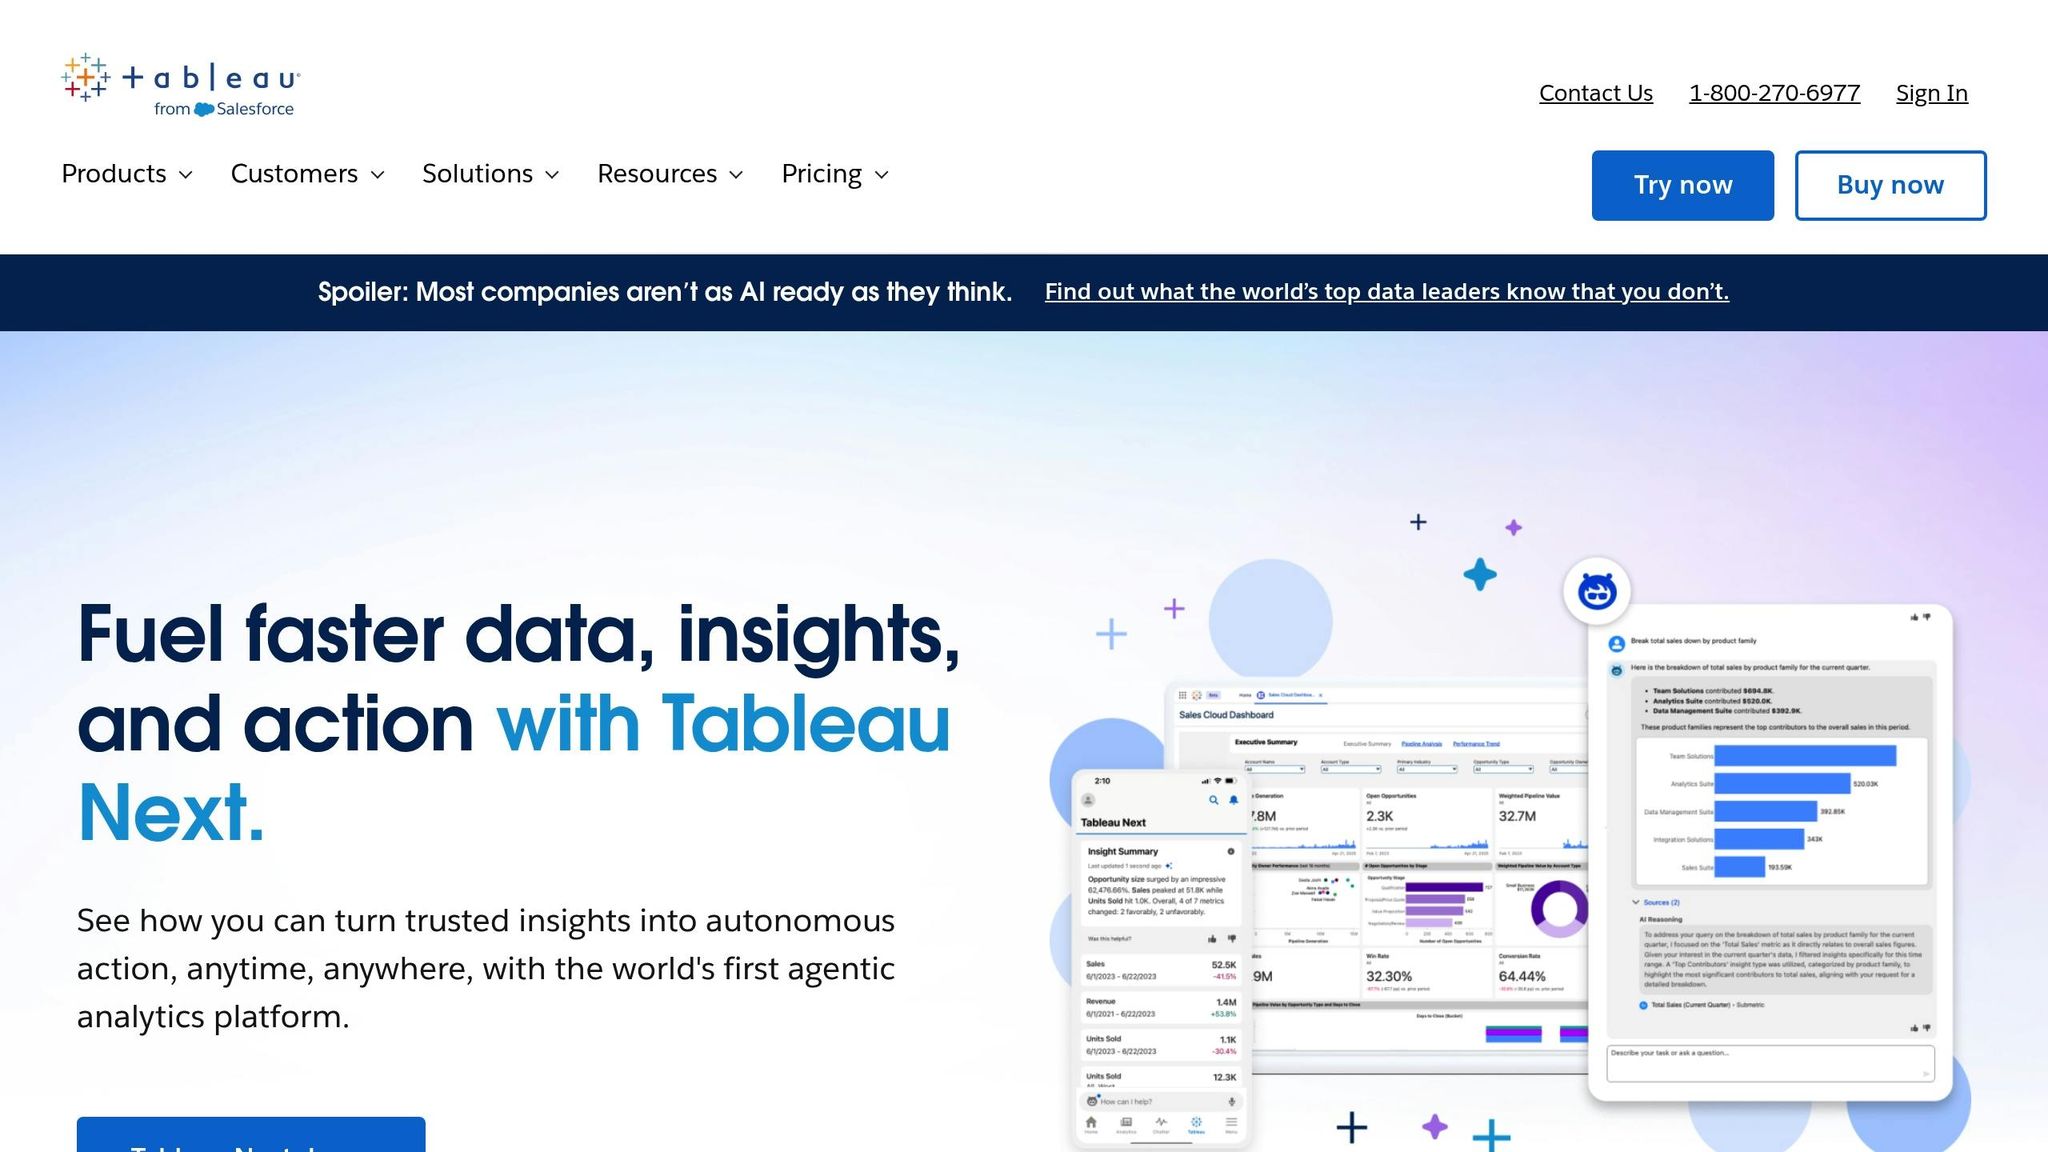
Tableau has made a name for itself by turning complex datasets into interactive, easy-to-digest dashboards. Its focus on visual storytelling enables users to explore data using a simple drag-and-drop interface, making it accessible even for those without a technical background. With its ability to visually communicate data insights, Tableau is well-suited to meet the evolving needs of U.S. teams in 2025. On top of that, its AI features add another layer of capability for data exploration.
AI Capabilities
Tableau's AI tools are designed to speed up data analysis and uncover patterns more efficiently. The Ask Data feature, powered by AI, allows users to type natural language questions - like "What were the regional sales last quarter?" - and instantly receive visualized answers. While this feature is great for straightforward queries, complex analyses still require building dashboards and preparing data the traditional way.
Data Connectivity & Governance
Tableau connects seamlessly to a variety of data sources using both live connections and extracts, bringing them together into unified dashboards. To tackle governance challenges in larger organizations, Tableau provides tools like data catalogs and curated data sources, ensuring consistent metrics and definitions. However, maintaining trusted datasets requires data governance in self-service analytics, including content publishing, data refresh schedules, and approved data sources.
Pricing & TCO
Tableau's pricing structure starts at $75 per user per month for full authoring capabilities, $42 per user per month for limited editing, and $15 per user per month for dashboard viewing. Beyond subscription fees, businesses should account for costs related to infrastructure, training, and maintenance. These hidden costs of traditional BI platforms can significantly impact the total cost of ownership. If using Tableau Server, hardware or cloud hosting expenses will add to the total cost, while Tableau Cloud includes hosting as part of its subscription. For U.S. organizations in 2025, Tableau continues to aim for a balance between advanced functionality and cost considerations.
Scalability & Performance
Tableau caters to both small-scale and enterprise-level analytics, but its performance depends heavily on the underlying data architecture. For smaller datasets and simpler visualizations, Tableau delivers quick and responsive dashboards. However, when dealing with millions of rows or complex calculations, performance can lag unless the system is properly optimized. Many organizations address this by using data extracts instead of live connections, which pre-aggregate data and reduce query times. Tableau Hyper further boosts performance by speeding up data loading and queries. For U.S. businesses managing increasing data volumes in 2025, achieving scalability requires investment in infrastructure, thoughtful dashboard design, and regular performance tuning. These steps ensure teams can handle growing data demands with ease.
4. Looker
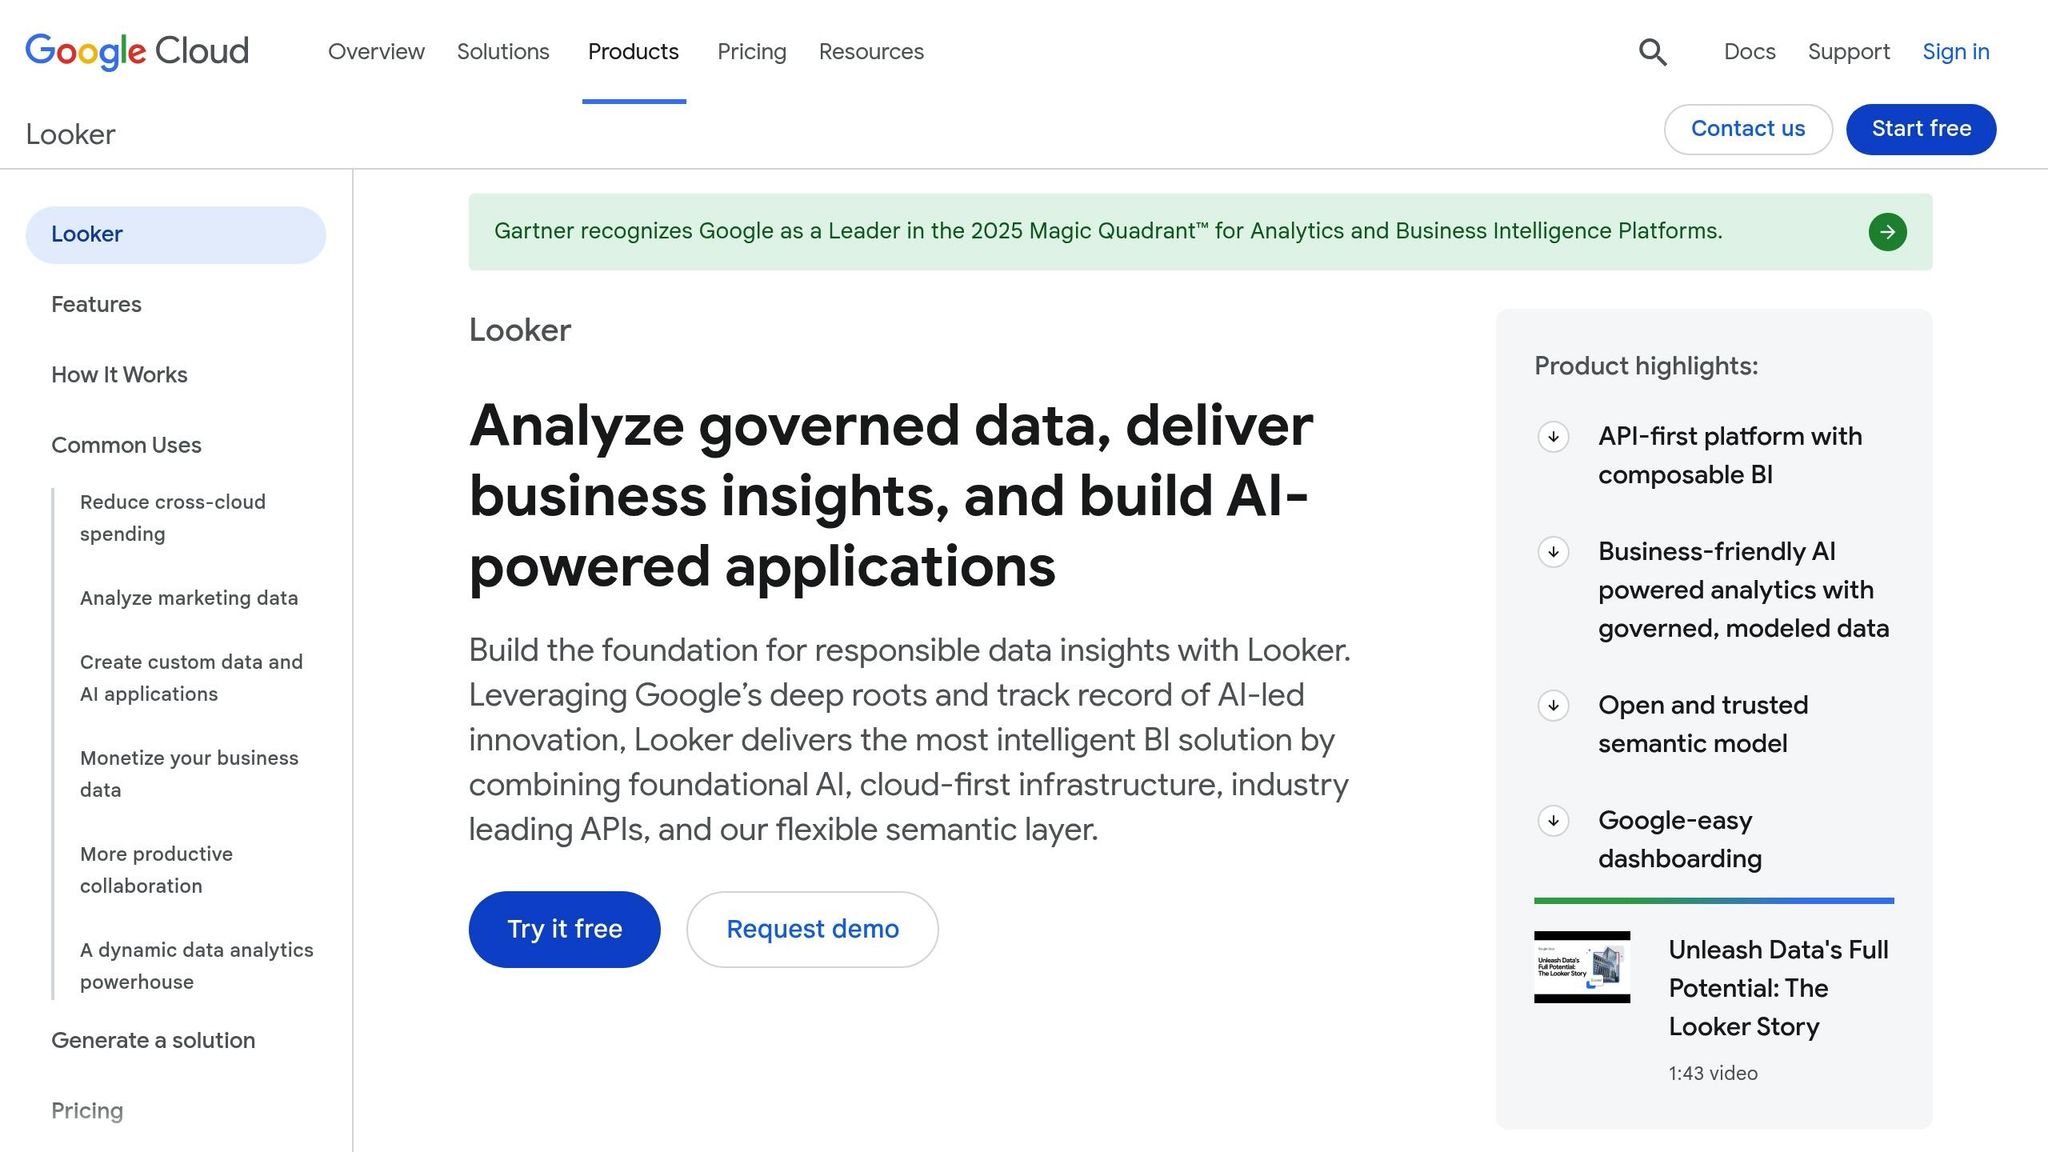
Looker takes a modern analytics stack approach by connecting directly to your cloud data warehouse, avoiding the need for duplicating data. As part of the Google Cloud Platform ecosystem, Looker runs live queries on your data source, ensuring you're always working with the latest information. However, this live query system means that its performance is tied to how well your data warehouse is optimized. Let’s break down how Looker handles data and scales with your needs.
Data Connectivity & Architecture
Looker connects directly to cloud data warehouses, with a strong focus on seamless integration with platforms like Google BigQuery. This makes it a popular choice for BigQuery self-service BI, though legacy setups can sometimes struggle with speed. This eliminates the need for extracting or storing data elsewhere. Instead, Looker uses a direct query model, which means every analysis is based on real-time data. The heavy lifting of query processing is handled by your data warehouse, ensuring that Looker stays lightweight while delivering accurate, up-to-date insights.
Scalability & Performance
Because Looker relies on live queries and cloud infrastructure, it’s built to scale alongside your business. It can support a large number of users, but its performance depends on several factors, including the size of your data, the complexity of your queries, and the resources available in your data warehouse. To get the best results, you may need to increase your data warehouse’s capacity to handle the additional workload efficiently.
5. Qlik Sense
Qlik Sense shines with its associative analytics engine, which takes a different approach compared to traditional query-based tools. In an era where self-service analytics are key to making quicker, smarter business decisions, this engine allows for flexible exploration, helping users uncover patterns that might otherwise go unnoticed. The platform supports both guided analytics for structured reporting and open-ended exploration for those who prefer to dive deeper into their data.
AI Capabilities
Qlik Sense integrates AI directly into its analytics process, making it easier for users to discover insights - even if they don’t know exactly what they’re searching for. Its Insight Advisor leverages machine learning to recommend visualizations and flag anomalies based on the data you select.
The platform also incorporates natural language processing (NLP), enabling users to ask questions in plain English and receive instant visual responses. For instance, typing a query like "What were last quarter's sales by region?" can generate a relevant chart on the spot. These AI-powered tools make Qlik Sense an excellent choice for exploratory analytics, complementing its robust data connectivity features.
Data Connectivity & Governance
Qlik Sense connects seamlessly to over 100 data sources, including cloud databases, on-premises systems, SaaS applications, and flat files. Its in-memory model loads data into RAM, ensuring quick processing and fast response times - even for complex calculations.
The platform offers flexibility in managing data updates. You can schedule automatic refreshes to keep analytics up-to-date or manually trigger updates when needed. The data manager provides a user-friendly interface for blending data from multiple sources, creating calculated fields, and defining relationships between tables - all without requiring coding skills.
On the governance side, Qlik Sense includes section access controls to manage data visibility based on user roles. For example, sales managers can view only their regional data, while executives can access company-wide insights. Additionally, the platform logs user activity, creating an audit trail that tracks who accessed specific data and when - an essential feature for organizations dealing with sensitive information or regulatory compliance.
Scalability & Performance
Qlik Sense’s in-memory architecture ensures strong performance for datasets that fit within your server’s RAM. The platform compresses data efficiently, often achieving a 10:1 compression ratio. For example, a 10 GB dataset might only use about 1 GB of memory, allowing you to work with larger datasets than you’d expect. However, performance depends on both data volume and server specifications.
For enterprises, Qlik Sense supports multi-node clustering, which distributes workloads across multiple servers. This setup allows the platform to handle thousands of users simultaneously and scale horizontally by adding more servers as your user base grows. The system balances user sessions across nodes to maintain consistent performance.
When datasets exceed available RAM, you may need to upgrade hardware or optimize your data by filtering historical records or aggregating detailed transactions. Qlik Sense performs best when data models are thoughtfully designed and the data loaded is carefully curated.
Pricing & TCO
Qlik Sense uses a capacity-based licensing model, where costs depend on the number of users and their access levels. Professional users who create and manage content require full licenses, while basic users who primarily view dashboards can use more cost-effective analyzer licenses. Discounts are available as the number of users increases, making it more economical at scale.
For U.S. companies in 2025, it’s important to consider licensing costs, infrastructure investments (such as servers with ample RAM for the in-memory architecture), and implementation expenses like data modeling, dashboard creation, and user training. Opting for a cloud deployment shifts infrastructure costs to a subscription model, eliminating large upfront hardware investments but introducing ongoing operational expenses instead.
6. Zoho Analytics
Zoho Analytics is a budget-friendly analytics platform tailored for small to mid-sized businesses. It focuses on being user-friendly while offering powerful reporting tools, making it accessible even for teams without extensive technical expertise. Its drag-and-drop interface allows users to create dashboards and reports without needing to write a single line of code, yet it still provides advanced features for those who want to dive deeper into their data.
AI Capabilities
At the heart of Zoho Analytics' AI features is its Zia assistant, which simplifies analytics through conversational AI data analysis. Users can ask questions in plain English and receive instant visualizations in response, a feature common among the best best conversational AI analytics tools. This makes complex data analysis more approachable, even for those without a technical background.
Zia doesn’t just wait for questions - it actively analyzes data to offer insights, flag anomalies like unexpected spikes or dips in metrics, and forecast trends in areas like sales, inventory, and customer behavior. These capabilities help businesses make informed decisions by identifying patterns and predicting future outcomes.
Data Connectivity & Governance
Zoho Analytics excels in connecting with a wide range of data sources. It integrates seamlessly with popular business tools like Salesforce, Google Analytics, Mailchimp, and QuickBooks. Additionally, it supports connections to databases such as MySQL, PostgreSQL, Oracle, and Microsoft SQL Server, while also allowing direct uploads of files in formats like CSV, Excel, JSON, and HTML.
The platform simplifies data imports, offering scheduled automatic syncs to keep reports current. Its data blending feature stands out, enabling users to merge information from multiple sources. For instance, you could combine CRM data with financial metrics to create a comprehensive report.
On the governance front, Zoho Analytics provides robust role-based access controls, ensuring that sensitive information is only accessible to authorized users. Features like audit logs, which track user activity, and encryption for data both in transit and at rest, further strengthen its security measures. This combination of connectivity and security ensures that the platform can handle growing data demands while maintaining compliance.
Scalability & Performance
Zoho Analytics is designed to handle both everyday reporting and more complex data analysis tasks with ease. As a cloud-based solution, it eliminates the need for on-premises infrastructure, offering flexibility and scalability as your data needs expand. For larger datasets and intricate queries, higher-tier plans ensure consistent performance.
The platform also integrates with tools like Zoho DataPrep, which preps and organizes data before analysis. This feature can save time by streamlining recurring reports and dashboard updates, making workflows more efficient.
Pricing & TCO
Zoho Analytics operates on a subscription model, offering plans that cater to both small teams and larger organizations. Its pricing is designed to scale with your needs, accommodating growing data volumes and additional users. The platform’s overall cost remains low thanks to its straightforward implementation process and extensive self-help resources, reducing the need for specialized technical support.
However, businesses should account for potential additional costs, such as those associated with data preparation or upgrading plans as their requirements expand. Even with these considerations, Zoho Analytics remains a cost-effective choice for organizations looking to enhance their data analysis capabilities.
Strengths and Weaknesses
Let’s take a closer look at the main advantages and limitations of some of the leading self-service analytics tools. Each platform comes with its own trade-offs, balancing cost, scalability, and security. The key to choosing the right tool lies in understanding these trade-offs and aligning them with your organization’s priorities - whether you’re focused on advanced AI capabilities, strong data governance, or managing overall costs.
Here’s a quick breakdown of each platform’s strengths and weaknesses:
Tool | Key Strengths | Key Weaknesses |
|---|---|---|
Querio | • AI-powered natural-language querying with live connections to Snowflake, BigQuery, and Postgres | • Premium pricing due to advanced AI-native features |
Microsoft Power BI | • Widely used with seamless integration into enterprise systems | • Advanced AI features require technical expertise to fully utilize |
Tableau | • Known for sophisticated data visualization and a strong user community | • Higher overall costs, particularly for smaller teams |
Looker | • Focuses on data governance with customizable modeling layers | • Requires technical skills (like SQL and its modeling language), which can limit self-service use |
Qlik Sense | • Features an associative analytics engine to uncover key data relationships | • Per-user pricing can complicate budgeting |
Zoho Analytics | • Affordable pricing with a user-friendly drag-and-drop interface | • May struggle with scalability for very large datasets |
These insights reflect the evolving trends in data analytics as we look toward 2025.
Modern AI tools are making analytics more accessible by enabling data cleaning, interpretation, and visualization through plain English queries. This reduces the need for specialized teams and opens the door to broader usage. Cloud-native solutions are also stepping up to handle increasing data volumes while ensuring security with improved governance and role-based access. However, pricing models vary widely - so it’s important to consider not just subscription fees but also costs for implementation, training, and ongoing maintenance.
Ultimately, the best tool for your organization depends on factors like team size, technical expertise, existing data infrastructure, and budget. Carefully weigh these trade-offs to find the platform that meets your needs in 2025.
Conclusion
When choosing an analytics tool, focus on what aligns best with your organization's specific needs. The analytics landscape has shifted dramatically, with AI-powered insights and broader access to data redefining how businesses make data-driven decisions with AI.
Start by identifying your core requirements based on how your teams operate daily and the decisions they need to make. A Gartner report highlights that 47% of digital workers struggle to locate the data they need - a challenge the right tool should address. If your finance, product, or operations teams require quick, actionable insights, prioritize platforms with essential BI tool features like natural-language querying and user-friendly interfaces. Also, don’t just look at subscription fees; consider the complete cost structure.
Think about the total investment, including implementation, training, and ongoing maintenance. Budgeting should reflect the entire lifecycle of the tool. Since data preparation can take up 80% of the time in analytics projects, tools that simplify this step can provide a strong return on investment. Keep in mind that some platforms may require advanced technical skills to unlock their full potential, potentially increasing costs through extended onboarding or the need for specialized staff.
For U.S. businesses dealing with sensitive data, governance and security are non-negotiable. Look for features like SOC 2 Type II compliance, role-based access controls, and comprehensive audit trails. The best tools strike a balance between accessibility and strong governance, ensuring users can access what they need while securing sensitive information.
Integration is another critical factor. Assess how well the tool connects with your current data infrastructure, whether it’s Snowflake, BigQuery, Postgres, or another system. Compatibility with your existing setup can save significant time and effort.
Test each tool with your actual datasets and real-world use cases. Observe how easily team members can complete tasks independently - this will reveal if the tool truly delivers on its promise of self-service analytics. The ultimate goal is to turn data from a static record into a dynamic, real-time resource that empowers decision-making across all departments.
The right analytics platform not only lightens IT workloads but also fosters collaboration across teams and speeds up insights. As AI and machine learning continue to evolve, features like automated insights and edge analytics are becoming the norm. By 2025, these advancements will make it even more critical to invest in tools designed for the future of data analysis. The right choice will transform your data into a strategic asset that drives smarter, faster decisions across your organization.
FAQs
How does Querio's natural language processing improve the user experience compared to traditional SQL queries?
Querio leverages natural language processing (NLP) to simplify data analysis, letting users ask questions in plain English instead of wrestling with complex SQL queries. This makes it easier for non-technical users to dive into data without a steep learning curve, while also speeding up the process of uncovering insights.
By using NLP, Querio allows users to focus on decision-making rather than getting bogged down by the technicalities of query syntax. Whether you're tracking trends, creating reports, or pinpointing essential metrics, Querio makes the entire process straightforward and accessible for everyone in your team.
What should businesses look for in self-service analytics tools to ensure seamless integration with their existing data warehouses?
When choosing a self-service analytics tool, one of the first things to check is how seamlessly it works with your existing data warehouse. A tool with strong data connectivity and support for popular data storage systems can make accessing your datasets much easier.
It’s also worth examining if the tool allows for real-time data synchronization and supports your specific data formats. This ensures your analytics stay current and efficient, enabling your team to make quick, informed decisions without dealing with delays or extra manual work.
How does Querio's pricing model influence the overall cost of ownership for businesses using self-service analytics tools?
Querio's pricing structure is designed to impact the total cost of ownership (TCO) for businesses in a meaningful way. With flexible subscription plans and scalable options, companies can tailor their spending to match their specific requirements, avoiding unnecessary costs. This setup makes it easier for businesses, regardless of size, to manage budgets effectively while still benefiting from advanced analytics tools.
On top of that, Querio's AI-powered automation and intuitive interface can cut down on the need for extensive training or hiring specialized personnel. This not only simplifies operations but also trims down expenses. By combining these features, businesses can perform quicker, more budget-friendly data analysis without sacrificing the depth or quality of their insights.
Related Blog Posts