Business Intelligence
How to Build an Embedded BI Stack from Scratch
A practical five-step guide to build a secure, real-time embedded BI stack—connect your warehouse, define a semantic layer, add AI, design dashboards, and embed.
An embedded BI stack integrates analytics directly into your application, allowing users to access insights without switching platforms. This guide breaks down how to build one efficiently, covering tools, skills, and steps to embed analytics seamlessly. Here's the process in a nutshell:
Start with the essentials: A cloud data warehouse (e.g., Snowflake, BigQuery) and a BI platform like Querio that supports real-time querying and natural-language analytics.
Key components: Data storage, a BI engine, integration tools (React SDKs, APIs, or iframes), and robust security measures.
Steps to build:
Connect your data warehouse with a read-only service account.
Define a semantic layer for consistent metrics and business terms.
Add AI-driven analytics for plain-English queries and instant visualizations.
Design tailored dashboards that pull live data.
Embed dashboards into your application using APIs or iframes.
Security and performance tips: Follow embedded analytics security best practices like SOC 2 compliance and row-level security (RLS), query caching, and pre-aggregated metrics for fast, secure dashboards.
Whether you're embedding for internal teams or external users, this guide simplifies the process of delivering real-time analytics where they’re needed most.
AI/BI Dashboards Embedding - A tutorial
What You Need Before You Start
Before diving in, make sure you have a cloud data warehouse (for storing structured data like transactions, inventory, or logs) and a BI platform to define metrics, build visualizations, and embed insights into your applications.
Most teams rely on platforms like Snowflake, BigQuery, or Postgres as their data warehouse. Querio connects directly to these platforms via a read-only service account, ensuring your data stays within your infrastructure. To get started, you'll need key credentials like Account ID, Warehouse Name, Database, and Schema. For better security, opt for RSA Key-Pair authentication instead of traditional passwords - 2048-bit or 4096-bit keys are standard for production setups. Below is a breakdown of the essential tools you'll need for your embedded BI stack architecture.
Required Tools and Integrations
An embedded BI stack relies on three main components: data storage, a BI engine, and integration tools. The BI engine - such as Querio - handles everything from data modeling to creating visualizations. Integration tools (like React SDKs, JavaScript APIs, or iframes) link the BI engine to your application's front end.
Component | Purpose | Example |
|---|---|---|
Data Storage | Centralized repository for structured data | Snowflake, BigQuery, Postgres, QuestDB |
BI Engine | Data modeling, visualization, and metrics | Querio |
Integration | Connects BI engine to front-end app | React SDK, JavaScript API, iFrames |
Security | Identity management and data segregation | JWT, Auth0, SAML, Row-Level Security |
These tools form the backbone of a secure, real-time analytics system. Querio directly queries your data warehouse, delivering real-time insights without duplicating data. When setting up your Querio account, configure a connection using a service account with SELECT-only permissions. If your warehouse is protected by a firewall, make sure to whitelist Querio's production IP ranges. For Snowflake users, consider setting your warehouse to "always on" or enabling quick resume options. Keep in mind that Snowflake clusters typically process up to eight queries simultaneously before queuing begins, so performance tuning is key.
Skills You'll Need
With the technical setup in place, your team will need a few core skills to get everything running smoothly. At a minimum, you'll need basic knowledge of SQL for creating datasets, defining metrics, and running exploratory analyses. For example, you might use SQL to join tables like orders and customers to create business-ready models.
A basic understanding of data governance is also essential. This involves mapping user attributes (like customer_id or account_id) to data dimensions, ensuring users only see data they’re authorized to access. Querio simplifies this with Row-Level Security (RLS), which automatically filters data based on the logged-in user's credentials. Additionally, Querio offers a Python notebook environment tailored for AI agents, allowing you to run SQL and Python side by side without switching tools.
If your team’s SQL skills are limited, natural-language querying can help bridge the gap. Non-technical users can ask questions in plain English - like "What were our top-selling products last quarter?" - and get instant, accurate charts. This reduces the workload for data analysts while maintaining strict governance protocols.
How to Build Your Embedded BI Stack
5 Steps to Build an Embedded BI Stack from Scratch
Now that you’ve got the groundwork in place, let’s dive into the actual process of building an embedded BI stack. Using Querio, this involves five key steps that transform your raw data warehouse into a fully integrated analytics experience within your application.
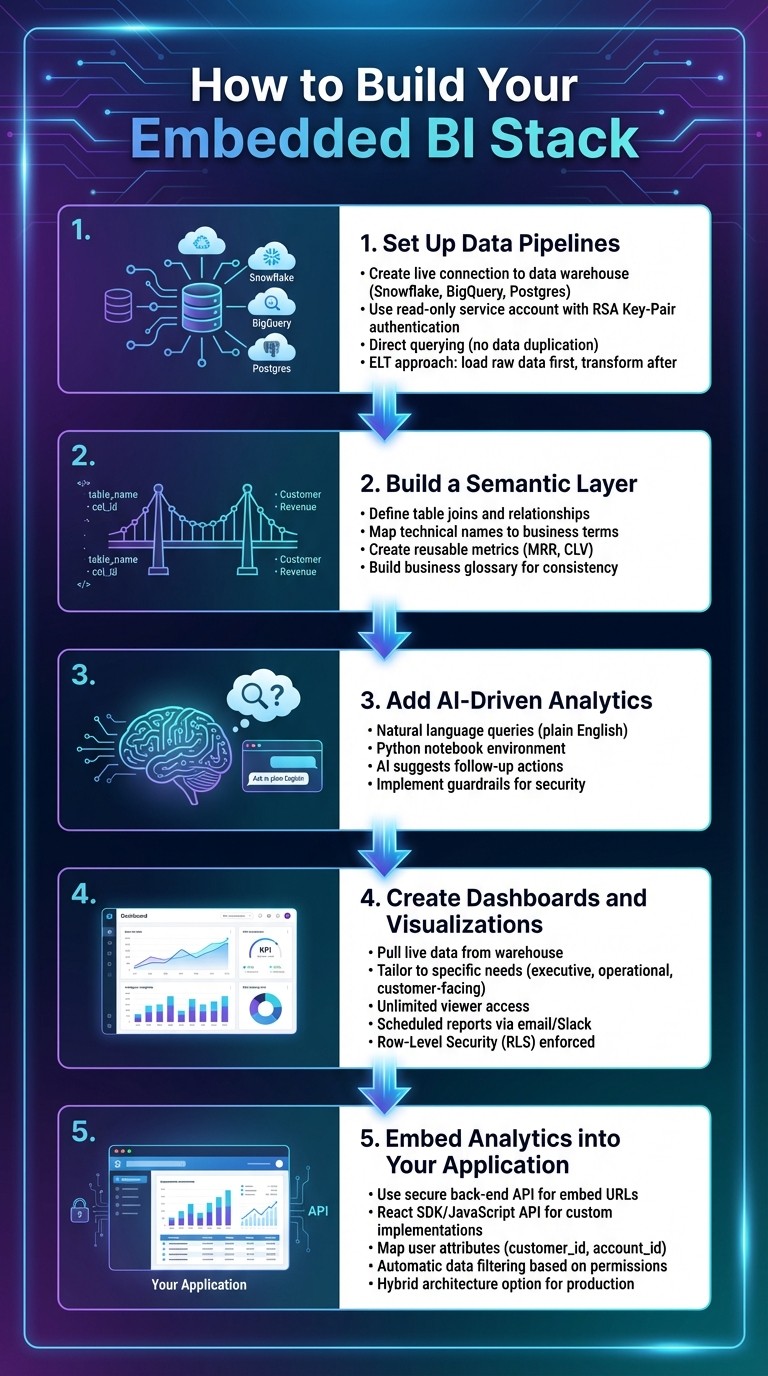
Step 1: Set Up Data Pipelines
Start by creating a live connection between Querio and your data warehouse. Unlike traditional ETL methods that involve duplicating data, Querio queries your warehouse directly - whether it’s Snowflake, BigQuery, or Postgres. This keeps everything real-time and avoids unnecessary data copies, saving on storage costs while maintaining a single source of truth.
To ensure security, use a read-only service account with RSA Key-Pair authentication when configuring the connection. For data ingestion, adopt an ELT approach: load raw data into your cloud warehouse first, then transform it afterward. This method allows you to adjust historical data without needing to redo complex pipelines. Schedule batch jobs during off-peak hours to avoid impacting business operations.
Step 2: Build a Semantic Layer
The semantic layer serves as a bridge between your technical database structures and the business-friendly language your team uses. In Querio’s context layer, you’ll define table joins, create calculated metrics, and build a business glossary to ensure consistent data usage across your organization.
For example, map technical table names to intuitive business terms and define relationships between tables - like joining orders and customers using customer_id. Set up reusable metrics, such as "Monthly Recurring Revenue" or "Customer Lifetime Value", which can be applied across all reports and dashboards.
This layer becomes even more powerful when paired with AI. By enriching your models with detailed metadata, Querio’s natural-language engine can better interpret plain-English questions and return precise answers.
Step 3: Add AI-Driven Analytics
Querio’s AI-driven analytics simplify how users interact with data. Instead of writing SQL queries, users can ask straightforward questions like, "What were our top-selling products last quarter?" and instantly get clear visualizations. The AI leverages your semantic layer to translate business language into accurate technical queries.
For advanced analysis, Querio includes a Python notebook environment designed for AI agents. This feature lets you work with SQL and Python side-by-side without switching tools, while maintaining the same governance standards as your dashboards. The AI can even suggest follow-up actions - like analyzing inventory levels after identifying top-selling products.
"Conversational BI should also focus on Answers & Actions. However, because it is powered by AI, we face a big difference from traditional BI: it's impossible to build a system that will answer all questions with perfect accuracy every time." - FirstLight BI
To maximize the effectiveness of AI, focus on the most critical business questions your users need answered and what actions those answers should drive. Implement guardrails to restrict unauthorized access to sensitive data and prevent the generation of inaccurate information. Regularly log and audit user prompts and AI responses to fine-tune the system.
Step 4: Create Dashboards and Visualizations
Once your pipelines and semantic layer are ready, it’s time to build dashboards in Querio. These dashboards pull live data directly from your warehouse, ensuring real-time accuracy.
Design dashboards tailored to specific needs - executive summaries for leaders, operational metrics for teams, or customer-facing analytics for external users. Querio’s unlimited viewer access means you can share dashboards widely without worrying about user-based costs. Set up scheduled reports to deliver insights automatically via email or Slack, keeping everyone informed without requiring them to log in.
For embedded use cases, dashboards will respect Row-Level Security (RLS). For instance, a customer logging into your app will only see their own data, while internal users can access aggregated metrics.
Step 5: Embed Analytics into Your Application
Finally, integrate analytics into your application seamlessly. Use a secure back-end API to generate immutable embed URLs for iframes or leverage the React SDK/JavaScript API for custom front-end implementations.
Map user attributes from your application - like customer_id or account_id - to dimensions in Querio’s context layer. This ensures that data filtering happens automatically, so users only see what they’re authorized to view.
For production environments, consider a hybrid architecture: run your database connection in your cloud environment while handling metadata requests through Querio’s API. This setup strikes a balance between robust security and ease of management.
Security and Performance Best Practices
Keeping your embedded BI stack secure and running smoothly is non-negotiable. Users expect their data to load quickly and remain protected at all times. Querio tackles these challenges with features like SOC 2 Type II compliance, granular access controls, and caching to ensure dashboards stay fast, even during heavy traffic.
How to Secure Your BI Stack
Start with SOC 2 Type II compliance, which guarantees high standards for data security, availability, and confidentiality. Querio adheres to this compliance while also offering a 99.9% uptime SLA, so your embedded analytics meet enterprise-grade security needs without requiring extra setup.
To control data visibility, use row-level security (RLS). This ensures users only see data relevant to them by filtering based on attributes like customer_id or account_id. These attributes are passed from your application to Querio using signed URLs or JSON Web Tokens (JWT). For example, if Customer A logs in, they'll only see rows where customer_id = A. Meanwhile, your internal team can access aggregated metrics across all customers.
"A single human user should be associated with a single Looker user account with a single set of user attribute values."
– Looker Documentation
Protect sensitive credentials like embed secrets and API keys as you would admin passwords. Store them securely in vaults, rotate them frequently, and never expose them on the client side. Use read-only service accounts to limit database changes and enforce the principle of least privilege for every role.
Once your security measures are solid, focus on improving dashboard performance to keep users happy.
How to Improve Performance
Leverage query caching to make dashboards load faster. Querio stores query results in a dedicated layer, so repeated requests for the same data are served instantly without hitting your database again. This reduces strain on your warehouse and speeds up reporting, even during high-traffic periods.
Adjust cache durations based on how fresh the data needs to be. For real-time dashboards, keep cache times short - around 5 to 15 minutes. For reports that update less frequently, like daily executive summaries, extend cache times to several hours. The semantic layer you set up earlier ensures that metrics like "Monthly Recurring Revenue" remain consistent across all dashboards, even when cached.
For environments with heavy traffic, pre-aggregate commonly used metrics in your context layer. This allows Querio to generate and cache summary tables during off-peak hours, delivering instant results when users need them most.
Testing and Deployment
Before launching your embedded BI stack, it's crucial to test it thoroughly. Start with a proof of concept (PoC) that includes key stakeholders from the beginning. This allows you to verify that the solution integrates seamlessly with your existing backend - whether you're using NodeJS, .NET, or Java - and ensures dashboards load quickly and display properly across all devices. Schedule weekly PoC check-ins to address any issues early in the process.
Run integration tests to confirm smooth connections and proper row-level security. Additionally, perform UX tests to ensure consistent branding and responsive design. If your organization already has internal data models, you may be as much as 70% ready for deployment, making it possible to roll out a beta version in as little as three to six weeks. These tests ensure your stack works harmoniously with your backend, setting the stage for a smooth launch.
Iframe vs. API Embedding: Which to Choose
When deciding between iframe and API/SDK embedding, consider your priorities: speed or customization. Using an embedded analytics guide can help you evaluate these options.
Iframe embedding is the quicker option. By simply dropping a code snippet into your app, you can have dashboards up and running almost immediately. This is perfect for situations where you need a fast launch and minimal customization.
API or SDK embedding, on the other hand, offers full control over styling, layout, and interactivity. While it requires more development effort, it's the better choice for creating a white-labeled product where analytics need to blend seamlessly into your app.
Feature | Iframe Embedding | API / SDK Embedding |
|---|---|---|
Speed to Deploy | Fast - embed with a code snippet | Slower - requires custom integration |
Customization | Limited to iframe parameters | Full control over UI and layout |
Branding | Dashboard retains some platform styling | Fully white-labeled experience |
Ideal for | Quick launches, internal tools | White-labeled products, native feel |
Deployment Checklist
After incorporating testing feedback, use this checklist to ensure a successful launch. Start by setting up your infrastructure, including servers, databases, and security configurations. For consistency across environments, consider containerizing your deployment with tools like Docker or Kubernetes. Confirm that signed URLs or JWTs are passing the correct user attributes.
Focus on launching three to five key dashboards initially, rather than trying to build everything at once. This approach allows you to quickly gather customer feedback and adjust your strategy before committing to more complex features. Establish a beta testing group to evaluate the live environment and monitor performance. Tools like Querio's semantic layer can help maintain fast and consistent dashboards, even as usage grows.
FAQs
What security measures should I prioritize when building an embedded BI stack?
When adding Business Intelligence (BI) to your application, security should be a top priority at every level. A good starting point is to separate customer-facing analytics from your internal systems. By using a dedicated embedded instance that connects only to the specific data sources you want to share, you minimize the risk of exposing sensitive information from your core data warehouse.
Make sure all communications are secure by enforcing TLS (HTTPS) and sandboxing your embedded iframe to prevent cross-origin data leaks. Use least-privilege access principles, setting up role-based permissions and row-level security to ensure users can only view the data they are authorized to access. Strengthen authentication by implementing SSO (Single Sign-On) with protocols like SAML or OAuth, and use short-lived embed tokens to reduce the risk of credential theft.
Other key security measures include encrypting data at rest, rotating secrets on a regular basis, and keeping your BI components updated with the latest patches to address vulnerabilities. Don’t overlook the importance of monitoring and audit logs - they’re essential for spotting and responding to any unusual activity quickly.
How does AI-driven analytics improve user engagement in embedded BI systems?
AI-powered analytics have revolutionized embedded BI systems, turning them into user-friendly, interactive tools. These systems allow users to ask straightforward, natural-language questions like, “What were the sales figures for last quarter?” Without any technical know-how, the platform interprets these queries and delivers precise insights along with polished visualizations. The result? Data exploration becomes faster, easier, and accessible to everyone.
Beyond answering questions, AI takes things further with predictive insights and anomaly detection. It can forecast upcoming trends, flag unexpected changes, and bring critical insights to the forefront - all in real-time. By embedding these features directly into your application, users gain a smooth, data-rich experience that feels like a natural extension of the platform. This enhances engagement for both tech-savvy users and those without technical expertise.
What should I consider when choosing between iframe and API embedding for analytics?
When deciding between iframe and API embedding, the choice largely depends on what your product requires and what you prioritize:
Quick setup vs. flexibility: If you're looking for a fast and straightforward implementation, an iframe is a great option. It requires minimal coding and is perfect for rapid deployment. On the other hand, APIs give you complete control over the interface, allowing you to seamlessly integrate features into your app. However, this comes with the trade-off of needing more development time and effort.
Security considerations: While iframes are easy to use, they can introduce potential security vulnerabilities, such as token exposure. APIs, in contrast, support advanced security measures like single sign-on (SSO), row-level security, and compliance with stricter data protection requirements.
Customization and user experience: APIs shine when you need real-time interactions, custom filters, or a fully branded experience that aligns perfectly with your app's design. Iframes, though more limited in customization and interactivity, are still a solid choice for static, pre-designed dashboards.
For a simple, standalone solution that’s quick to implement, an iframe might be all you need. But if your focus is on deeper integration, stronger security, and a tailored user experience, APIs are the way to go.
Related Blog Posts


