Business Intelligence
How to Measure Text-to-SQL Accuracy: Metrics & Benchmarks
Evaluate text-to-SQL by execution accuracy, result equivalence, schema-linking, latency, and cost; test on your live warehouse.

If a text-to-SQL tool gives the wrong number, it fails the test - even if the SQL runs.
When I measure text-to-SQL for BI work, I don’t look at one score. I check whether the query runs, uses the right tables and columns, returns the right result, and stays within a time and cost range my team can accept. That matters because one bad JOIN can skew numbers, and BigQuery query cost can vary by as much as 3.4x across model outputs.
Here’s the short version:
- Exact match is not enough. Two SQL queries can look different and still return the same answer.
- Execution and result checks matter more. I care most about whether the output is correct on the warehouse.
- Schema-linking helps debug errors. It shows whether the model picked the wrong table or column.
- Valid query rate is only the baseline. A query can run and still be wrong.
- Latency and cost count too. A common target is 5 seconds or less from question to result.
- Public benchmarks help, but they don’t prove production fit. I still need tests on my own warehouse.
- An internal benchmark should use 50–100 gold questions based on actual analyst asks.
- Success thresholds depend on use case. Ad hoc work may allow some variance; regulated reporting does not.
A simple way to think about it: good text-to-SQL means the right business answer, on your data, at a cost and speed you can live with.
| Metric | What I use it for | Main limitation |
|---|---|---|
| Exact Match | Regression checks for fixed queries | Misses valid SQL alternatives |
| Execution Accuracy | Check if generated and reference queries return the same output | Can overstate quality on small datasets |
| Result-Set Equivalence | Compare answers while ignoring row order and formatting | Small numeric/date differences can fail |
| Schema-Linking | Find wrong table or column choices | Doesn’t catch bad logic by itself |
| Valid Query Rate | See how often queries run without errors | Running does not mean correct |
| Latency | Track user wait time | Fast answers can still be wrong |
| Token Cost | Track model and warehouse spend | Lower cost can hurt answer quality |
If I were setting up an eval today, I’d score every question on these seven checks, run tests on a live read-only warehouse, allow about ±1% tolerance for numeric output, and sort failures by type so I know what to fix first.
::: @figure 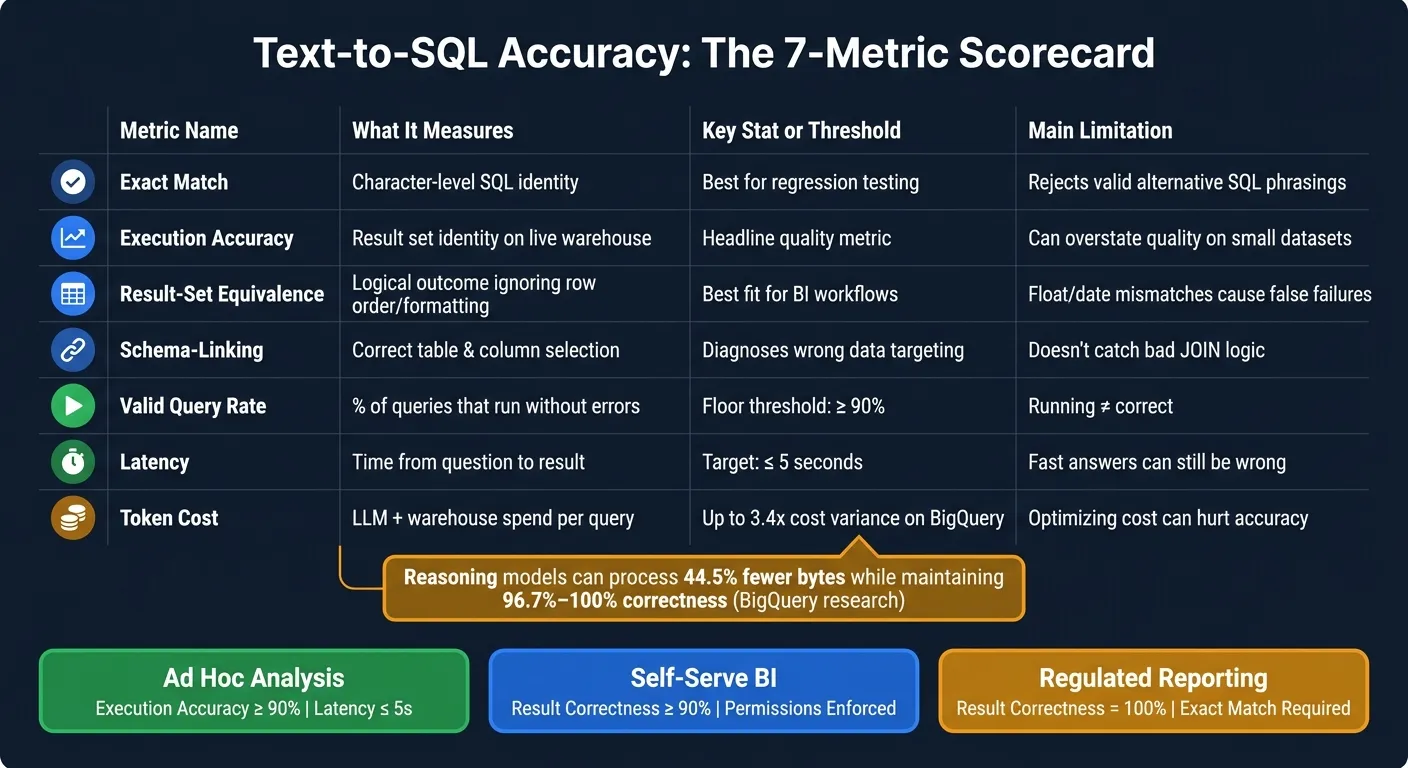 {Text-to-SQL Accuracy Metrics: The Complete Scorecard}
:::
{Text-to-SQL Accuracy Metrics: The Complete Scorecard}
:::
Text to SQL at 95% Accuracy. Do You NEED a Semantic Layer??
::: @iframe https://www.youtube.com/embed/j2G4PWCq10k :::
Core metrics for measuring text-to-SQL accuracy
Text-to-SQL needs a scorecard, not one headline number. Each metric answers a different question: Did the SQL run? Did it use the right schema? Did it return the right answer? What did it cost to get there? The point isn't to chase a single score. It's to use a warehouse-native scorecard that separates syntax, logic, and day-to-day fit.
Exact match, execution accuracy, and result-set equivalence
Exact match compares generated SQL to a reference query character by character. It's handy for regression testing, mainly in governed reporting setups where you want to confirm that a known-good query hasn't changed.
That said, it's a rigid metric. Two queries can mean the same thing and still look different on the page. Exact match will mark one wrong anyway.
Execution accuracy takes a more practical route. It runs both queries on the same warehouse and compares the outputs. That's a stronger signal for ad hoc analysis because it checks whether the system got the answer right, not whether the SQL merely looks close.
There is a catch. On small test sets, two different queries can still return the same output. When that happens, execution accuracy can look better than the system actually is.
Result-set equivalence is often the best fit for BI work. It uses set-based comparison, which means it ignores harmless differences like row order or formatting. For BI teams, that's often the clearest sign that the user got the right numbers.
Its weak spot is easy to miss: floating-point precision and date format mismatches can trigger false failures even when the underlying logic is fine.
Schema-linking and clause-level diagnostics
Schema-linking checks whether the model picked the right tables and columns. It does this by parsing the SQL and comparing those references with your warehouse schema. When a query returns the wrong answer, schema-linking helps you see whether the model started from the wrong data in the first place.
But schema-linking doesn't prove the logic is right. A query can point to the correct tables and still use the wrong JOIN condition, filter the wrong date range, or aggregate at the wrong grain.
That's why clause-level diagnostics matter. Looking at SELECT, WHERE, GROUP BY, and JOIN separately makes it much easier to spot where the logic broke.
Valid query rate, latency, and cost under real usage
Valid query rate is the floor, not the finish line. It measures the share of generated queries that run without errors. If that number is below 90%, the system has basic problems [1]. Of course, a query can run and still return the wrong data, so this metric matters, but it can't stand on its own.
Token cost hits both spend and latency, and finance teams tend to spot waste here first. In Snowflake, BigQuery, Redshift, or Postgres workflows, a common SLA target is under 5 seconds from question to result [1].
BigQuery makes the cost story even sharper. LLM-generated queries can show up to 3.4x cost variance [2]. Research on BigQuery also found that reasoning models can process 44.5% fewer bytes than standard models while keeping 96.7%–100% correctness [2].
| Metric | What it measures | How to compute | Where it helps | Common failure mode |
|---|---|---|---|---|
| Exact Match | Character-level syntax identity | Binary string comparison vs. reference SQL | Regression testing for governed reporting | Rejects valid alternative SQL phrasings |
| Execution Accuracy | Result set identity | Run both queries; compare outputs | Headline quality metric for ad hoc analysis | Can look better than it is on small test sets |
| Result-Set Equivalence | Logical outcome identity | Set-based comparison ignoring order and formatting | Practical BI workflows in Looker, Hex, and ThoughtSpot | Floating-point or date format mismatches cause false failures |
| Schema-Linking | Mapping intent to schema | Parse SQL; verify table and column references | Diagnosing why a query targeted the wrong data | Doesn't catch wrong JOIN logic or filter errors |
| Valid Query Rate | Syntactic and runtime validity | Percentage of queries that run without errors | Identifying fundamental system or dialect failures | A valid query can still return the wrong data |
| Latency | Time from question to result | Wall-clock time from question to result | Dashboard responsiveness and interactive UX | Speed alone does not guarantee correctness |
| Token Cost | Resource efficiency | Total tokens used per successful query | Managing LLM API and warehouse spend | Optimizing for cost can degrade reasoning and accuracy |
These metrics only help if you test them on actual warehouse questions, not toy SQL examples.
How to design realistic benchmarks for your warehouse
Public benchmarks give you a place to start. Your warehouse is what tells you what will actually work.
What public benchmarks like Spider, Spider 2.0, and BIRD actually measure
Spider, Spider 2.0, and BIRD are useful for baseline comparison. But they don't show what a live warehouse asks of a system day to day: governed metric definitions, permissions, and freshness constraints that can change the right answer.
That’s why it helps to treat them as calibration tools, not proof that something is ready for production.
Use public sets for baseline comparison, then test against your own warehouse.
How to build an internal benchmark set that reflects real analytics work
The most dependable internal benchmark starts with 50–100 golden questions: a natural-language question, an approved ground-truth SQL query, and the expected result set [1]. The key is to pull questions from actual user behavior, not made-up examples.
Your set should include a mix of difficulty levels:
- Easy: single-table aggregations
- Medium: 2–3 table joins
- Hard: subqueries, window functions, or CTEs [1]
If you work in a regulated space, add edge cases too. Test temporal ambiguity, like "last month" versus "last 30 days," and check null handling for missing records [1]. Those are the kinds of details that often trip systems up in practice.
| Industry | Example benchmark questions | Rules to capture |
|---|---|---|
| SaaS | Churn by cohort, MRR by segment, CAC/LTV ratios | Active vs. trialing status, plan-specific revenue definitions |
| Finance | Gross margin trends, YTD vs. prior year | Fiscal year offsets, currency conversion, rounding precision |
| Healthcare | Patient readmission rates, denied claims by payer | HIPAA-compliant filtering, null handling for missing records |
| Operations | SKU-level conversion, AOV by region, funnel drop-off | Inventory source of truth, timezone-standardized filters |
Store these golden questions in a versioned format. JSONL or CSV both work well. Then increment the version whenever production use exposes a new edge case [1].
Once you’ve built the test set, run it in the same warehouse where your analysts do their work.
Why live warehouse testing matters more than CSV-based evaluation
CSV exports miss too much. They don’t reflect permissions, freshness, or governed metric logic in a live warehouse, and any one of those can change whether an answer is correct.
A benchmark that runs against Snowflake, BigQuery, Redshift, or Postgres is much more likely to expose the failures that matter in production. In Querio, benchmarks run against live, read-only warehouse connections, and the benchmark context stays versioned and inspectable.
A practical evaluation workflow for data teams
Once you’ve benchmarked text-to-SQL tools, the next move is execution. This is where data teams turn a test setup into a repeatable process they can score, review, and improve over time.
Step 1: Assemble gold questions, approved SQL, and business definitions
Start with your existing gold set: the question, the approved SQL, and the expected result set. Tag each item by difficulty, query type, and the business rule it checks.
The hard part is usually the implicit business rules. If those rules don’t make it into the gold set, your eval can miss the failures that hurt the most. And one more thing: a single question can often have more than one valid SQL shape. So your eval needs to accept equivalent answers, not just one exact query pattern.
Store the gold set in version control.
Once the gold set is ready, run every question through the same scoring pipeline.
Step 2: Run, log, and score every query the same way
Run each question, capture the generated SQL, execute it in the warehouse with the same permissions and semantic definitions used in production (often managed via a context-aware semantic layer), and log the result set, runtime, and token count [1]. Putting this into a CI/CD pipeline such as GitHub Actions can help teams catch regressions early [1].
For numeric results, allow a small tolerance of ±1% so floating-point differences don’t turn into false failures [1]. When more than one SQL shape is valid, use human review for the gray-area cases.
Set pass/fail thresholds before running the benchmark. For example, result correctness should be at least 90% and latency should be 5 seconds or less [1].
Those logs then give you a clean way to sort failures and decide what deserves attention first.
Step 3: Review errors and decide what to fix
Group failures by type: bad schema link, wrong join, invalid SQL, permission issue, slow query, or metric-definition drift [1]. After you fix an issue, add it to the gold set as a regression test [1].
How to interpret scores and set the right success criteria
Once you have benchmark results, the next step is figuring out which score actually shows a system is ready for your warehouse. Start with result correctness as the main metric. Then read it alongside execution accuracy, latency, and governance.
That matters because the same score can mean very different things in practice. A 92% score might be fine for ad hoc analysis, but a bad fit for regulated reporting.
Which metrics matter most for ad hoc analysis, self-serve BI, and regulated reporting
Different BI jobs need different pass/fail rules.
| Use Case | Primary Metric | Secondary Metric | Governance Requirement | Pass/Fail Threshold |
|---|---|---|---|---|
| Ad hoc analyst exploration | Execution accuracy | Latency | Medium | Execution accuracy ≥ 90%; latency ≤ 5 seconds [1] |
| Self-serve BI / dashboards | Result correctness | Latency | High | Result correctness ≥ 90%; latency ≤ 5 seconds; permissions enforced [1] |
| Regulated reporting | Result correctness | Exact match | Critical | Result correctness = 100%; permissions enforced; exact match supports auditability [1] |
Complexity-adjusted thresholds may be tighter for simple queries and looser for joins/window functions.
This is the key split: some tools can run queries, but that doesn't mean they're ready for production BI. For ad hoc work, teams can often accept a bit more variance. For dashboards and self-serve BI, correctness and permission controls matter much more. For regulated reporting, there's no wiggle room. You need 100% result correctness, enforced permissions, and exact-match output that stands up to audit checks [1].
How to read benchmark scores without overestimating production readiness
Public benchmark scores are useful, but they should be treated as directional. They can point you in the right direction, not make the decision for you.
You still need to test against your warehouse, your business rules, and your cost profile. For example, a system may post strong execution accuracy and still fall short if it shows 3.4x cost variance on Google BigQuery [2]. That's not production-ready.
Use the full scorecard. No single metric proves readiness.
The scorecard above helps you decide whether a system fits ad hoc analysis, self-serve BI, or regulated reporting. The FAQ below gets into the edge cases teams usually run into when scoring text-to-SQL.