Business Intelligence
The data stack for startups that want warehouse-native BI without the enterprise price tag
Build a lean, real-time BI stack that queries your cloud warehouse directly with dbt and lightweight tools to cut costs.
Startups need data solutions that are simple, efficient, and affordable - not the hefty, complex systems designed for big corporations. A warehouse-native BI stack offers a smarter alternative by connecting directly to cloud warehouses like Snowflake or BigQuery. This eliminates duplicate storage, reduces costs, and ensures real-time insights. Here’s the key takeaway: you can build a scalable data stack for as little as $250/month, instead of spending $9,500–$14,000/month.
Key Points:
What is warehouse-native BI? BI tools query data directly from your warehouse, avoiding extra storage or outdated reports.
Why it works for startups: Costs are tied to warehouse compute, not per-seat fees or extra systems.
Core layers of the stack: Ingestion, warehouse, transformation, semantic layer, BI/visualization, and access control.
Cost-saving tips: Use lightweight tools like MotherDuck, dbt, and Querio to minimize expenses while maintaining flexibility.
This approach keeps your data centralized, simplifies setup, and provides live insights. The result? A lean, cost-effective BI stack that grows with your startup.
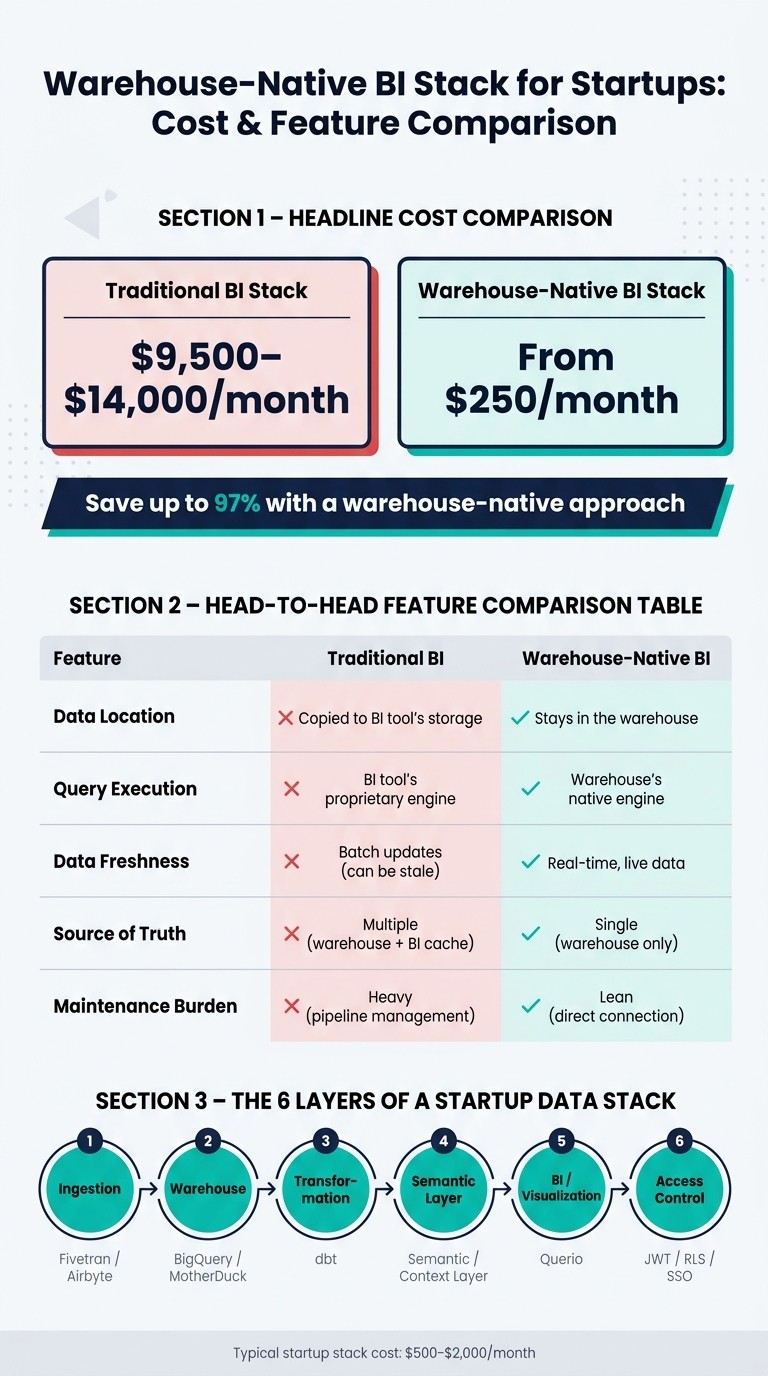
Startup BI Stack: Warehouse-Native vs Traditional – Cost & Feature Breakdown
How Startups Should Build Their Data Stack in 2026
What Warehouse-Native BI Actually Means
Warehouse-native BI refers to an analytics tool that directly queries data within your data warehouse - platforms like Snowflake, BigQuery, or Databricks. There’s no need for a separate analytics database, storage layer, or syncing pipeline. This direct connection eliminates duplicate data, outdated reports, and unnecessary costs. Traditional BI tools, on the other hand, would extract data from the warehouse, load it into their own storage, and run queries there. For many startups, that older approach is no longer practical or affordable [1].
How Warehouse-Native BI Works
Here’s the flow: source systems feed raw data into the warehouse, a transformation tool (like dbt) cleans and organizes it, and the BI tool queries those models directly. Every chart, report, and filter pulls live data straight from the warehouse [1].
The magic lies in a process called query pushdown. When you apply a filter or run a calculation in your BI tool, the query logic is passed down to the warehouse for execution. This means the heavy computational work happens in the warehouse, not in the BI tool itself. As a result, the BI layer stays lightweight while the warehouse does the hard work. This setup ensures accurate, real-time insights - something startups rely on to make informed decisions [1].
Why Startups Should Use Warehouse-Native BI
One of the biggest perks of warehouse-native BI is maintaining a single source of truth. Traditional BI tools often split data between the warehouse and the tool’s internal cache, which can lead to inconsistencies. By keeping all data centralized in the warehouse, those discrepancies are eliminated.
Another key advantage is cost efficiency. Extract-based BI systems add expenses for storage, compute, and ETL processes. With warehouse-native BI, costs are centralized around warehouse compute. You only pay for the queries you run, not for maintaining an extra system [1]. For startups operating on tight budgets, this shift can make a big difference.
Feature | Traditional BI | Warehouse-Native BI |
|---|---|---|
Data Location | Copied to BI tool's storage | Stays in the warehouse |
Query Execution | BI tool's proprietary engine | Warehouse's native engine |
Data Freshness | Batch updates (can be stale) | Real-time, live data |
Source of Truth | Multiple (warehouse + BI cache) | Single (warehouse only) |
Maintenance Burden | Heavy (pipeline management) | Lean (direct connection) |
For small teams without a dedicated data engineer, this approach is a game-changer. It simplifies operations and reduces costs significantly.
"If your analytics solution needs a data engineer to function, it's not really a solution - it's a project." - Definite.app [3]
Next, we’ll explore the essential layers of the modern analytics stack.
The Key Layers of a Startup Data Stack
If you're aiming to set up a cost-effective and scalable warehouse-native BI system, understanding the layers of your data stack is essential. A warehouse-native BI setup isn't a single tool - it’s a combination of interconnected layers, each with a specific role. Knowing what each layer does can help you avoid committing to rigid, expensive systems too early.
The Six Layers of a Data Stack
In a modern data stack, six key layers work together to transform raw data from your apps and services into meaningful insights.
Layer | Purpose | Example Tools |
|---|---|---|
Ingestion | Transfers data from SaaS tools and databases into your warehouse | |
Warehouse | Stores and processes your data | BigQuery, Snowflake, MotherDuck |
Transformation | Converts raw data into structured, usable formats | dbt |
Semantic Layer | Standardizes metrics and business logic across your organization | Querio Context Layer |
BI / Visualization | Produces dashboards, reports, and supports self-serve data exploration | Querio |
Access Control | Manages data permissions and visibility | JWT, Row-Level Security (RLS), SSO |
Each layer contributes to a streamlined, cost-efficient analytics setup.
The transformation layer is particularly critical. This is where raw data is cleaned and organized into consistent, usable tables. Tools like dbt allow you to write SQL transformations and manage them in GitHub, ensuring they can be reused across your stack. Companies using transformation tools like dbt have seen metric discrepancies drop by as much as 60% [2].
The semantic layer, often overlooked by early-stage teams, plays a crucial role in avoiding "metric debt." By defining key metrics - like "Monthly Recurring Revenue" or "active user" - once and applying those definitions universally, you ensure everyone is aligned [3].
"Data culture does not mean building a data warehouse on day one. It means agreeing on which metrics matter [and] defining them consistently." - Okun Data Team [5]
Balancing Simplicity and Scale
Understanding the purpose of each layer is just the first step. The real challenge lies in balancing simplicity with scalability. Not every layer needs to be fully developed from the start. For example, it's worth investing in proper ingestion and warehouse setups early on - rebuilding data pipelines later can be both expensive and time-consuming. On the other hand, your BI and semantic layers can start small and evolve as your needs grow.
For pre-revenue or seed-stage startups, the focus should be on actionable insights rather than elaborate infrastructure. Tracking a few key metrics from the beginning can make a big difference. In fact, founders who monitor core metrics from the start are 40% more likely to pivot effectively when needed [2].
As your business scales toward Series A, consider lightweight solutions like BigQuery (which often costs $0–$50/month at low volumes) [6] and dbt (around $100/month for a developer license) [6]. A complete data stack for most startups typically runs between $500 and $2,000/month [7]. This layered approach ensures your analytics remain powerful without breaking the bank.
Picking the Right Tools for Each Layer
Now that you’ve got a handle on what each layer does, it’s time to figure out which tools make the most sense for your setup. The key is to build a stack that works for your needs today without creating unnecessary complexity.
How to Choose a Data Warehouse
For startups, picking the right data warehouse boils down to four major factors: cost model, scalability, governance, and operational overhead. A bad choice can lead to sluggish dashboards, surprise bills, and wasted engineering time. Every decision here directly impacts how efficiently your team can operate.
Feature | Snowflake | BigQuery | ||
|---|---|---|---|---|
Cost Model | Credits per warehouse-second ($2.00–$4.00/credit) [8] | $6.25/TB scanned or slot-hours [8] | ~$0.326/hr per node or $0.375/RPU-hour serverless [8] | Often 10–50x cheaper for filter-heavy loads [8] |
Scalability | Multi-cluster auto-scale; strong concurrency [8] | Truly serverless; scales to shared slot pool [8] | Capped at 50 concurrent queries per cluster [8] | High performance for sub-TB workloads [8] |
Governance | Mature role-based access controls [4] | Integrated with GCP IAM and Analytics Hub [8] | Tight AWS IAM and Lake Formation integration [8] | Less mature enterprise governance [4] |
Best For | Mixed BI + ELT at scale [8] | Spiky analytics; GCP-first teams [8] | AWS-native BI with reserved capacity [8] | Sub-TB filter-heavy dashboards [8] |
When deciding, choose a warehouse that aligns with both your current data size and your future growth plans. Don’t over-engineer early on. If your data fits within gigabytes or a few terabytes, a lightweight option like MotherDuck (starting at around $125/month) offers simplicity with almost no operational overhead [3][4]. Larger-scale tools like Snowflake or BigQuery are better suited for when your data volume or concurrency needs expand [4].
"The wrong choice can lock a team into high costs, engineering bottlenecks and slow BI dashboards. The right choice can be a powerful accelerant for growth." - Manveer Chawla, MotherDuck [4]
Ingestion and Transformation Tools
When it comes to data ingestion, the main tradeoff is managed convenience versus cost. Tools like Fivetran offer ease of use with plug-and-play functionality, though they come with a price tag of $300–$1,000 per month for small to medium business volumes [7]. On the other hand, Airbyte’s open-source version is free to use but requires your team to handle hosting and configuration [7].
Feature | Fivetran (Managed) | Airbyte (Open Source) |
|---|---|---|
Setup Ease | High (plug-and-play) | Moderate (requires hosting/config) |
Monthly Cost | $300–$1,000+ | $0–$200 |
Maintenance | Low (vendor managed) | High (team managed) |
Customization | Limited to vendor support | High (open-source flexibility) |
For transformations, dbt is a must-have. It allows your team to write version-controlled SQL models, reuse logic across your workflows, and keep everything auditable. If your team is technically inclined and comfortable with open-source tools, a combination of Airbyte and dbt offers a budget-friendly solution. However, if you prioritize ease of setup, Fivetran paired with dbt will help you get up and running faster [1][7].
Once your ingestion and transformation layers are in place, it’s time to focus on choosing a BI tool that makes the most of your warehouse for real-time insights.
BI and Analytics Tools
Your BI tool is the final piece of the stack, and it needs to deliver real-time analytics without adding unnecessary cost or complexity. The best tools work seamlessly with your warehouse instead of creating friction.
"A BI tool that fights the warehouse instead of leveraging it can quietly ruin a perfectly good data platform." - Preset Team [1]
Querio is designed specifically for this purpose. It connects directly to your warehouse - whether that’s Snowflake, BigQuery, Redshift, ClickHouse, MotherDuck, or PostgreSQL - using encrypted, read-only credentials. This means no data extracts, no duplication, and no outdated dashboards. Every query runs live against your warehouse, ensuring your team always works with up-to-date data.
Querio stands out for small teams because it combines AI-powered natural language querying with a centralized semantic layer. Non-technical users can ask questions in plain English and get accurate, SQL-backed answers they can inspect. Meanwhile, your data team can define metrics, joins, and business logic once in Querio’s Context Layer, ensuring consistency across ad-hoc queries, dashboards, and embedded analytics [1]. This approach helps avoid the "metric debt" problem while keeping maintenance manageable, even without a dedicated data engineering team.
How to Keep Your BI Stack Affordable as You Grow
Managing costs becomes more critical as your data stack expands. Knowing where expenses tend to pile up - and how to control them - can help you maintain an efficient and scalable BI stack.
What Drives Costs in a Data Stack
In most startups, data costs aren't evenly distributed across the stack. In fact, warehouse compute often makes up 60–80% of total data expenses once a few active dashboards are running. Storage, on the other hand, is relatively inexpensive. For instance, Snowflake charges about $23 per TB per month for compressed storage, while BigQuery costs drop to around $0.01 per GB per month for data untouched for 90 days. The real expense lies in compute.
Some common factors driving up compute costs include complex queries with multiple joins and window functions, high dashboard concurrency (many users refreshing dashboards simultaneously), and over-scheduled transformation jobs (running heavy dbt models more frequently than necessary). To keep these costs in check, you can:
Set short auto-suspend times for Snowflake virtual warehouses (1–5 minutes).
Use incremental dbt models to process only new rows.
Disable auto-refresh for dashboards that don’t need real-time updates.
Another area where costs can escalate is data ingestion, making process optimization equally important.
Ingestion costs often follow a similar trend. Tools like Fivetran charge based on Monthly Active Rows (MAR), which are the distinct rows added or changed in a month. High-volume sources, such as mobile event logs or ad impressions, can quickly push you into higher pricing tiers. To manage ingestion costs, consider these strategies:
Sync only the columns and tables that are actively queried.
Adjust sync frequency based on actual business needs (e.g., daily for reference tables, hourly only for critical sources).
Archive historical event data with high granularity to cheaper storage options like Amazon S3 when it's no longer needed for active analytics.
Scaling Analytics Without Adding More Tools
Beyond optimizing queries and ingestion, minimizing the number of tools in your stack can help reduce costs as you grow. Surprisingly, the biggest expense in a growing data stack isn’t a single software bill - it’s the overhead caused by tool sprawl. Each additional BI tool introduces extra licensing fees, creates opportunities for metric definitions to drift, and adds to the maintenance burden. For organizations with data governance for startups, streamlining tools can lead to an average 25.4% cost savings [9], as consistent definitions reduce the rework caused by conflicting dashboards.
The most effective approach is to consolidate your analytics into a single platform that handles ad-hoc analysis, dashboards, and governed metrics all in one place. This not only simplifies maintenance but also supports a centralized, cost-conscious strategy. Tools like Querio make this possible by letting your data team define joins, business terms, and KPI calculations in its Context Layer. Every query - whether it’s for a natural language question, a scheduled report, or an embedded dashboard - pulls from the same definitions and runs live against your warehouse. This approach avoids the accumulation of "metric debt" caused by inconsistent definitions, keeps your warehouse as the single source of truth, and eliminates the compute overhead of data extracts or syncs. It’s a practical way to maintain a streamlined, cost-effective data stack.
Conclusion: A Scalable BI Stack That Fits Your Budget
A well-structured BI strategy doesn’t have to be overly complicated or expensive. By focusing on a layered approach, startups can reduce complexity while getting the most value out of their data. At the core of this strategy is a live, single-source warehouse. This eliminates outdated dashboards, inconsistent metrics, and unnecessary infrastructure costs.
Start with a reliable cloud warehouse, then add only the essential tools for data ingestion and transformation. From there, implement a BI layer that empowers teams to access and analyze data independently. Scaling your stack isn’t about piling on more tools - it’s about refining your data models, standardizing metric and semantic definitions, and broadening access to data.
Querio reflects this methodology by connecting directly to your warehouse, offering governed metric definitions and real-time query capabilities. Whether you use Snowflake, BigQuery, Redshift, or Postgres, Querio ensures live data access without creating separate BI silos, duplicating data, or generating unclear outputs.
Before introducing new tools to your stack, ask yourself these three key questions: Is the data live and reliable? Are the costs predictable? Can non-technical users find answers without relying on engineering? If the answer to any of these is no, a warehouse-native approach with Querio as your self-service layer can provide the straightforward, cost-efficient, and scalable solution your team needs.
FAQs
How do I estimate my warehouse compute costs before choosing a BI setup?
To figure out warehouse compute costs, start by looking at usage-based platforms that charge per query or per second of compute time. This approach helps you avoid paying for resources you’re not using. Think about your anticipated data volume and how often you’ll run queries to estimate your monthly costs. Many platforms offer built-in cost management tools, which can help you track usage, fine-tune performance, and keep your BI setup affordable as your startup scales.
When should a startup add a semantic layer instead of relying on raw SQL?
Startups should consider adding a semantic layer when they need to establish consistent metrics, unify business terminology, and create reliable data definitions. This becomes especially important as data grows more complex and teams depend on shared, trustworthy insights to avoid discrepancies and ensure accurate analysis.
What’s the fastest way to secure dashboards with row-level access and SSO?
The quickest method to get started is by linking Querio directly to your data warehouse using secure, read-only credentials. Querio integrates seamlessly with existing security measures, such as row-level security and column masking, to protect your data. Plus, with its SOC 2 Type II compliance, you can count on enterprise-level safeguards. This setup is both efficient and secure.
Related Blog Posts