Business Intelligence
What a data-driven culture actually looks like at a 50-person startup
Small startups can become data-driven with one metric per team, weekly reviews, leader buy‑in, and governed self‑service analytics.
In any 50-person startup, building a data-driven culture is less about expensive tools and more about embedding data into everyday decisions. This means prioritizing evidence over opinions, using simple yet effective tools, and fostering alignment across teams. Here's the essence:
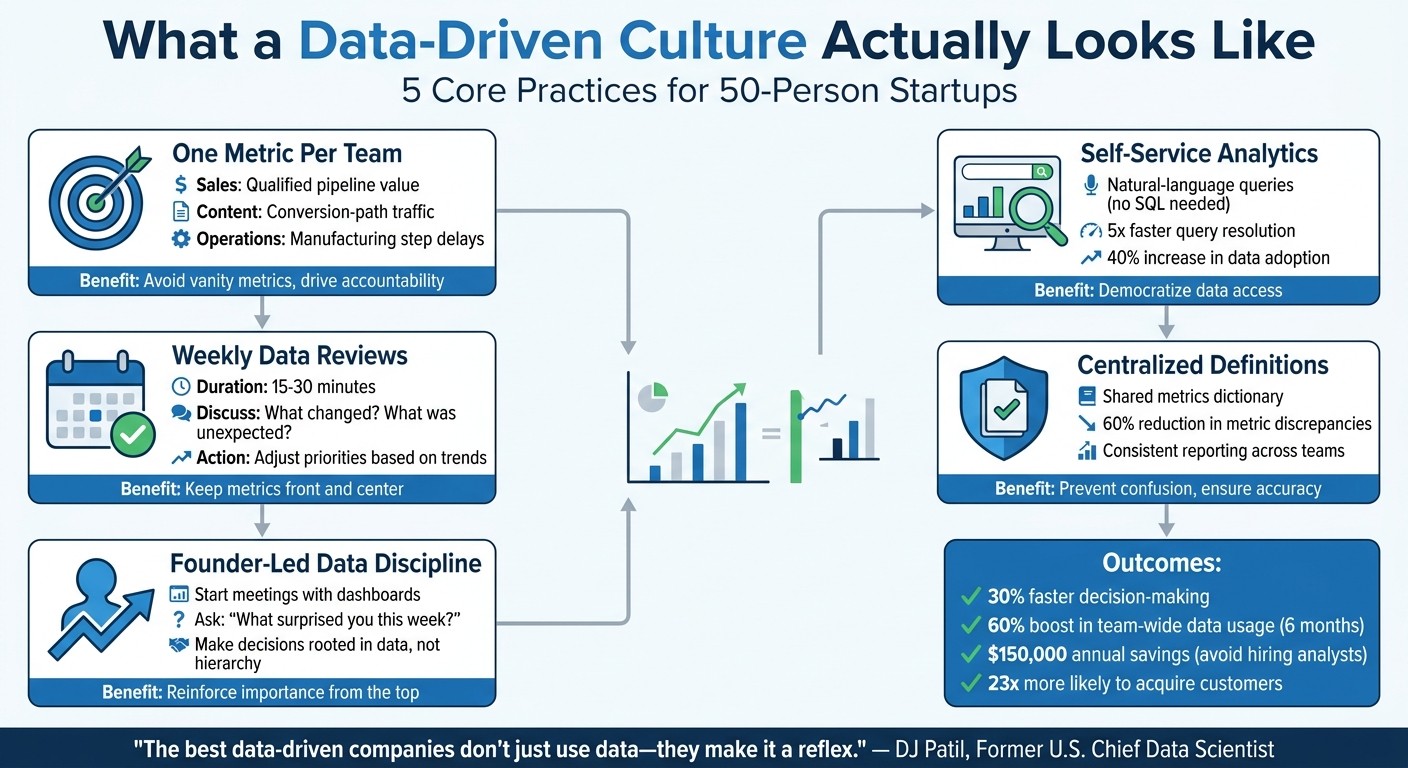
Focus on One Metric Per Team: Each team tracks a single, clearly defined metric tied to company goals, avoiding distractions from vanity metrics.
Weekly Data Reviews: Short, consistent meetings to review metrics, identify trends, and adjust priorities.
Leadership Sets the Example: Founders and leaders must actively use data in decision-making to reinforce its importance.
Accessible Tools for Everyone: Tools like Querio enable teams to access and analyze data without technical expertise, using features like natural-language queries and shared metric definitions.
Governance Matters: Centralized definitions and oversight prevent confusion and ensure consistency across teams.
Startups using these practices often see faster decision-making, better alignment, and significant time savings - without needing a large analytics team. With the right tools and leadership commitment, even small teams can make data the foundation of their growth.
5 Core Practices for Building a Data-Driven Culture in Startups
How to Build a Data-Driven Culture (and Why It Matters) -- Happy Hour Analytics 🥃
Core Practices That Define a Data-Driven Startup
Embedding data into the fabric of a startup requires establishing a few key practices that ensure teams rely on data in their daily operations.
One Metric Per Team: Driving Focus and Accountability
Every team should center its efforts around one key metric directly aligned with the company’s broader objectives. For example, sales might track qualified pipeline value, content teams could monitor conversion-path traffic, and operations might focus on reducing delays in manufacturing steps. This approach keeps teams laser-focused and avoids the distraction of vanity metrics. To maintain clarity across the organization, a business metrics planner - stored in tools like Notion or Confluence - can define terms like MRR, CAC, or churn rate consistently. This shared understanding eliminates confusion and ensures everyone is on the same page. By focusing on a single metric, teams naturally engage in regular reviews to monitor progress and adjust as needed.
Weekly Data Reviews: Keeping Metrics Front and Center
Weekly data reviews are a simple yet powerful way to ensure data remains at the heart of decision-making. These short, 15–30 minute meetings allow teams to examine their primary metric, spot trends, and realign priorities. The structure is straightforward: each week, teams discuss what changed, what was unexpected, and what actions to take next. This consistent rhythm prevents data from becoming an afterthought or a monthly task. Instead, it turns metrics into an ongoing conversation that actively influences daily decisions. Regular reviews also create opportunities for leadership to reinforce the importance of data-driven thinking.
Founder-Led Data Discipline: Setting the Tone from the Top
Leaders must lead by example when it comes to data. A founder who makes major decisions based on instinct while insisting others rely on data sends a mixed message that undermines the culture. Founders should visibly embrace data usage - starting leadership meetings by pulling up dashboards using BI tools for startups and asking, “What surprised you this week?” demonstrates that decisions are rooted in data, not hierarchy.
A great example of this mindset comes from DBS Bank, where CEO Piyush Gupta publicly backed a staff member after a failed experiment, despite regulatory pressure to take punitive action. Gupta remarked:
Not only am I not going to punish the person, I'm going to give them an award for at least having tried [2].
How Querio Enables Self-Service Analytics and Data Governance
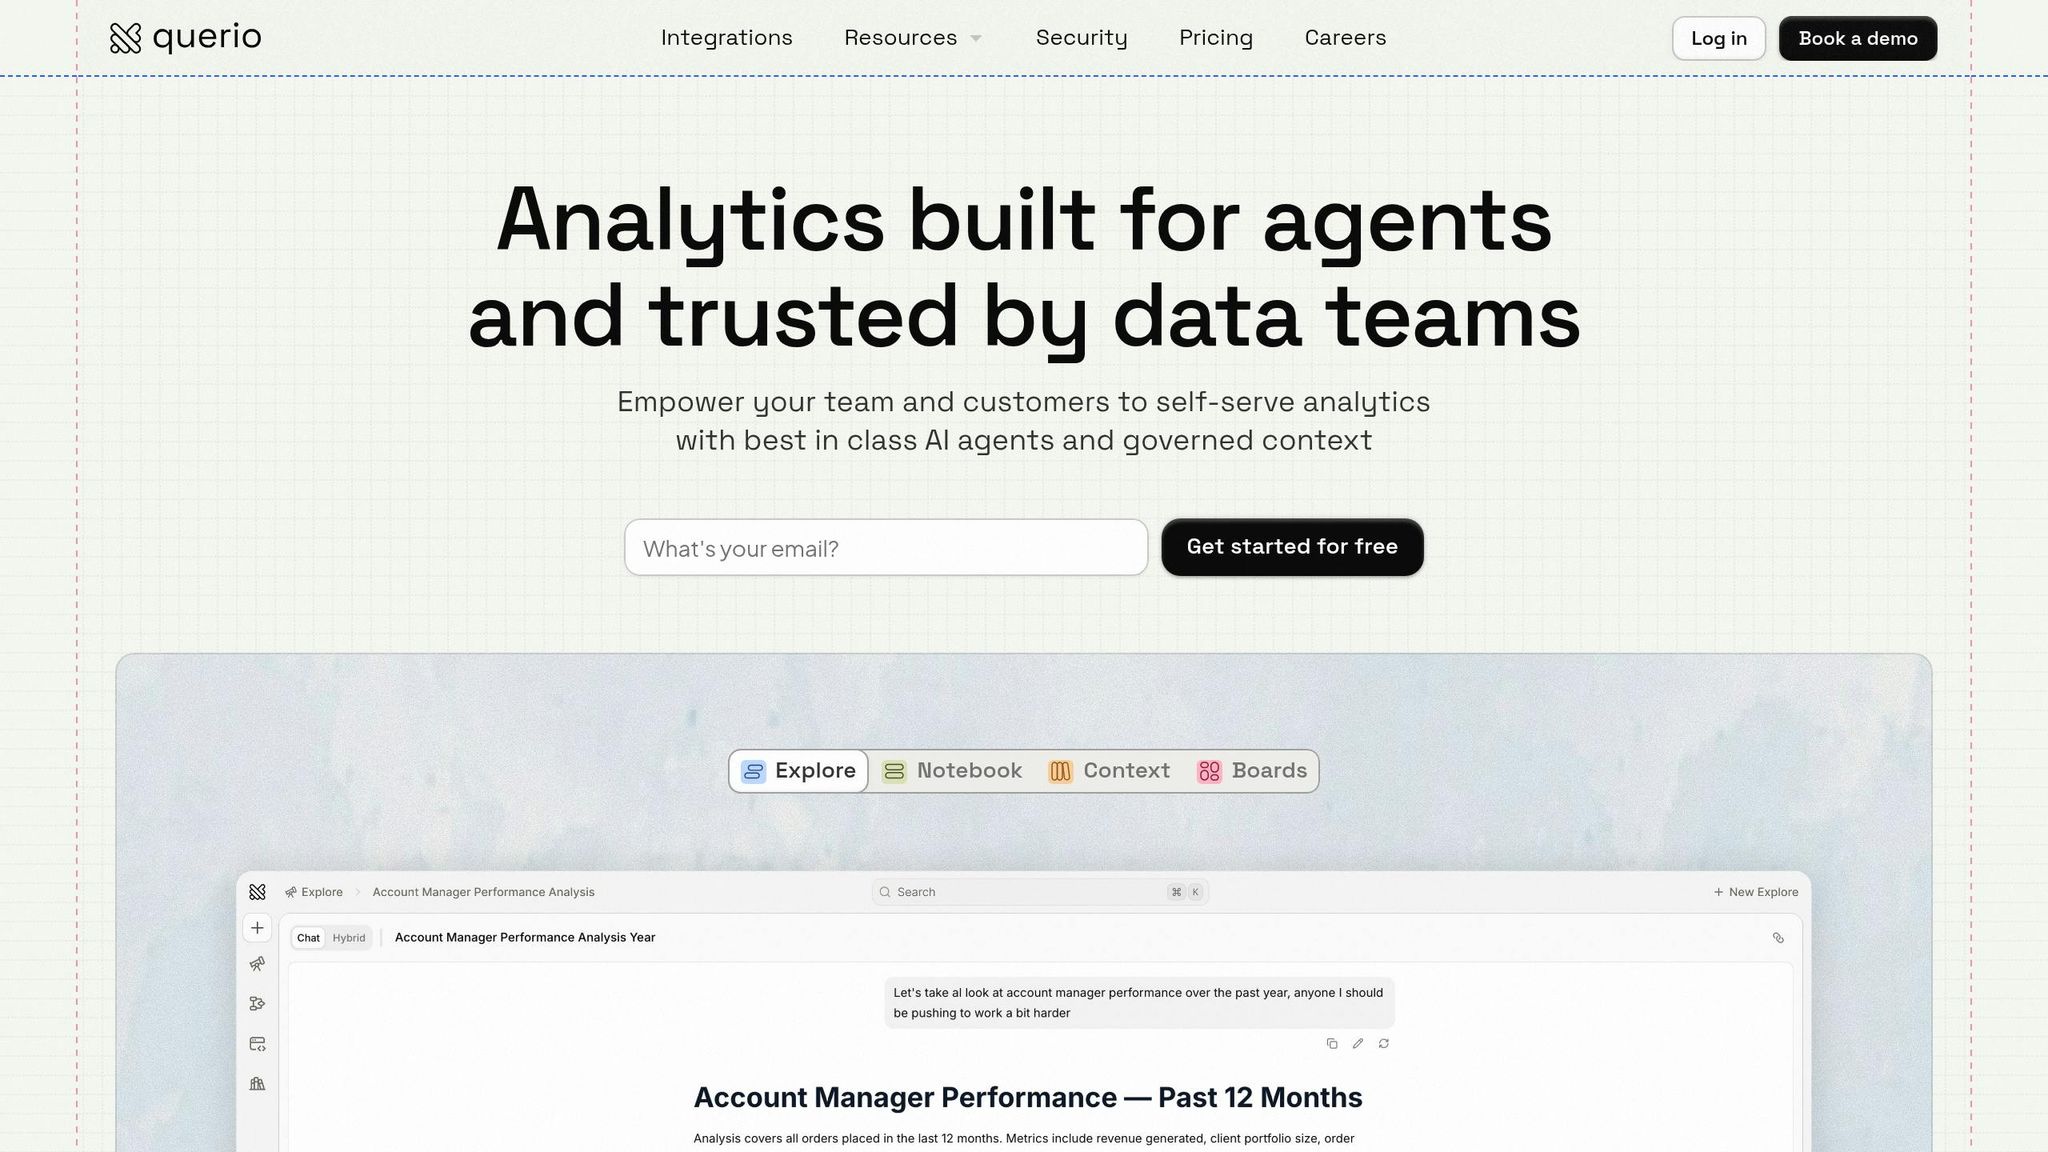
Creating a data-driven environment requires tools that strike a balance between accessibility and precision. Without proper oversight, teams risk inconsistent metrics and diminished trust in their data. Querio addresses this challenge by blending AI-driven self-service capabilities with strong governance features, ensuring everyone remains on the same page. Key tools like the Shared Context Layer, natural-language queries, and inspectable notebooks illustrate how Querio achieves this harmony.
Shared Context Layer: Ensuring Consistent Metric Definitions
At the heart of Querio's approach lies the Shared Context Layer, which acts as the definitive source for metrics, dimensions, and business logic. This eliminates discrepancies caused by differing interpretations of key metrics. For example, if your startup defines "qualified pipeline value" as leads with over 50% close probability and deal sizes above $10,000, this definition is applied universally - whether through natural-language questions or custom dashboards.
Consider a 50-person SaaS startup where sales and finance teams clashed over MRR calculations - sales only included monthly plans, while finance prorated annual contracts. This led to a 15% discrepancy that disrupted forecasting meetings. By centralizing definitions through Querio's Shared Context Layer (using total normalized monthly recurring revenue from all contracts), the team aligned their reporting in under a week, improved forecast accuracy by 25%, and saved 10 hours per week previously spent reconciling spreadsheets [3].
Natural-Language Queries: Simplifying Data Access for Everyone
Querio enables users to ask questions in plain English, making data accessible without requiring SQL skills. For instance, a content marketer can type, "What's the conversion rate from content traffic to qualified leads this quarter?" and quickly generate governed visualizations. This approach broadens data access while maintaining accuracy, as the AI converts these questions into SQL while adhering to predefined business rules.
Startups leveraging natural-language queries report resolving queries five times faster (shifting from hours to minutes) and achieving a 40% increase in data adoption among non-technical staff. In one fintech startup, the content team identified a 22% traffic drop caused by SEO changes using Querio. They then optimized their strategies and boosted conversions by 18% in just one month - all without needing an analyst.
Inspectable SQL and Python Notebooks: Promoting Transparency and Scalability
Querio generates inspectable and editable SQL and Python notebooks for every natural-language query. Analysts can review the logic, tweak calculations, or expand queries - for example, by adding forecasts for churn prediction. This transparency fosters trust, as anyone can audit the outputs, and it enables the creation of reusable templates to scale expertise across teams.
For instance, an operations analyst at a manufacturing startup used Querio to analyze "delays in step 3 by machine." By reviewing the SQL and extending it in Python, they built a time-series model to predict delays. The resulting notebook was shared across the team, reducing step delays by 35% through proactive alerts and saving 20 engineer hours monthly by streamlining workflows for similar processes.
How Different Teams Use Data to Drive Results
Building a data-driven culture isn't just about having fancy dashboards. It's about empowering teams to make smarter decisions every day using analytics. In a 50-person startup, each department faces its own challenges, which means data strategies need to be customized. Here's how different teams use tailored analytics to achieve faster and more reliable outcomes.
Sales Team: Tracking Qualified Pipeline Value
For sales teams, predictable revenue forecasting is crucial. Relying on gut instincts can lead to missed targets, so it's vital to adopt a more structured approach. One way to do this is by assigning numerical values to prospect actions - essentially turning behaviors into data points. For example, Zendesk introduced a point-based system in March 2022 to score prospect behaviors like competitor mentions on a scale of 0 to 2. By feeding these standardized inputs into predictive models, they achieved revenue forecasts with a margin of error as low as 2% [5].
This approach isn't just about accuracy; it's transformative. Companies using similar methods are 23 times more likely to acquire customers and 19 times more likely to stay profitable [4]. On the content side, teams can also benefit by connecting user activity directly to revenue metrics, refining strategies for better outcomes.
Content Team: Optimizing Conversion-Path Traffic
Content teams often face a tough challenge - proving how their work impacts revenue. One solution is to analyze where users drop off in the conversion funnel. Using a Metrics Tree framework, teams can link website conversions directly to monthly recurring revenue (MRR) [7]. This ensures consistency across departments by standardizing definitions for terms like "Active User" or "Conversion", avoiding unnecessary conflicts.
Investing in business intelligence tools can make a big difference here. These tools typically offer an average ROI of 112% and pay for themselves in about 1.6 years [1]. For example, by using natural-language query tools, some content teams have cut reporting cycles from three weeks to just 30 minutes. This shift allows them to focus more on decision-making rather than spending time gathering data [6].
Operations Team: Reducing Manufacturing Step Delays
Operations teams rely on real-time data to remove bottlenecks and improve efficiency. One effective strategy is integrating analytics platforms directly into production systems. For instance, in May 2024, Lemonade Fashion (formerly Pipp), a 20–50 person social-commerce platform, adopted Querio to tackle operational delays. By connecting Querio to their production stack, they reduced time-to-answer from three weeks to just 30 minutes and expanded direct data access from 3 employees to 20 [6].
"We had 40 people pinging engineering every time they needed a number. By the time we got back to them, the decision was already made - or skipped."
Mohamad Ali Baydoun, CTO, Pipp [6]
When operations teams have direct access to real-time data, they can act faster and make better decisions. Self-service analytics tools shift them from being reactive to proactive, cutting delays and lowering costs in the process.
Scaling Analytics Without Losing Control
When your company grows to around 10–50 employees, relying on manual spreadsheet reporting becomes a major bottleneck. Teams can end up spending over three or four hours every week just reconciling numbers, only to face conflicting data. At this point, transitioning to structured self-service analytics isn’t just a good idea - it’s absolutely necessary to keep operations running smoothly.
To manage this shift effectively, consider the Self-Service Pyramid, a three-tier system designed to reduce the load on your analysts:
Level 1: Pre-built dashboards handle 80% of recurring questions, giving teams quick access to the data they need.
Level 2: Parameterized explorations, like filtering by date range or region, address 15% of more specific queries.
Level 3: Custom SQL analysis is reserved for the remaining 5% of complex, one-off questions.
Without this structure, analysts can get bogged down answering repetitive queries, leaving them with little time to focus on deeper insights.
Governance: Consistency, Not Gatekeeping
Good governance doesn’t mean restricting access to data - it means ensuring consistency. A centralized metrics dictionary can be your secret weapon here. Define key terms like MRR (Monthly Recurring Revenue), CAC (Customer Acquisition Cost), and Active User just once, and make sure everyone uses the same definitions. This eliminates those frustrating 20-minute debates over whose numbers are accurate.
Organizations that adopt frameworks like dbt have reported a 60% reduction in metric discrepancies [8]. Tools like Querio’s Shared Context Layer take this a step further by storing these definitions in one place and applying them automatically across dashboards, notebooks, and even AI-generated answers. This unified approach ensures that data is consistent across the board, creating a strong foundation for informed decision-making.
Leadership Drives a Data-First Culture
The way leadership approaches data sets the tone for the entire company. If executives rely on gut instincts, the rest of the organization will follow suit. Instead, require a one-page data brief for all major decisions - whether it’s about hiring, budgeting, or product changes. This simple practice reinforces the idea that data should guide decisions, not intuition.
David Waller, Partner and Head of Data Science at Oliver Wyman Labs, emphasizes:
The biggest obstacles to creating data-based businesses aren't technical; they're cultural.
Automating for Accuracy and Efficiency
Startups that actively monitor data quality - checking for things like freshness, null rates, and row counts - spend 65% less time putting out fires [8]. Automating your workflows with ELT pipelines, syncing data from sources like Postgres or Snowflake on a set schedule, can make a huge difference.
Finally, implement Role-Based Access Control (RBAC) to strike the right balance between security and accessibility. This ensures that sensitive data stays protected while still being available to those who need it most.
Conclusion
Building a data-driven culture in a 50-person startup doesn't require a massive analytics team. Instead, it hinges on strong leadership, disciplined routines, and effective tools. Founder-led weekly reviews play a pivotal role, setting an example for the entire organization. This approach has been shown to boost team-wide data usage by 60% in just six months while significantly accelerating decision-making.
Key practices - like assigning each team a single metric, holding weekly data reviews, and maintaining consistent metric definitions through a shared context layer - form the backbone of scalable growth. These steps can lead to 30% faster decision-making [9].
Querio makes scaling analytics possible without adding headcount. Its self-service tools, such as natural-language queries, governed metric definitions, and inspectable notebooks, allow startups to expand their analytics capabilities efficiently. For instance, one 50-person company saved $150,000 annually by avoiding the need to hire a sixth data analyst, thanks to Querio's tools [3].
The roadmap is simple: start by assigning one metric per team, use plain-English queries to track progress, and review these metrics weekly. Begin with a single team, demonstrate the impact, and scale the process company-wide over three months. As DJ Patil, former U.S. Chief Data Scientist, famously said:
The best data-driven companies don't just use data - they make it a reflex.
That reflex comes from consistent practice and the right infrastructure. It's what distinguishes startups that grow and thrive from those that falter. By embedding these principles into your operations, you can turn data into a powerful strategic advantage.
The tools are ready, the methods are proven, and the only remaining step is leadership's commitment to making data the cornerstone of every decision. Why not start today?
FAQs
How do we pick the one metric each team should own?
To select the right metric for each team, pick one that is relevant, practical, and directly connected to the team’s main goals. Focus on metrics that drive important results, like revenue growth or customer retention, while steering clear of vanity metrics that don’t add real value. Assign clear ownership for each metric and set up a governance process to ensure consistency and accuracy. This allows teams to rely on their metrics for better decision-making and accountability.
What should a 15–30 minute weekly data review agenda include?
Spending 15–30 minutes each week reviewing your data can make a big difference in driving growth and improving efficiency. Here's what to focus on during these sessions:
Key Metrics and Goals: Take a close look at your most important KPIs, such as Monthly Recurring Revenue (MRR), churn rate, or customer acquisition cost. These numbers give you a snapshot of your business health.
Performance vs. Targets: Compare your actual results to your weekly or monthly goals. Are you on track, ahead, or falling behind? This step helps you measure progress and pinpoint areas that need attention.
Opportunities and Risks: Look for trends, wins, or red flags. Are there patterns in the data that signal potential growth opportunities or areas of concern that require immediate action?
Next Steps: Use your findings to outline actionable steps. Encourage your team to collaborate and align on priorities for the week ahead.
By keeping these focus areas in mind, your weekly review becomes a powerful tool for staying proactive and ensuring your team is aligned with your goals.
How do we scale self-serve analytics without breaking metric consistency?
To effectively expand self-serve analytics while keeping metrics consistent, it's crucial to implement automated workflows and governance tools. These ensure data remains accurate and uniform across the board. By integrating features like natural language querying and automated data preparation, non-technical team members can easily access trustworthy insights without needing advanced skills.
Establishing clear data definitions, setting up access controls, and conducting regular audits are essential steps to avoid metric discrepancies over time. Additionally, strong governance measures help ensure everyone is working with the same reliable data as your analytics capabilities grow.
Related Blog Posts


