Business Intelligence
Best AI data analytics tools 2026 (for every use case)
Compare leading AI analytics platforms—features, pricing, and best use cases to find the right tool for your team.
AI analytics tools in 2026 are transforming how businesses analyze data, offering faster insights and deeper understanding without relying on traditional dashboards. These tools go beyond basic charts, using AI to investigate why metrics change, automate analysis, and provide actionable insights.
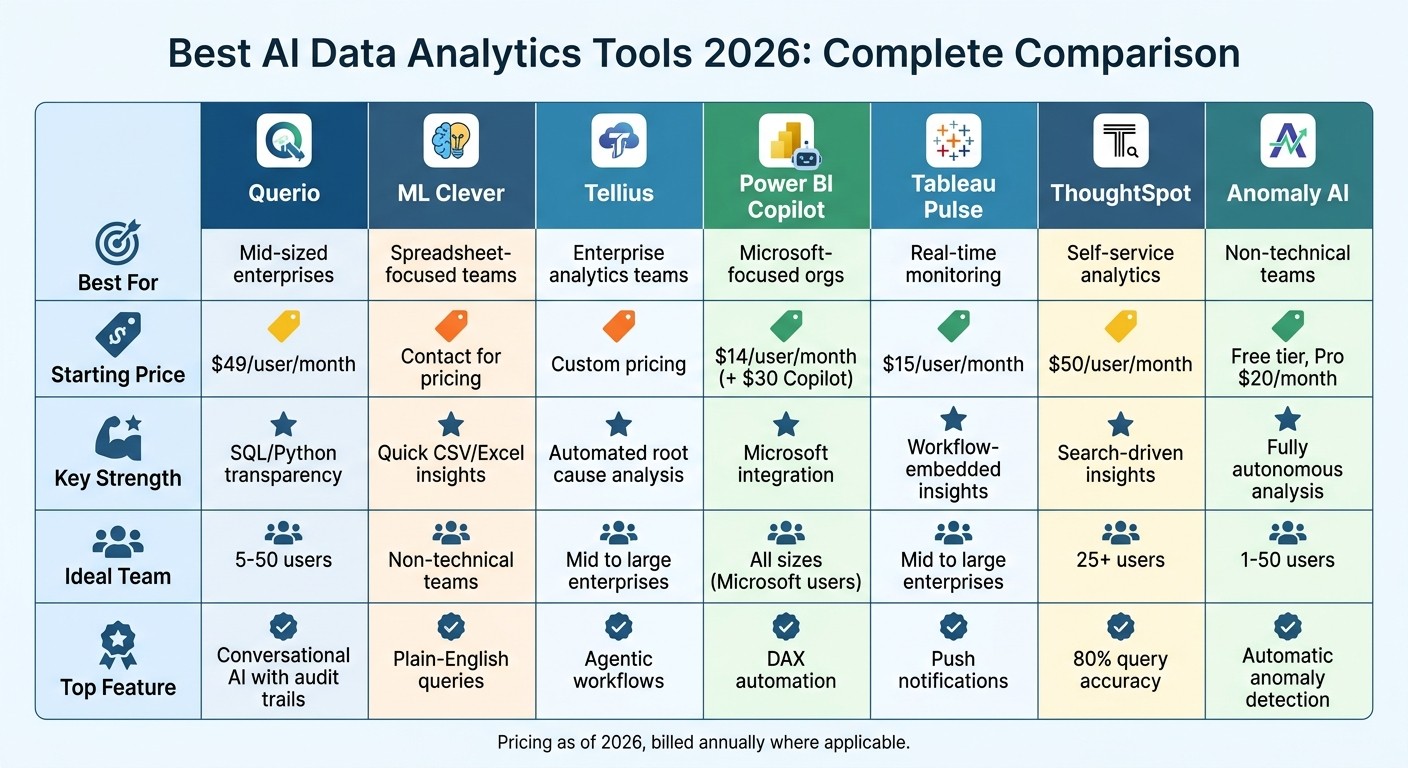
Here’s a quick look at seven leading platforms:
Querio: Combines conversational AI with SQL and Python transparency. Ideal for mid-sized enterprises using modern data warehouses. Pricing starts at $49/user/month.
ML Clever: Simplifies spreadsheet analysis for non-technical teams. Best for executives needing quick insights from ad-hoc data.
Tellius: Automates root cause analysis, popular in industries like pharma and finance. Custom pricing available.
Microsoft Power BI Copilot: Integrates seamlessly with Microsoft tools. Pricing starts at $14/user/month, with Copilot add-ons at $30/user/month.
Tableau Pulse: Pushes real-time insights directly into workflows, bypassing traditional dashboards. Starts at $15/user/month.
ThoughtSpot: Focuses on search-driven analytics for business users. Pricing starts at $50/user/month.
Anomaly AI: Fully autonomous analysis for small to mid-sized teams. Free tier available, with Pro plans starting at $20/user/month.
Quick Comparison
Tool | Best For | Starting Price (USD) | Key Features |
|---|---|---|---|
Querio | Mid-sized enterprises | $49/user/month | Conversational AI, SQL transparency, anomaly detection |
ML Clever | Spreadsheet-focused teams | Contact for pricing | Quick insights from CSV/Excel, plain-English queries |
Tellius | Enterprise analytics teams | Custom pricing | Automated root cause analysis, proactive monitoring |
Power BI Copilot | Microsoft-focused organizations | $14/user/month | DAX automation, deep Microsoft integration |
Tableau Pulse | Real-time metric monitoring | $15/user/month | Workflow-embedded insights, plain-language narratives |
ThoughtSpot | Self-service analytics for enterprises | $50/user/month | Search-driven insights, anomaly detection |
Anomaly AI | Non-technical teams | Free tier, Pro $20/month | Fully autonomous analysis, SQL transparency |
Each tool serves different needs, from top ai embedded analytics tools to automated anomaly detection. Choosing the right one depends on your team size, data complexity, and budget.
AI Data Analytics Tools 2026: Feature and Pricing Comparison
Best AI Tools Every Data Analyst Should Know in 2026
1. Querio
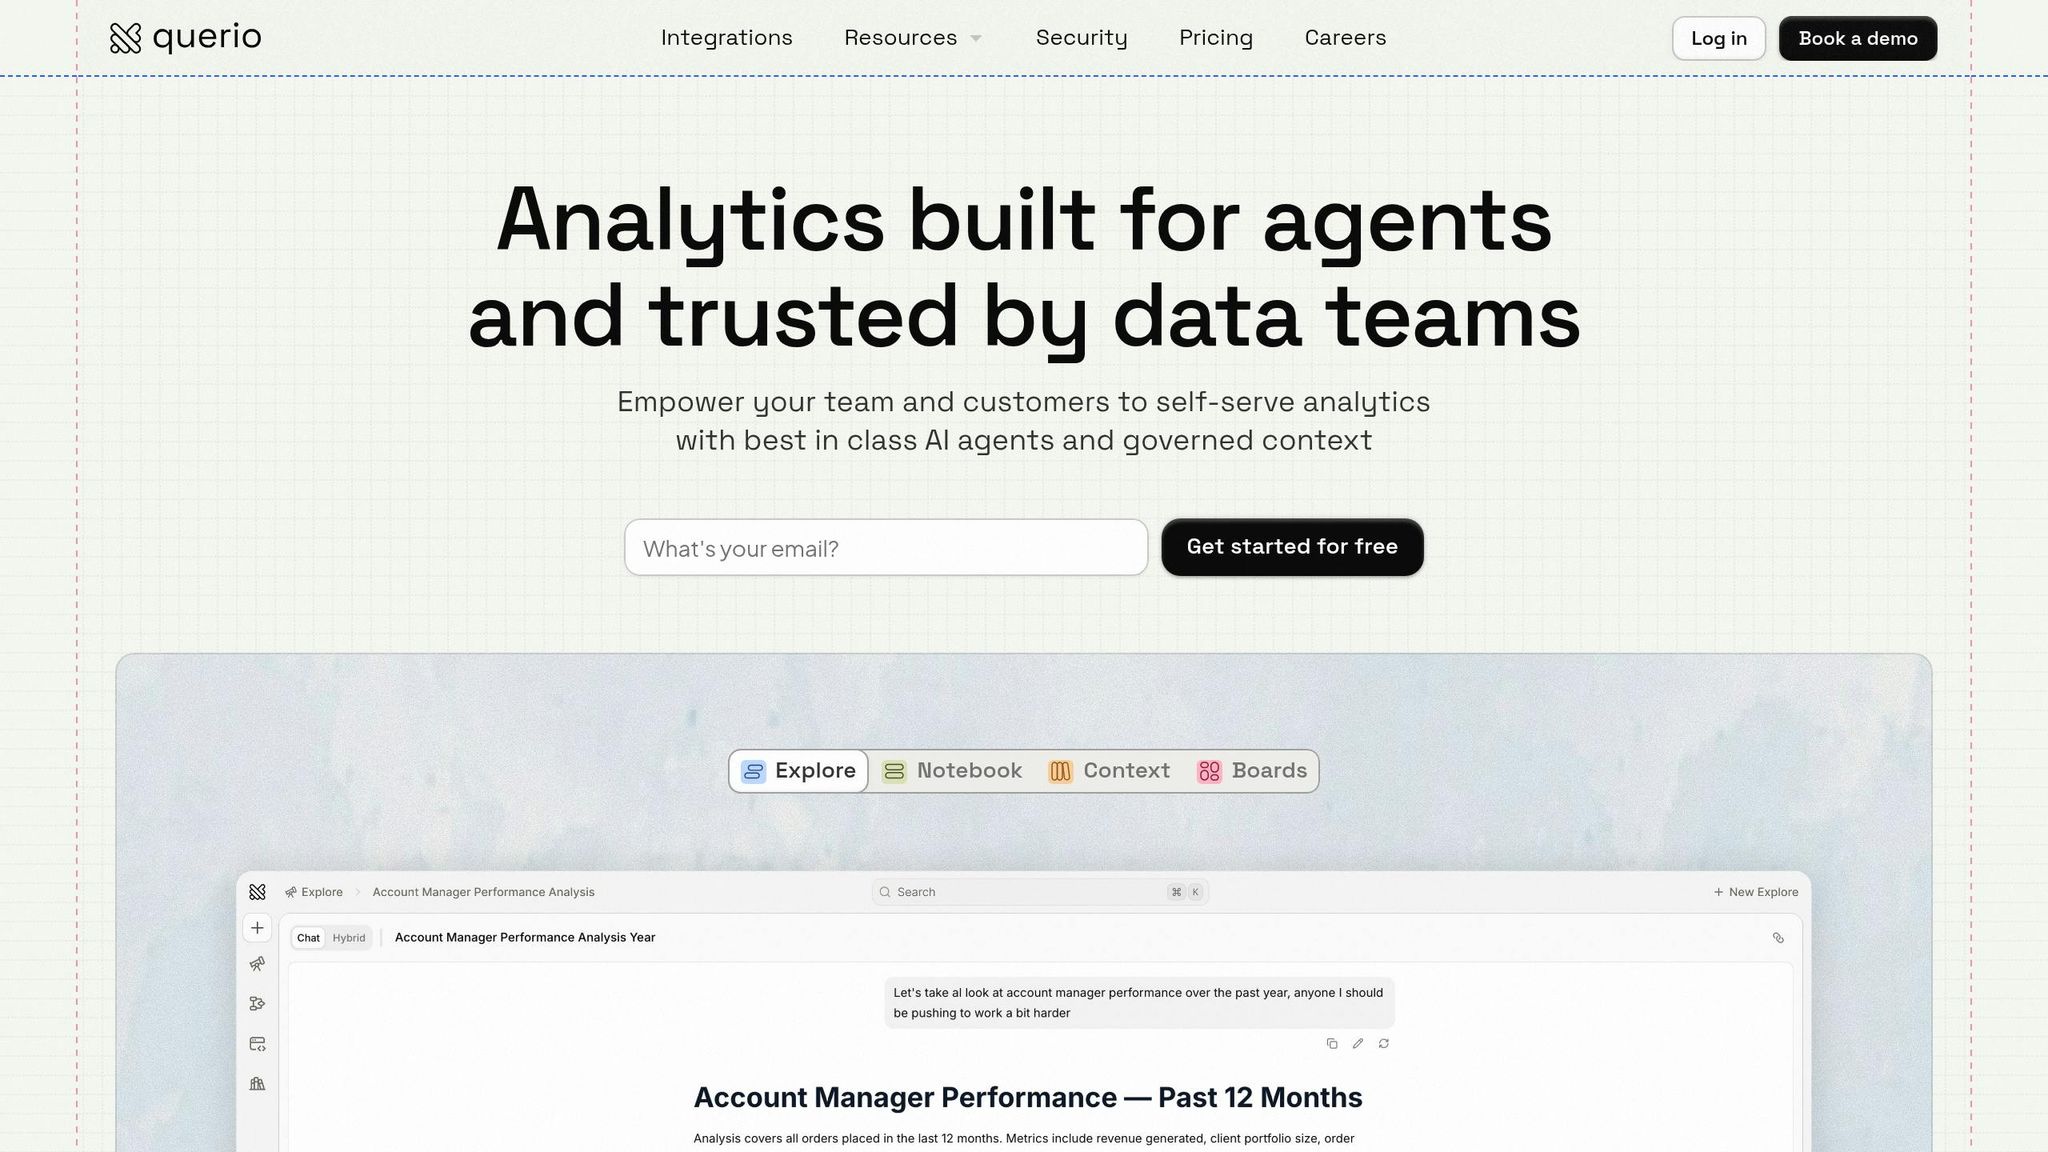
Querio is a warehouse-native AI analytics workspace that combines conversational simplicity with technical depth. Unlike standard chatbots that merely generate charts, Querio's AI agents transform plain-English questions into transparent SQL and Python code, ensuring insights are both auditable and reproducible. This "glass box" approach makes it a solid choice for teams seeking self-service analytics without compromising on governance or precision.
The platform connects directly to your existing data warehouse - like Snowflake, BigQuery, Redshift, ClickHouse, or PostgreSQL - using encrypted, read-only credentials. With no need for ETL pipelines or data duplication, users can query live data directly from their source of truth. Setup takes less than 30 minutes, and the platform includes SOC 2 Type II compliance, SSO integration, and role-based access controls. This streamlined connection supports consistent data definitions across the board.
Querio's shared context layer allows data teams to define metrics, joins, and business terms once, ensuring uniformity across ad-hoc queries, dashboards, notebooks, and external analytics. This eliminates the confusion caused by inconsistent metric definitions across departments.
Best Use Case
Querio is particularly effective for mid-sized enterprises looking to make analytics accessible to non-technical teams. A case study from 2025 highlights its impact: a U.S. healthcare provider reduced query resolution time from two days to just 15 minutes, increased productivity by 80%, and identified $2 million in billing inefficiencies using AI-driven anomaly detection. They achieved a full return on investment within three months.
Key AI Features
Querio's AI engine boasts 95% query accuracy (as noted in G2 reviews from 2026), leveraging natural language processing to understand context and even suggest follow-up questions. Beyond simple queries, Querio detects anomalies in BI dashboards, performs root cause analysis, flags KPI drops, and investigates their causes. It also features a reactive notebook environment that lets analysts refine SQL and Python analyses while maintaining version control and shared logic. The platform’s broad compatibility with diverse data sources further enhances its utility.
Data Source Support
Querio supports over 100 connectors, including major cloud data warehouses like Snowflake, BigQuery, Redshift, ClickHouse, and Motherduck. It also integrates with relational databases (PostgreSQL, MySQL, MariaDB, MS SQL Server), CRMs (Salesforce, HubSpot), and APIs (Google Analytics, Stripe). The platform handles datasets up to 1TB and supports hybrid cloud or on-premises setups, with real-time streaming via Kafka.
Starting Price (USD)
Pricing begins at $49 per user per month (billed annually) for the Pro plan, which includes core AI querying and standard integrations. The Team plan, at $99 per user per month, offers unlimited data source connections. Enterprise pricing is custom - starting around $5,000 per month for 50+ users - and includes premium support and advanced governance features. A 14-day free trial is available, with no per-query charges.
Ideal Team Size
Querio is best suited for teams of 5–50 users - large enough to benefit from shared governance but small enough to avoid heavy IT management. According to Forrester's Q1 2026 Wave report, teams in this range see 30% faster ROI with Querio, particularly in analytics, marketing, and operations, thanks to reduced deployment time and faster insights.
2. ML Clever
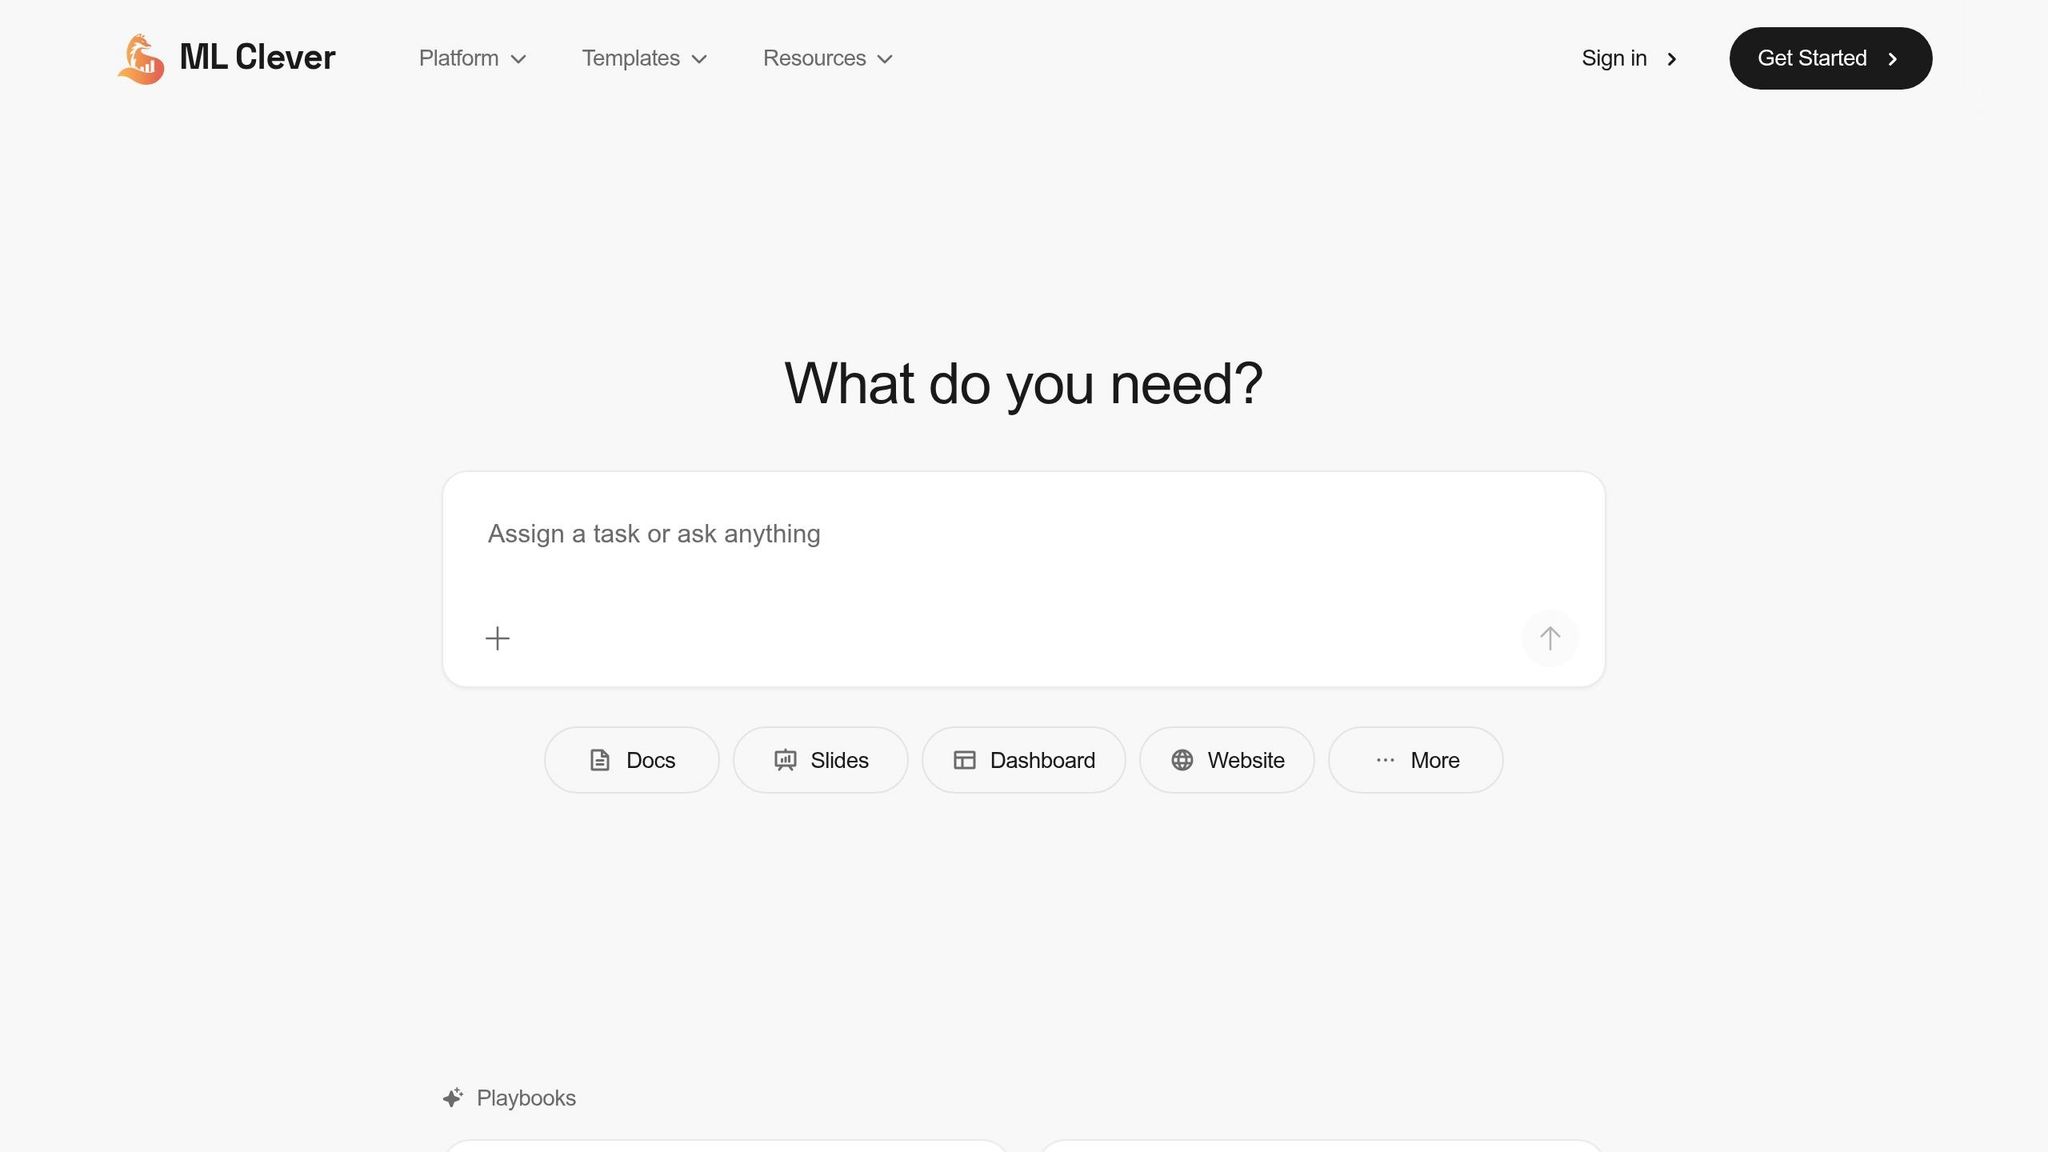
ML Clever steps into the world of AI analytics with a focus on users who rely on spreadsheet data. It's tailored for executives and business teams that need quick, presentation-ready insights drawn from ad-hoc data.
This platform is designed for non-technical users who need to transform spreadsheets into actionable insights fast. With ML Clever, you can upload CSV, Excel, or Parquet files and get answers in plain English - no SQL knowledge required. Its text-to-SQL engine operates seamlessly in the background, converting your questions into queries and revealing the logic behind the results.
Best Use Case
ML Clever shines in self-service analysis for executives and business teams handling spreadsheet data. Whether it's for investigating KPIs, answering executive-level questions, or making confident decisions based on raw data in just minutes, this tool is built to deliver. It's especially helpful for teams without in-house data science resources but still in need of reliable insights.
Key AI Features
One standout aspect of ML Clever is its transparency. It clearly shows the reasoning behind each result, giving users confidence in the outputs. The platform also generates charts with written explanations and "so what" summaries, making insights easy to understand. Users can dive deeper with follow-up questions or suggested prompts for iterative exploration. As noted by the ML Clever Research Team:
ML Clever is the most complete AI data analysis tool in 2026. It balances speed with trust, and users get charts, explanations, and reasoning steps in one flow.
Additionally, users can save charts to dashboards for ongoing monitoring and reference.
Data Source Support
ML Clever supports data uploads from CSV, Excel, and Parquet files. For those needing live connections to data warehouses like Snowflake or BigQuery, this functionality is available through a separate dashboard product rather than the core analysis tool.
Starting Price (USD)
A free trial lets users test the platform with sample data or their own CSV files. For teams, shared workspaces and collaboration features are available under a Teams plan, with pricing provided upon contacting sales. Enterprise plans offer custom pricing and include advanced workspace controls and rollout support.
Ideal Team Size
ML Clever is flexible enough to support individuals and large organizations alike. It's perfect for non-technical teams that need fast, shareable insights without relying on static dashboards.
3. Tellius
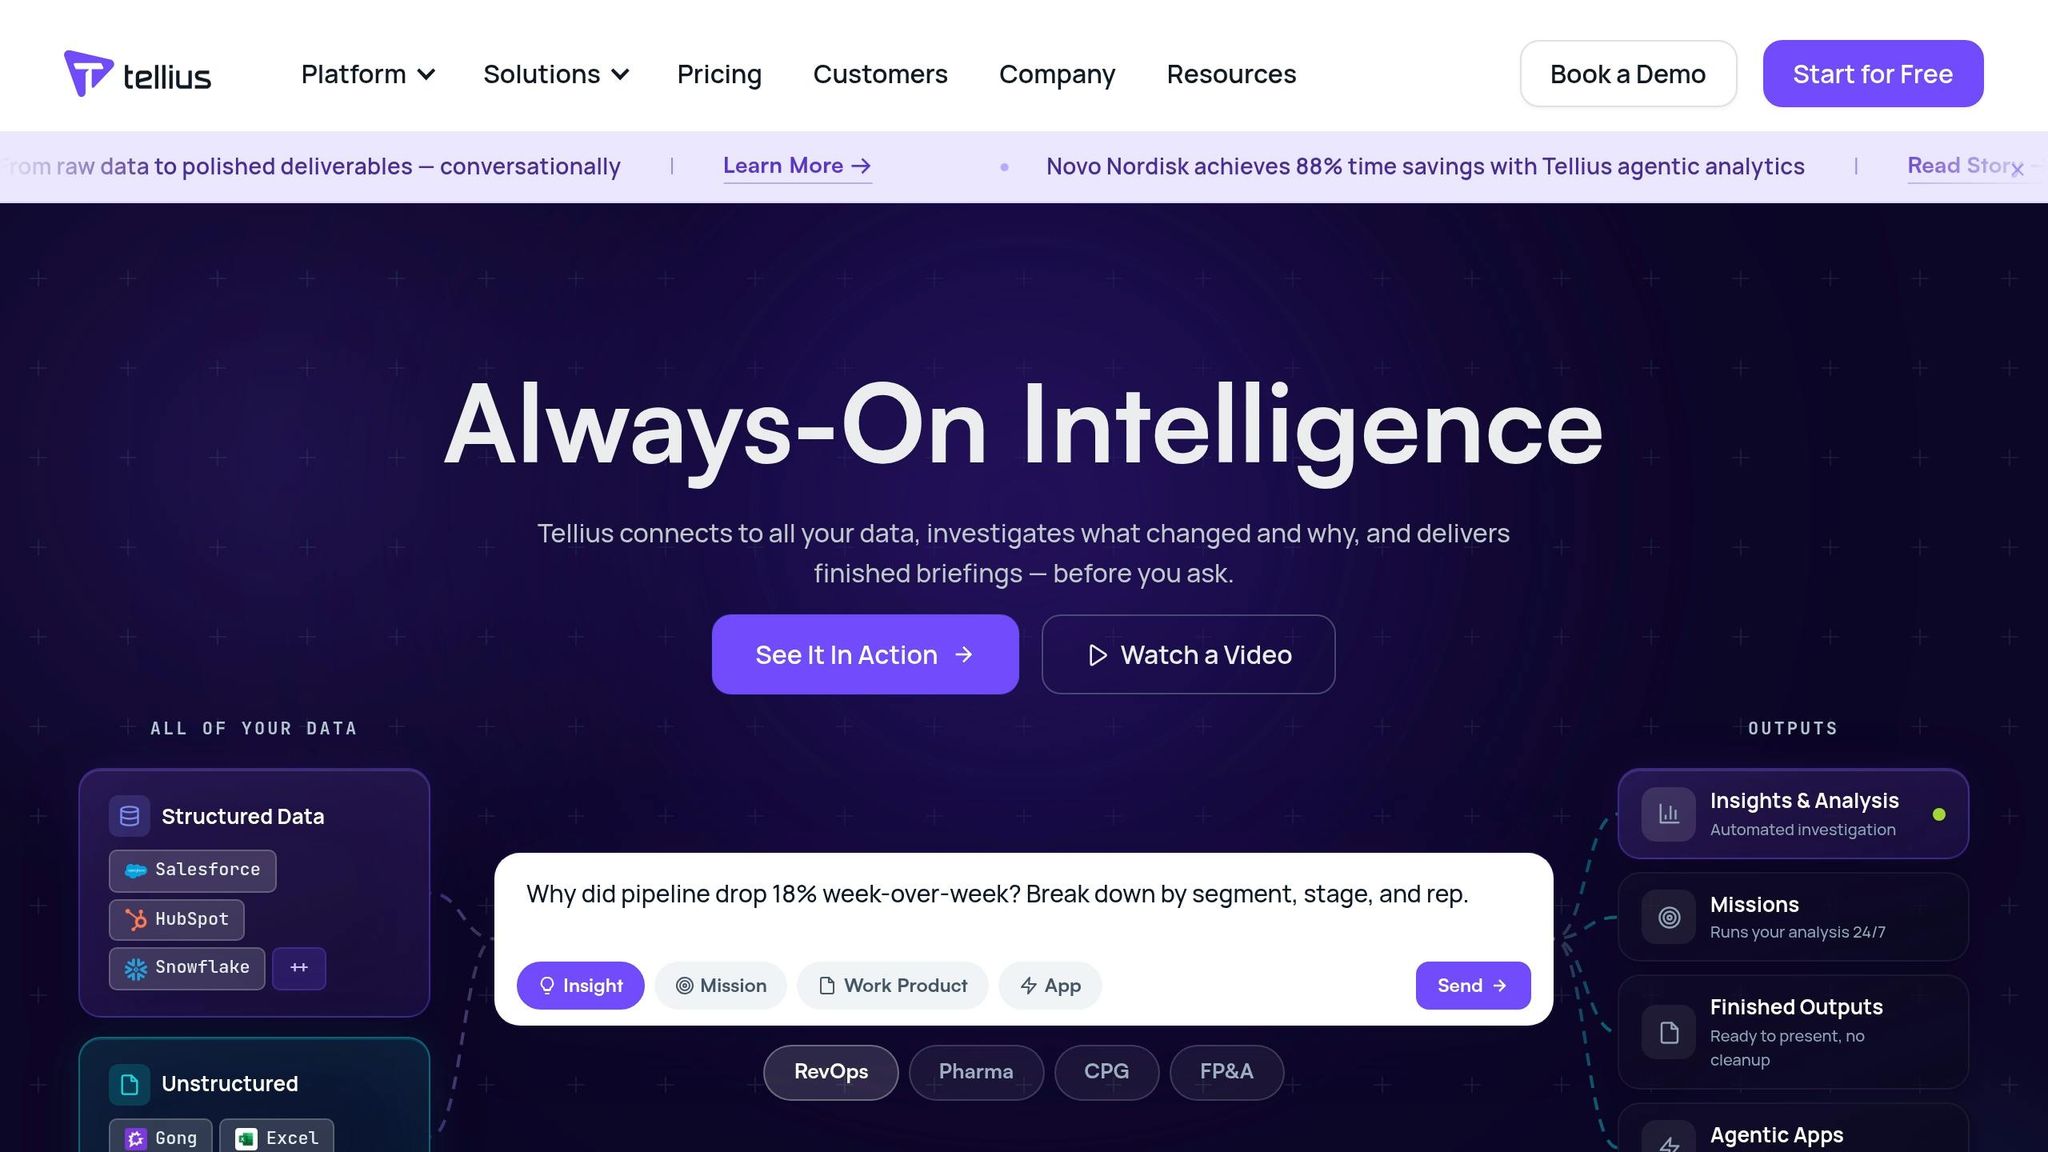
Tellius focuses on enterprise analytics teams, offering automated root cause analysis that reduces turnaround times from days to just moments. Trusted by 8 of the top 10 pharmaceutical companies, including Novo Nordisk, AbbVie, and Bristol Myers Squibb, Tellius has a proven track record of success. It has been recognized as a Magic Quadrant Visionary by Gartner for four consecutive years (2022–2025), setting a high standard in enterprise analytics.
Best Use Case
Tellius shines in automated root cause analysis across various industries. Its integrations are tailored to specific needs, such as:
Pharmaceutical teams tracking KPIs with IQVIA and Veeva.
CPG teams analyzing market share using Nielsen data.
Finance departments creating executive summaries with driver rankings.
RevOps teams investigating changes in sales pipelines.
One notable example involves a top 20 pharmaceutical company that used Tellius AI Agents during 2025–2026 to identify formulary status changes. This system streamlined the process of analyzing payer performance and assessing sales impact, then automatically sent targeted rep lists to their CRM. The result? A reduction in intervention time from three weeks to just three days and a 5% gain in market share. This kind of automation highlights the shift toward faster, AI-driven decision-making.
Key AI Features
Tellius differentiates itself with agentic workflows, where AI agents autonomously manage multi-step analytical pipelines. These agents test hundreds of hypotheses in seconds, ranking drivers by their statistical impact. Chris Walker, Head of Product Marketing at Tellius, explains:
A chatbot stops at SQL + chart. An analytics platform delivers deep insight and next actions end-to-end.
The platform's deterministic engine ensures precise, mathematically accurate calculations that go beyond what pure LLM-based tools can achieve. A governed semantic layer ensures consistent metric definitions across the organization, so every user receives the same accurate data.
Tellius also provides proactive monitoring, which runs continuously to detect anomalies and investigate them before anyone even asks. Users can set up recurring "missions" where the AI monitors data and delivers fully prepared briefings ahead of meetings. Novo Nordisk, for instance, reported an 88% time savings by using these agentic analytics to convert raw data into actionable insights.
Data Source Support
Tellius supports 30+ pre-built connectors, including major cloud warehouses like Snowflake, Databricks, BigQuery, and Redshift. Its "System Packs" are tailored for specific industries, offering native support for:
Pharma data sources like IQVIA and Veeva.
CPG platforms such as Nielsen and Circana.
RevOps tools like Salesforce, HubSpot, and Gong.
The platform also handles unstructured data, making it adaptable to a wide range of use cases. This extensive integration capability is paired with a flexible pricing structure.
Starting Price (USD)
Tellius offers custom pricing with no per-user fees.
The Pro tier is designed for mid-size teams, providing governed conversational AI data analyst tools and deep insights with quick deployment.
The Enterprise tier includes advanced features like agentic workflows, orchestration, proactive monitoring, and dedicated support for large-scale implementations.
Ideal Team Size
Tellius is suitable for mid-size teams through its Pro tier and large enterprise analytics departments via its Enterprise tier. It's particularly effective for organizations with centralized analytics teams serving multiple business units, where consistent data definitions and automated investigations can help eliminate bottlenecks.
4. Microsoft Power BI Copilot
Microsoft Power BI Copilot is designed for organizations deeply embedded in the Microsoft ecosystem, making it a natural choice for companies already using tools like Excel, Teams, SharePoint, and Azure. With over 250,000 organizations relying on it - 98 of the Fortune 100 among them - it has firmly established itself as the analytics platform of choice for Microsoft-focused enterprises [14]. Its integration with Microsoft 365 and OneLake ensures a unified data environment, enabling smooth and efficient analytics.
Best Use Case
Power BI Copilot shines in conversational analytics tools, allowing users to interact with data without needing expertise in SQL or DAX syntax. For instance, a 2026 retail case study highlighted how a team identified a 15% sales drop and pinpointed its root causes in under five minutes [3]. Its mobile functionality is particularly useful for executives, offering voice dictation on iPhones and iPads for hands-free data analysis, whether on the move or prepping for meetings [10].
Different industries leverage Power BI Copilot's strengths in unique ways:
Financial institutions use its predictive AI to detect fraud and predict market trends.
Manufacturers rely on Copilot dashboards to monitor production lines and identify equipment issues.
Retailers benefit from real-time streaming to track inventory and adjust supply chains dynamically [8].
This conversational and adaptive approach aligns with the growing demand for real-time, user-friendly analytics tools.
Key AI Features
Power BI Copilot removes technical barriers with features like automated DAX generation, which translates natural language into complex formulas. In testing, Copilot successfully created accurate DAX formulas on the first attempt for 12 out of 15 advanced calculations [13]. Katie Murray from Microsoft's Power BI team explains:
Now you can simply ask your question, and Copilot does the work by finding the right reports or data in your app... getting you to insights faster [7].
The platform's prompt limit has increased to 10,000 characters, enabling more detailed queries [7]. The Narrative visual feature, now defaulting to Copilot mode, generates dynamic summaries that automatically update when filters are applied [7][10][11]. For added accuracy, users can "attach" specific reports or semantic models to a Copilot chat, ensuring responses are based on verified data rather than generic results [9].
Power BI Copilot also excels in data connectivity, supporting 160+ native data connectors and integrating seamlessly with Microsoft Fabric’s OneLake. Using Direct Lake storage mode, it can query large datasets in Delta Lake and Parquet formats without the need for manual refreshes [3][11]. As part of its evolution, Power BI is phasing out older tools like Power BI Q&A (set to be deprecated in December 2026) in favor of the more advanced Copilot experience [9].
Starting Price (USD)
The base license for Power BI starts at $14 per user/month, with the Copilot add-on priced at $30 per user/month. However, it requires Fabric capacity (F2+) or Premium capacity (P1+) [3][9][12]. For organizations already invested in Microsoft 365, Power BI offers a cost-effective solution when considering the overall Total Cost of Ownership [3][12].
Ideal Team Size
Power BI Copilot is suitable for teams of all sizes, though it provides the greatest value to larger enterprises that have standardized on Microsoft tools [3][12]. With an ease-of-use rating of 7.2/10 in 2026 enterprise benchmarks, it’s accessible to general business users, not just data professionals [3]. To optimize results, administrators should mark verified semantic models as "Approved for Copilot" [9].
5. Tableau Pulse
Tableau Pulse shifts how businesses approach analytics, moving from a "pull" model - where users actively search for dashboards - to a "push" model, where AI delivers insights directly into users' workflows. Designed for analytics consumers, who make up nearly 70% of employees but rarely interact with dashboards, it provides real-time, personalized updates on key metrics through Slack, email, or mobile notifications [16][18]. This approach integrates analytics seamlessly into daily operations, evolving from traditional dashboards to AI-driven, workflow-embedded insights.
Best Use Case
Tableau Pulse is ideal for monitoring metrics proactively, especially for non-technical users. A standout example comes from Virgin Media O2, which implemented the tool to make data more accessible organization-wide. Mauro Flores, Executive Vice President of Data Democratization at Virgin Media O2, shared:
"We now have data that's available on a daily basis that's easy to navigate, easy to query, and available on our phone. It's really changing the game." [15]
The tool demonstrated its effectiveness by detecting a revenue anomaly within just 4 hours of the data entering a warehouse [13]. This makes it especially useful for executives and field teams who need quick, mobile-friendly insights rather than complex desktop visualizations.
Key AI Features
Tableau Pulse incorporates AI to simplify analytics and provide actionable insights. Its generative AI summarizes trends in plain English, explaining metric changes without requiring manual analysis [17]. Two standout features include:
Inspector Skill: Monitors KPIs and sends instant alerts when thresholds are breached.
Concierge Skill: Delivers root cause analysis to pinpoint what’s driving data changes.
In one case, the AI flagged a 23% week-over-week revenue drop in the Electronics category, a sharp contrast to the category’s 8-week average growth of 4% [13].
The Metrics Layer adds further value by acting as a headless BI system, enabling organizations to define KPIs once and use them across multiple platforms as a single source of truth. Users also receive a "Today's Pulse" daily digest, which highlights the most relevant metrics for their roles. Tableau Pulse is included with all Tableau Cloud editions and Embedded Analytics [18].
Data Source Support
Tableau Pulse integrates with over 160 native data connectors, including major cloud data warehouses like Snowflake, Google BigQuery, Amazon Redshift, and Databricks [20]. It also connects seamlessly with Salesforce CRM data.
Starting Price (USD)
Tableau Pulse pricing begins at $15 per user/month for Tableau Viewer (billed annually) [18]. Tableau Explorer, designed for self-service analytics, costs $42 per user/month, while Tableau Creator, which includes full authoring and Metrics Layer management, is priced at $75 per user/month. Advanced features bundled under Tableau+ require custom enterprise pricing [20].
Ideal Team Size
This tool is best suited for mid-size to large enterprises, especially those looking for dynamic, integrated analytics capabilities [19]. It received an 8.8/10 rating from enterprise users in 2026 for its search-based and automated insights [3]. However, its natural language query interface struggled with 45% of complex test queries involving date calculations and nested comparisons [13].
6. ThoughtSpot
ThoughtSpot's search-driven analytics platform allows users to ask questions in plain English and receive instant visualizations. In professional testing conducted in 2026, it achieved an 80% accuracy rate, correctly answering 16 out of 20 natural language queries - outperforming other major BI platforms [13]. This makes it an effective tool for connecting simple queries with detailed, enterprise-level analysis.
Best Use Case
ThoughtSpot thrives in environments where self-service analytics is prioritized over relying heavily on data teams. Its Spotter AI Agent enables users to interact with data conversationally, while SpotIQ automatically identifies anomalies and trends without manual input. This combination is ideal for mid-to-large enterprises with a range of users, from executives seeking quick insights to data scientists performing advanced modeling tasks. The Analyst Studio supports SQL, Python, and R, making it versatile for technical users. Overall, ThoughtSpot empowers business users with immediate insights, driving the adoption of AI in analytics.
Key AI Features
The platform includes three AI tools tailored for different roles:
Spotter: Handles conversational queries for business users and executives.
SpotIQ: Automates anomaly detection for analysts and managers.
Analyst Studio: Offers a modeling environment for data scientists.
The Pro Plan limits users to 25 Spotter queries per month, while Enterprise users enjoy unlimited queries [6]. A well-structured semantic layer (TML) is essential to ensure high AI accuracy, as the performance heavily depends on the quality of the data model [13].
Data Source Support
ThoughtSpot integrates seamlessly with major cloud data warehouses and databases. It earned an 8.8/10 rating from enterprise users in 2026, cementing its reputation as a leader in the search-driven analytics space within the $68 billion AI analytics market [3].
Starting Price (USD)
The Pro Plan is priced at $50 per user/month (billed annually) for teams ranging from 25 to 1,000 users [6]. For larger organizations, Enterprise pricing is customized, with mid-market companies typically spending around $140,000 annually for unlimited users and data volume [6][13]. While the cost is higher compared to some alternatives, it reflects ThoughtSpot's advanced natural language capabilities and AI-driven features. However, some users have noted drawbacks, including the high entry cost for smaller teams and limited options for customizing visualizations, such as font sizes [6][13].
Ideal Team Size
ThoughtSpot is designed for mid-size to large enterprises with at least 25 users who require powerful self-service analytics. Its pricing and feature set make it less suitable for small teams or startups operating on tighter budgets.
7. Anomaly AI
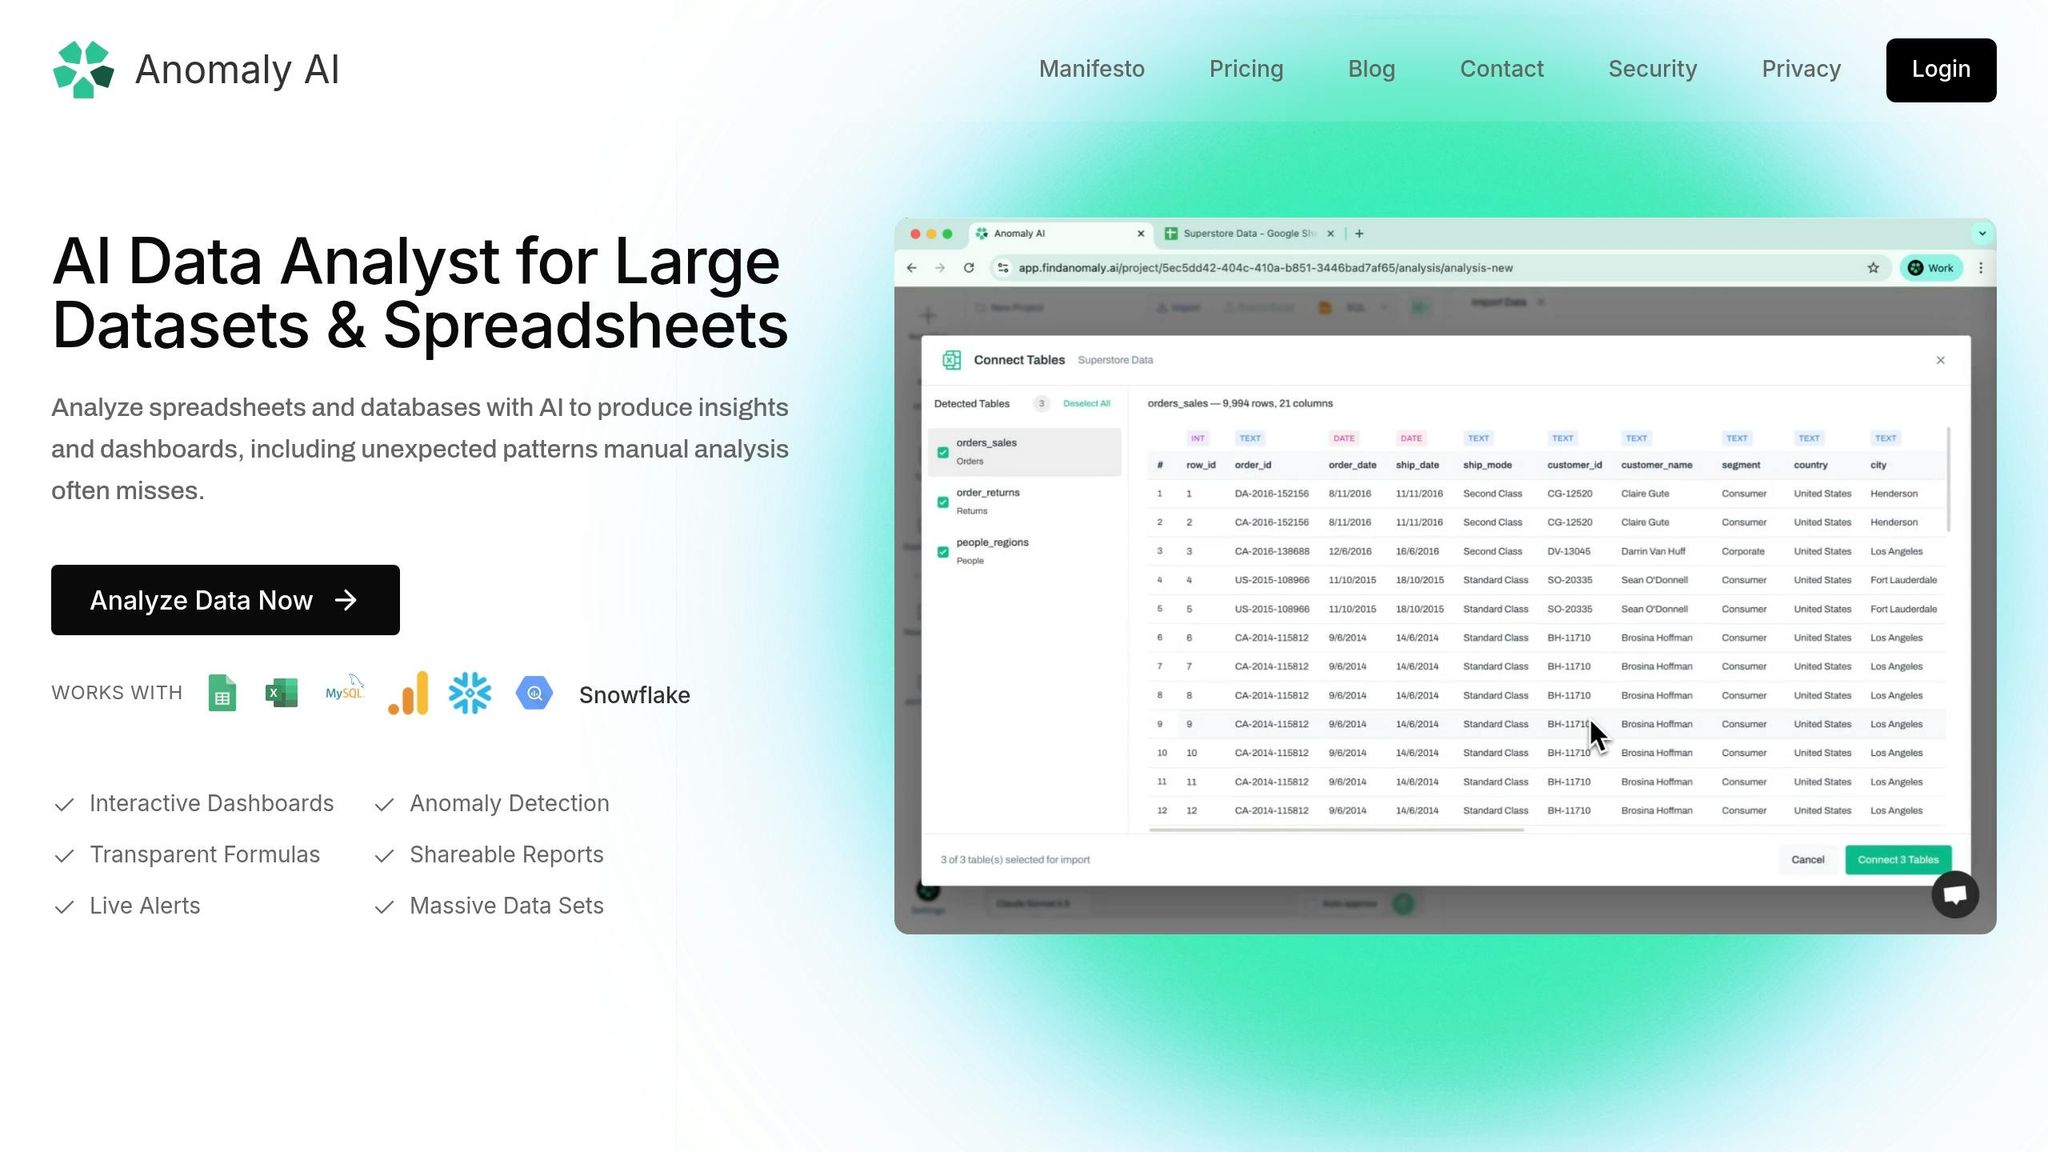
Anomaly AI moves beyond the typical AI assistant role, stepping into the realm of fully autonomous AI analyst agents. Instead of just helping with isolated tasks, it manages the entire analysis process. This includes connecting to data sources, inspecting schemas, cleaning data, generating metrics, and even building dashboards - all on its own [21][22]. This comprehensive workflow is a game-changer for teams drowning in repetitive ad-hoc analysis tasks. It’s another standout in the lineup of AI analytics tools reshaping business operations in 2026.
Best Use Case
Anomaly AI is built for non-technical teams that need quick, reliable insights without the hassle of manual analysis. It’s an excellent fit for marketing, finance, and operations departments in mid-sized companies. The platform excels at automatically spotting outliers, trends, and key changes in data. Plus, with SQL transparency - showing the exact query behind each chart or metric - it ensures insights are audit-ready and trustworthy.
Key AI Features
This tool’s autonomous workflows allow it to proactively identify anomalies and provide full data lineage for easy-to-understand queries like, "Which acquisition channels performed best last quarter?" It supports large file uploads (up to 200 MB for Excel or CSV files) and can generate live, shareable dashboards tailored to the data it processes.
Data Source Support
Anomaly AI seamlessly integrates with major data platforms, including:
Google BigQuery
Snowflake
MySQL
Google Analytics 4 (via BigQuery)
Google Sheets
Local Excel/CSV files
PostgreSQL support is also in the works. By analyzing data directly at its source, the tool ensures dashboards stay up-to-date with live connections.
Starting Price (USD)
Anomaly AI offers a free tier at $0 per month - no credit card required. For advanced features, the Pro Plan starts at $20 per seat per month, and the Team Plan is $25 per seat per month. Enterprise pricing is available upon request.
Ideal Team Size
This platform is best suited for small teams or non-technical departments within mid-sized companies. Teams ranging from 1 to 50 users, particularly those with established data systems like warehouses or databases, will find it especially effective.
Strengths and Weaknesses
Each tool in the analytics space has its standout features and areas where it may fall short. Here's a detailed breakdown of their strengths and limitations:
Tool | Pros | Cons |
|---|---|---|
Querio | AI-native workspace with inspectable SQL and Python; live connections to data warehouses; shared context layer ensuring consistent metrics; flexible pricing without seat limits; SOC 2 Type II compliant. | A newer platform compared to established BI tools; ideal for teams already using modern data warehouses. |
Tellius | Strong in conversational analytics and automates root cause analysis, saving 3–5 business days of manual work per investigation [2]; trusted by major pharmaceutical companies, including 8 of the top 10 [2]. | Requires a well-organized, governed data warehouse [1][3]; pricing is customized. |
Microsoft Power BI Copilot | Excels in generating DAX formulas and creating report summaries [2][4]; seamless integration with Microsoft 365; Pro tier available at $10/user/month [2]. | Copilot features need Fabric F64+ capacity, starting at ~$5,000/month [2]; steep learning curve for DAX [1][3]; users are tied to the Microsoft ecosystem. |
Tableau Pulse | Provides automated plain-language narratives explaining metric changes [5][4]; handles large datasets efficiently; integrates well with Salesforce. | Costs $115/user/month [2]; additional charges for Agentforce and Data Cloud credits; complexity may deter occasional users [1][3]. |
ThoughtSpot | Offers a mature, search-first natural language interface [2][6]; efficiently manages datasets with over 10 million rows; Essentials tier priced at $25/user/month [6]. | Requires exceptionally clean data modeling [6]; enterprise contracts average around $140,000 annually [6]; performance heavily relies on data quality [1][3]. |
Anomaly AI | Provides full SQL transparency for insights [22]; designed for non-technical users with autonomous workflows; free tier available; supports files up to 200 MB [22]. | None noted. |
Clean, well-governed data remains a cornerstone for all these platforms. Even the most advanced tools depend on the quality of the underlying data to deliver meaningful insights. Pricing varies significantly, from Power BI's budget-friendly $10/user/month Pro tier to enterprise-level contracts exceeding $100,000 annually, such as those for ThoughtSpot. Custom pricing is common for tools like Tellius.
The analytics landscape is evolving rapidly, with agentic analytics setting new standards. Tools like Tellius and Querio are automating entire workflows, going beyond just answering individual queries. Gartner forecasts that by the end of 2026, 40% of enterprise applications will incorporate task-specific AI agents [2]. Chris Walker, Head of Product Marketing at Tellius, highlights this shift:
A chatbot stops at SQL + chart. An analytics platform delivers deep insight and next actions end-to-end. [2]
This comparison underscores how each platform is tailored for specific needs, helping you identify the right fit for your organization.
Conclusion
In a world brimming with AI analytics tools, finding the right fit comes down to your organization’s specific needs. Querio stands out for teams that require audit-ready analytics and quick, dependable insights - without losing control. With features like inspectable SQL and Python, live data warehouse connections, and a shared context layer for consistent metrics, it’s crafted for teams seeking self-serve analytics with full transparency.
Querio’s approach combines AI-powered analytics platforms with live data connections, audit-ready SQL and Python capabilities, and strong governance. This makes it a solid choice for modern teams aiming for fast insights while ensuring data quality and security. Its SOC 2 Type II compliance and pricing model, which avoids seat limits, make it especially appealing for growing organizations needing scalable analytics across departments.
The analytics game has shifted. It’s no longer just about reactive tools but systems that proactively monitor KPIs and flag anomalies before you even think to look. The rise of agentic analytics is undeniable: Gartner predicts that by the end of 2026, 40% of enterprise applications will feature AI agents tailored to specific tasks - up from under 5% in 2025 [2]. Whether your focus is on simple visualizations or advanced AI-driven insights, aligning your choice with your goals is key.
As the industry moves forward, tools that provide clear, actionable insights - like Querio - are poised to lead the way in business intelligence by 2026.
FAQs
Do I need clean data for AI analytics to work well?
Clean data is the backbone of accurate AI analytics. AI tools rely on high-quality, well-organized data to perform tasks efficiently, automate workflows, and generate dependable insights. When data is messy or inconsistent, the results can become unreliable, undermining the purpose of using AI in the first place. In short, ensuring your data is clean isn't just a best practice - it's essential for getting meaningful and accurate outcomes.
How can I audit or verify AI-generated analytics?
To effectively review AI-generated analytics, start by using tools equipped with automated validation to ensure data accuracy. Establish governance protocols and role-based access controls to keep workflows consistent across your teams. Choose platforms that provide clear explanations, such as root cause analysis, to help you interpret insights. It's also a good idea to routinely cross-check AI outputs with manual analysis, particularly when introducing new tools or features. This approach helps maintain reliability and trust in your analytics.
What should I check before connecting an AI tool to my data warehouse?
Before linking an AI tool to your data warehouse, it’s crucial to prioritize data governance and security. Make sure there are strong access controls and validation processes in place to protect sensitive information. Check the tool’s integration capabilities to ensure it works smoothly with your data sources and supports formats like SQL or Python. Additionally, evaluate its scalability to confirm it can handle large datasets without performance issues. Finally, verify the availability of data quality tools to validate information and ensure the tool integrates seamlessly with your current systems, minimizing the risk of disruptions.
Related Blog Posts


