Business Intelligence
AI Analytics for CPG: Market Share Reports Without the 30-Slide Deck
Stop rebuilding decks; use a governed warehouse and semantic layer so AI delivers traceable, decision-ready CPG market-share answers fast.
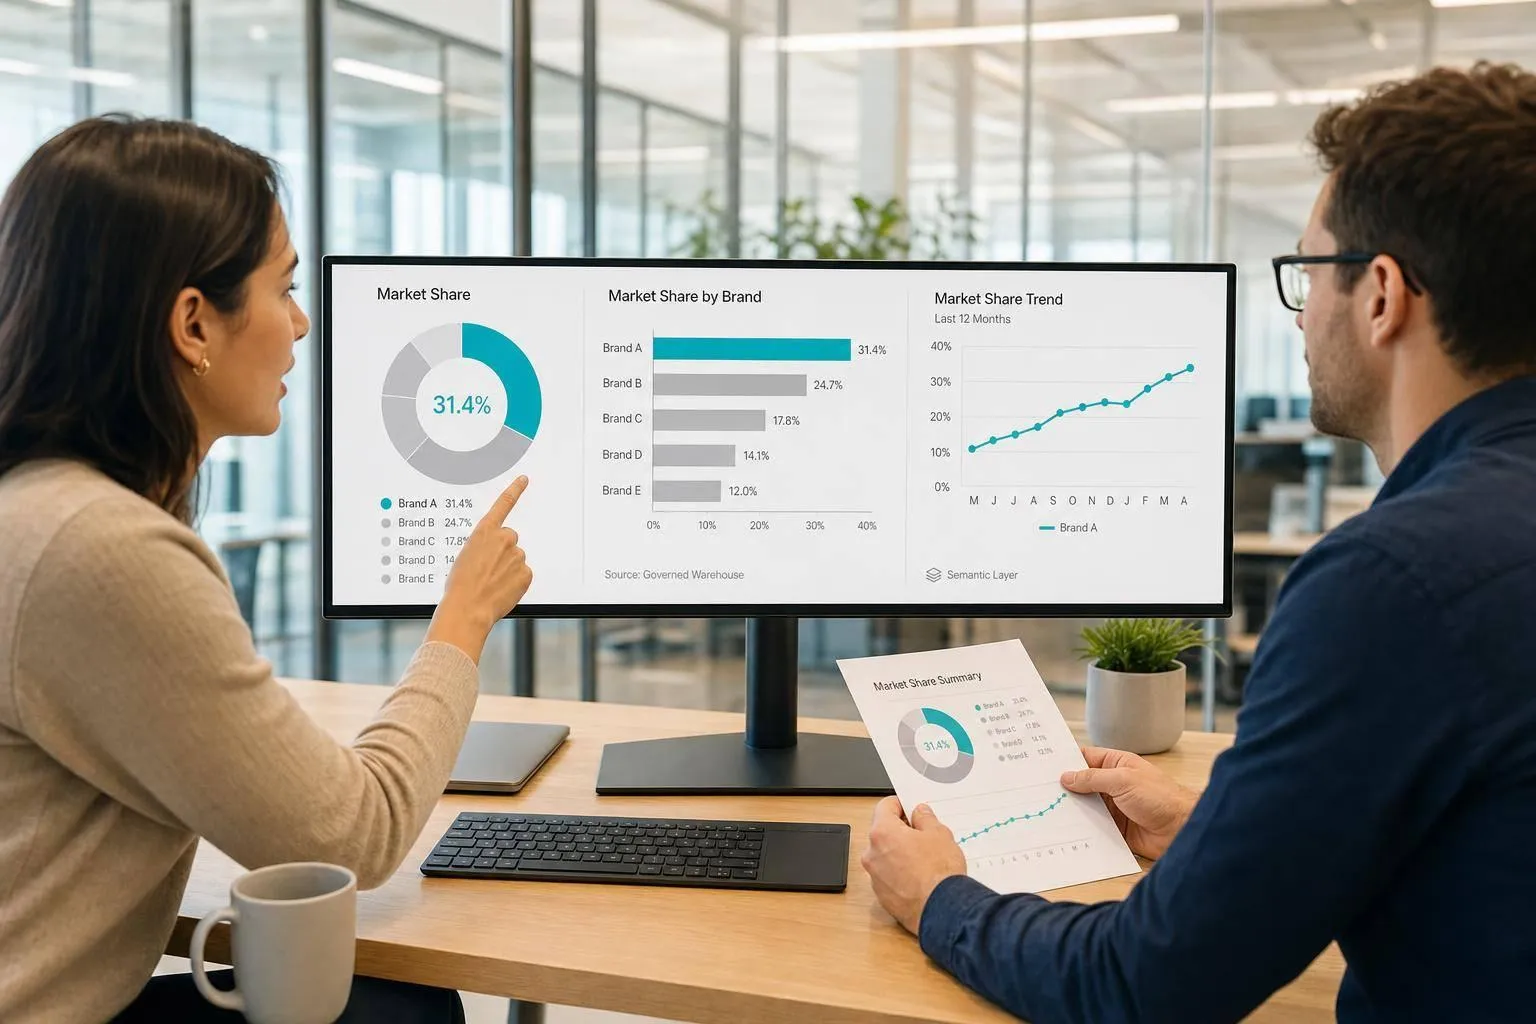
You do not need another slide deck to answer a market share question. If your CPG data is in Snowflake, BigQuery, Redshift, or Postgres, AI can turn that data into direct answers in seconds or minutes, while giving analysts back about 20 hours per month on repeat reporting work.
Here’s the short version: I’d move market share reporting out of PowerPoint and into a governed warehouse workflow. That means one place for syndicated, retailer, and internal data; one set of metric definitions and semantic layer concepts for share, velocity, and promo lift; and one delivery path through notebooks, Slack, or scheduled reports. The result is simple: fewer rebuilds, fewer metric fights, and faster follow-up answers.
If I had to sum up the article in a few points, it would be this:
- Manual decks slow teams down. Analysts keep remaking the same report for slightly different questions.
- Static slides fail on follow-ups. When someone asks for retailer, region, or promo-adjusted cuts, the work starts over.
- Dashboards help, but only to a point. They work for fixed views, not open-ended back-and-forth questions.
- AI works best when data is governed. Without clean warehouse data and approved metric logic, AI can return the wrong number.
- A semantic layer matters. It keeps share definitions consistent across analysts, dashboards, and AI answers.
- Direct warehouse access matters too. It keeps answers tied to live data instead of old CSV files.
- Audit trails are part of the setup. Each answer should link back to the query, notebook, or code behind it.
- A shadow period lowers risk. The article recommends up to 30 days to check AI answers before broad use.
- Trend analysis needs enough history. In many cases, that means 18 to 24 months of weekly data, or about 80 to 100 data points.
- Context-aware AI performs better than generic LLMs. The article cites 95%+ SQL accuracy for governed tools versus 69% for generic models without business context.
The main idea is simple: stop treating market share reporting like a presentation task. Treat it like a data-answering system.
Quick comparison
| Workflow | Best for | Main limit | Speed | Follow-up handling | Metric control |
|---|---|---|---|---|---|
| PowerPoint/Excel decks | One-off presentations | Manual rebuilds every cycle | Days to weeks | Poor | Low |
| BI dashboards | Fixed recurring views | Limited to preset filters | Minutes | Medium | High |
| Warehouse-native AI | Ad hoc market share questions | Depends on data setup | Seconds to minutes | High | High |
So if you keep getting asked, “What changed in share, where did it happen, and why?” the article’s answer is clear: build the data warehouse layer first, define metrics once, and let AI return answers instead of another 30-slide file.
The problem with manual CPG market share decks
Most CPG market share reports still begin as a presentation task, not a direct answer.
Week after week, or month after month, analysts pull syndicated, retailer, and internal sales data, then spend days rebuilding the same deck from the last reporting cycle. So even a simple market share question often kicks off yet another round of slide work.
Why analysts become the manual interface
Category managers and sales teams ask the same share questions in slightly different ways. But without a self-serve layer that gives them context, each version ends up back on the analyst’s desk.
That means analysts spend most of their time joining, cleaning, and reshaping data before they can even get to the actual question [3].
"When the answer needs a drill-down, someone files a ticket, an analyst writes SQL, and the meeting moves on." [1]
That setup holds up only until someone wants the same answer sliced one more way.
Where the deck workflow breaks down
The deeper issue is consistency and the ability to handle follow-up. When share data is spread across separate exports from syndicated providers and internal systems, the definition of share can shift from one export to the next. Two files can give two different answers for the same KPI, and trust falls apart fast [1].
Then comes the next problem. A stakeholder gets the deck and asks a follow-up question - maybe they want to break a share drop by retailer, or remove promo weeks. At that point, the slide-based process runs out of road. There’s no single governed answer sitting behind the chart.
The deck is static. So the analyst has to go back to the raw exports, rewrite SQL, and rebuild the chart all over again.
The analysis isn’t the part that breaks. The weak spot is the handoff from question to answer. The next question is what the report should produce instead.
What AI should produce instead of a 30-slide deck
::: @figure 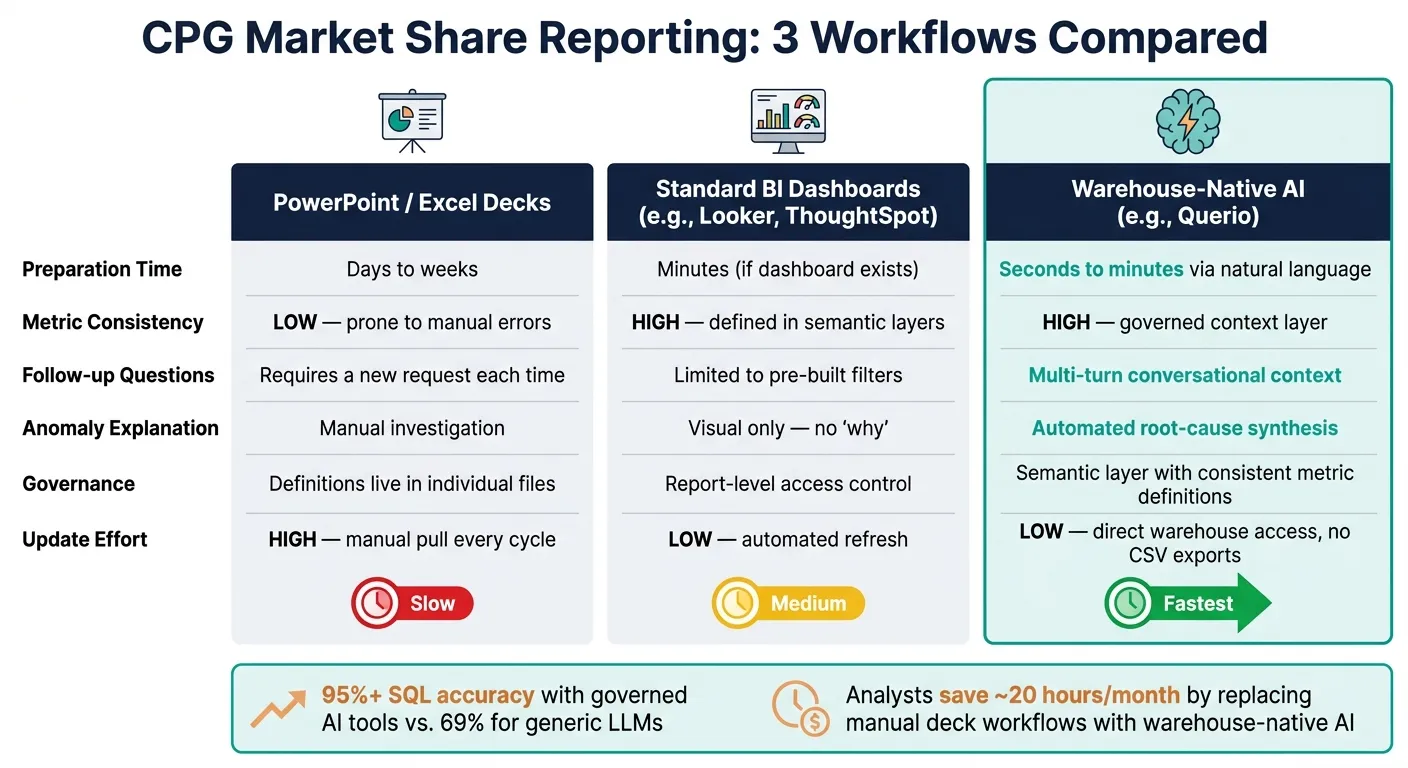 {CPG Market Share Reporting: Decks vs. Dashboards vs. AI}
:::
{CPG Market Share Reporting: Decks vs. Dashboards vs. AI}
:::
AI should replace the deck with governed answers that people can use right away for CPG market share reporting.
Brand and share change summaries
If the deck falls apart at the point where a question should turn into an answer, the first fix is simple: start with a summary that says what changed.
That summary should be short and plain. It should show which brands gained share, which brands lost share, and the size of the move. It also needs to be traceable back to the SQL or Python behind it, so the method stands up in a finance review. Specialized AI tools grounded in a governed semantic layer reach 95%+ SQL accuracy, compared with 69% for generic LLMs that lack business context [5].
Then add ranked drivers behind the move, such as:
- Baseline demand
- Promo lift
- Media
- Weather
- Macro factors
Once that summary is in place, the next question comes fast: where did the change come from?
Retailer, region, and anomaly breakdowns
When share drops, people don’t just want to know that it happened. They want to know where.
A warehouse-native AI system should handle follow-up questions in the same session across retailer, region, channel, and banner. No new ticket. No new export. If the share data sits in a warehouse like Snowflake or BigQuery and the AI queries it directly, anomaly explanations can be automated. The root cause shows up before anyone has to file a request. That kind of routine diagnostic work gives analysts back roughly 20 hours per month [5].
Deck workflow vs. BI dashboards vs. AI-driven reporting: a comparison
The tradeoffs get pretty clear when you line up the three workflows. Decks need manual rebuilds. Dashboards work well for fixed views. AI is better at handling follow-up questions.
| Feature | PowerPoint/Excel Decks | Standard BI Dashboards (Looker, ThoughtSpot) | Warehouse-Native AI (Querio) |
|---|---|---|---|
| Preparation time | Days to weeks | Minutes if the dashboard exists | Seconds to minutes via natural language [1][5] |
| Metric consistency | Low - prone to manual errors | High - defined in semantic layers | High - governed context layer |
| Follow-up questions | Requires a new request | Limited to pre-built filters | Multi-turn conversational context |
| Anomaly explanation | Manual investigation | Visual only - no "why" | Automated root-cause synthesis [4] |
| Governance | Definitions live in individual files | Report-level access control | Semantic layer with consistent metric definitions |
| Update effort | High - manual pull every cycle | Low - automated refresh | Low - direct warehouse access, no CSV exports |
Standard BI tools do a good job with governed dashboards. AI does a better job with ad hoc share questions and follow-ups. Warehouse-native AI closes the gap between governed dashboards and ad hoc analysis.
The data and workflow required to make AI reporting work in practice
Useful AI market share answers come from governed data, not just better models. If the warehouse, metric definitions, and delivery workflow aren’t set up first, AI ends up guessing - and that’s where bad answers creep in.
The order matters. Start with the warehouse. Then set the metric layer. Then connect the delivery channel. That setup lets AI handle follow-up questions without forcing someone to rebuild slides every time.
Unify syndicated, retailer, and internal data in the warehouse
Bring syndicated, retailer, and internal data into one warehouse and model it into a consistent schema. For CPG market share reporting, that usually includes NielsenIQ, Circana, or SPINS data, plus retailer POS and inventory, internal shipments and P&L, and context such as promotions, pricing changes, and stockouts.
Use dbt to standardize retailer names, UPC hierarchies, brand rollups, region mappings, and time periods before any query runs. For trend analysis you can trust, teams usually need 18 to 24 months of weekly observations - about 80 to 100 data points - so the model has enough history to work with [2].
It also helps to add hard pipeline checks. If upstream data breaks, the AI should return an error instead of a misleading number [1]. That’s a much better outcome than a polished answer built on bad inputs.
Once the data lines up, the next job is setting one clear definition for share.
Define share and category logic in a governed context layer
Clean data by itself won’t solve the problem. Market share, value share, volume share, velocity, distribution, and promo uplift all need one approved definition that every analyst, dashboard, and AI-generated answer uses the same way.
A semantic layer gives AI and dashboards the same metric definitions. So if two people ask the same question, they should get the same answer. No side-by-side reports with different math hiding under the hood.
Store metric definitions in SQL, Markdown, and Python files in GitHub next to the dbt project. Analysts review proposed updates, and only approved changes get committed. Teams can also use a 30-day shadow period to check AI answers before stakeholders see them [1].
With the metric layer under control, the next step is making answers easy to use in the places people already work.
Deliver answers through notebooks, Slack, and scheduled reports
Once the data and definitions are ready, the delivery layer often decides whether people use the workflow or ignore it. Querio connects straight to the live warehouse, so each answer reflects current data. Analysts work in a reactive notebook where SQL and Python cells stay linked, which means chart updates follow logic changes right away.
For category managers, Slack or Microsoft Teams can serve as the front door. Each question runs through the notebook, with a full audit trail. Every answer stays tied to an auditable query and notebook, so there’s always a way to check where the number came from.
Scheduled automations take care of repeat work. A weekly share summary can run on a fixed cadence and land in Slack before the team starts the week. And when a share metric breaks, the agent can look into the root cause and send findings on its own.
Conclusion: a shorter path from raw data to business decisions
The deck was a presentation problem, not an insight problem. Analysts were spending more time polishing slides than answering the questions that shape business decisions. So the fix doesn't start in PowerPoint. It starts in the warehouse.
AI analytics shifts the hard work upstream - into the warehouse, metric definitions, and a governed context layer - so the final output is a clear answer, not another deck. When that upstream setup is done well, the last step gets much simpler: deliver the answer in a format people can act on.
This workflow works when definitions are governed, code can be inspected, and outputs stay tied to live data in Snowflake, BigQuery, Redshift, or Postgres instead of an old CSV export.
With the context layer and live warehouse access in place, CPG teams can go from raw syndicated and retailer data to decision-ready market share answers without rebuilding yet another deck.
FAQs
::: faq
What data do we need before AI market share reporting will work?
You need a governed semantic layer with consistent definitions for metrics like market share, brand performance, and regional segments. Without that, AI can return different answers to the same question. And that’s where trust starts to fall apart.
You also need live access to clean, modeled sales, retailer, and market share data in a warehouse like Snowflake, BigQuery, Redshift, or Postgres. That data should include clear time dimensions and category hierarchies, so the system can read it the way your team does. :::
::: faq
How do we keep AI-generated share metrics consistent and trustworthy?
Ground AI analytics in a governed semantic layer instead of letting it work straight from raw tables. Define metrics like brand share or regional growth in one central, versioned layer, so the AI follows the same business logic used in dashboards and notebooks.
Also, prioritize inspectable SQL or Python so analysts can check every number. And use data observability upstream to catch schema drift or missing events before they show up in reports. :::
::: faq
What should AI deliver instead of a traditional market share deck?
AI should replace a CPG market share deck with decision-ready outputs pulled from live warehouse data.
That means turning raw data into things a category manager can act on right away, like:
- brand and share change summaries
- retailer and region breakouts
- anomaly explanations backed by evidence
- follow-up questions that help guide next steps
It also needs to be warehouse-native and governed. In plain terms, the system should work directly from the warehouse, not from stale exports or side spreadsheets.
That includes:
- inspectable, editable SQL and Python
- consistent metrics from a shared semantic layer
- live connections to Snowflake, BigQuery, Redshift, or Postgres
The goal isn't another slide deck. It's a live, trusted layer for analysis that shows what changed, why it changed, and what the team should look at next. :::