Guide
Marketing Mix Modeling: A Modern Guide for 2026
Unlock scalable growth with marketing mix modeling. This guide explains MMM methods, data needs, and how to implement it on your modern data stack for true ROI.

Your attribution dashboard probably still looks busy. The problem is that fewer teams trust what it says.
Platform reports still claim credit. Last-touch still overweights demand capture. Multi-touch pipelines still break the moment identity coverage drops, consent rates shift, or an app ecosystem changes its rules. If you're running a serious media budget, that leaves a bad gap between money spent and decisions made.
That's why marketing mix modeling has moved back to the center of measurement. Not as a nostalgic econometrics project. As a practical way to measure performance when user-level tracking no longer gives a stable view of causality. And for teams with enough scale, it's become hard to avoid. Organizations spending roughly $500,000+ per month on advertising are where MMM typically becomes financially viable, because the implementation and maintenance cost starts to justify itself at that level, according to DDA's guide to marketing mix modelling.
The shift also changes where MMM should live. The old pattern was to buy a black-box model, wait for a deck, and argue over assumptions you couldn't inspect. The modern pattern is different. Data teams can build MMM inside the warehouse, control the transformations, version the assumptions, and let marketing leaders work from transparent outputs instead of vendor PDFs.
Table of Contents
- Why Marketing Mix Modeling Is Crucial in 2026
- Understanding the Core Concepts of MMM
- Key Methods and Statistical Foundations
- The Data Required for a Successful MMM Program
- How to Interpret MMM Outputs and Drive Strategy
- Building MMM In-Warehouse on a Modern Data Stack
- Common Pitfalls and Advanced Modeling Challenges
Why Marketing Mix Modeling Is Crucial in 2026
The budget meeting is in an hour. Paid search says it hit target ROAS. Meta reports strong assisted conversions. Retail points to a promotion calendar spike. Finance wants one answer to a simple question: what drove the lift, and where should the next dollar go?
That is the operating problem MMM solves in 2026.
User-level tracking is weaker, platform self-reporting is harder to trust, and channel teams still need budget decisions every week. MMM gives companies a way to measure incremental impact from aggregate outcomes instead of depending on a clean path from impression to conversion. For teams working across privacy-regulated markets, offline sales, and fragmented media platforms, that shift is practical, not theoretical.
The companies that benefit first usually share a few traits.
- They manage meaningful budget trade-offs: MMM pays off when errors in allocation are expensive enough to justify model maintenance, data engineering, and review cycles.
- They operate in channels that overlap: Search, social, TV, affiliates, retail media, CRM, and promotions all influence the same outcome. Last-click reporting cannot separate those effects well enough for planning.
- They need a finance-grade view of marketing impact: Executives rarely need another dashboard. They need a method they can defend in planning, forecasting, and board conversations.
A useful rule from practice is simple. If marketing, finance, and analytics spend more time debating whose numbers are right than deciding what to fund next, the measurement stack is already failing the business.
MMM also fits a different role than attribution. Attribution is still useful for tactical questions inside trackable journeys, especially for campaign diagnostics and conversion path analysis. MMM answers a broader budget question at the portfolio level: what was incremental, what was baseline, and what happens if spend moves across channels? For a clear comparison, see this guide to multi-touch attribution modeling.
What changed is not just renewed interest in MMM. The implementation model changed. Data teams can now build MMM inside the warehouse, on governed data, with versioned transformations and transparent assumptions. That removes a big weakness in the old vendor-led model, where marketers got a slide deck, a few coefficients, and little visibility into how the estimates were produced.
Built this way, MMM becomes part of the analytics system the company already uses. Marketing can inspect inputs, finance can review assumptions, and data science can update the model as channel mix, pricing, and market conditions change. That is a better fit for 2026 than treating MMM as a black-box study that appears once a year and disappears when budget season ends.
Understanding the Core Concepts of MMM
A typical budget review creates the same argument. Marketing points to platform-reported conversions, finance questions whether those sales would have happened anyway, and analytics gets asked for one number everyone can use. MMM exists to answer that portfolio-level question with a transparent model built on business outcomes over time.
Marketing mix modeling quantifies how much of revenue, leads, subscriptions, or another KPI came from underlying demand versus specific interventions. Those interventions usually include media, promotions, pricing changes, distribution shifts, and external factors such as holidays or macro conditions. In practice, MMM is less about producing a perfect channel ranking and more about separating baseline performance from incremental impact in a way the business can defend.

Base sales and incremental sales
The first concepts to get right are base sales, incremental sales, and controls.
- Base sales are the outcomes the business would likely generate without active marketing pressure. Existing demand, repeat purchase behavior, distribution strength, and recurring seasonal patterns often show up here.
- Incremental sales are the additional outcomes associated with marketing or commercial actions such as paid media, discounts, or launches.
- Controls are non-media variables included so the model does not give advertising credit for changes caused by price, stockouts, weather, or other outside influences.
The trust in many MMM projects is often gained or lost at this point. If stakeholders expect every sale to be assigned to an ad platform, the model will disappoint them. If they understand that some demand was already there, the discussion gets much more productive.
A useful framing for executive teams is simple. MMM does not ask which channel touched a conversion. It asks which investments changed the total result.
Top-down measurement versus bottom-up tracking
MMM starts from aggregate outcomes over time, which makes it fundamentally different from user-level tracking and platform attribution. That is why it remains useful when identity coverage is incomplete or privacy changes reduce path visibility. Teams that already work with time series regression analysis usually recognize the structure quickly, even if the marketing-specific transformations come later.
The operational difference is straightforward:
| Approach | What it starts with | Best use | Main limitation |
|---|---|---|---|
| MMM | Weekly or daily aggregate outcomes and drivers | Budget allocation, scenario planning, executive decision support | Less precise for user-path diagnostics |
| Attribution | Touchpoints tied to individual conversions | Campaign reporting, path analysis, channel execution | Sensitive to tracking gaps and identity loss |
Both methods can coexist. MMM answers the budget allocation question at the portfolio level. channel attribution modeling remains useful for campaign diagnostics inside measurable journeys.
What MMM actually decomposes
A working MMM usually breaks performance into a small set of components the business can act on: baseline demand, media contribution, promotional lift, and the effect of major external drivers. That decomposition matters because optimization starts only after the team agrees on what created the outcome in the first place.
For example, a sales spike during a promotion period can come from several sources at once. Paid social may have expanded reach. Brand demand may have been rising already. Price cuts may have pulled demand forward. Seasonality may have amplified all of it. A usable MMM forces those factors into one framework instead of letting each team claim the same revenue.
That is also why modern MMM should not live in a slide deck delivered by a vendor once or twice a year. Built in the warehouse, with governed inputs and visible assumptions, it becomes an analytics capability the company can inspect, update, and use in planning. That shift changes MMM from a legacy measurement exercise into shared decision infrastructure.
Key Methods and Statistical Foundations
A lot of MMM content either turns into a statistics lecture or avoids the math so aggressively that the reader learns nothing. The practical middle ground is this: the model is a structured way to explain variation in outcomes over time, while accounting for the fact that media effects don't happen instantly or linearly.
OLS is the starting point, not the finish line
At the foundation, MMM is usually a regression problem. Ordinary Least Squares tries to estimate the relationship between business outcomes and a set of drivers such as channel spend, promotions, seasonality, and external controls.
That's why teams familiar with time series regression analysis often pick up MMM faster than they expect. The mechanics are related. The difference is that marketing data needs additional transformations to behave like real advertising.
If you stop at raw OLS on weekly spend and weekly revenue, the model usually produces coefficients that are mathematically neat and operationally useless. Media doesn't behave like a clean one-week switch. Effects linger. Returns flatten. Channels correlate with each other.
Here's the practical comparison:
| Approach | Core Principle | Best For | Key Challenge |
|---|---|---|---|
| OLS regression | Estimate linear relationships between outcomes and inputs | Baseline MMM prototypes and interpretable models | Raw inputs often misrepresent carryover and diminishing returns |
| Bayesian MMM | Combine observed data with prior beliefs or constraints | Noisy data, sparse channels, uncertainty-aware decision-making | Requires careful prior design and stakeholder education |
| Constrained or transformed regression | Apply domain-informed transformations such as adstock and saturation | Production MMM where media behavior must match reality | Poor transformation choices can distort channel contribution |
For teams that still think primarily in attribution terms, it can help to compare MMM with broader channel attribution modeling. Attribution assigns touchpoint credit. MMM estimates incremental contribution from aggregated time-series data.
Adstock and saturation make the model behave like marketing
Two concepts determine whether the model resembles real media performance.
- Adstock handles carryover. A TV campaign or video burst doesn't stop influencing demand the second the spend stops. Some effect decays into later periods.
- Saturation handles diminishing returns. Early spend often works better than late spend. Past some point, another dollar adds less than the last one.
- Transformations convert raw spend into variables the model can estimate more realistically.
A simple way to think about adstock is memory. The market remembers some advertising for a while, then forgets it gradually. Saturation is different. It asks how crowded the response curve becomes as spend rises.
If your model assumes that every extra dollar has the same effect forever, it isn't modeling marketing. It's modeling a spreadsheet fantasy.
Bayesian MMM helps when the data is messy
Bayesian approaches matter because real marketing data is messy, correlated, and incomplete. They let teams encode reasonable priors, express uncertainty more accurately, and stabilize estimates where pure data-driven fitting becomes fragile.
That's especially useful in two situations. First, when channels have weak or sparse histories. Second, when several channels tend to move together and the model struggles to separate them cleanly.
Practically, Bayesian MMM often wins trust when teams need ranges rather than false precision. A coefficient with uncertainty attached is usually more useful than a crisp number nobody should believe. The goal isn't sophistication for its own sake. The goal is a model whose assumptions match business reality closely enough that leaders will act on it.
The Data Required for a Successful MMM Program
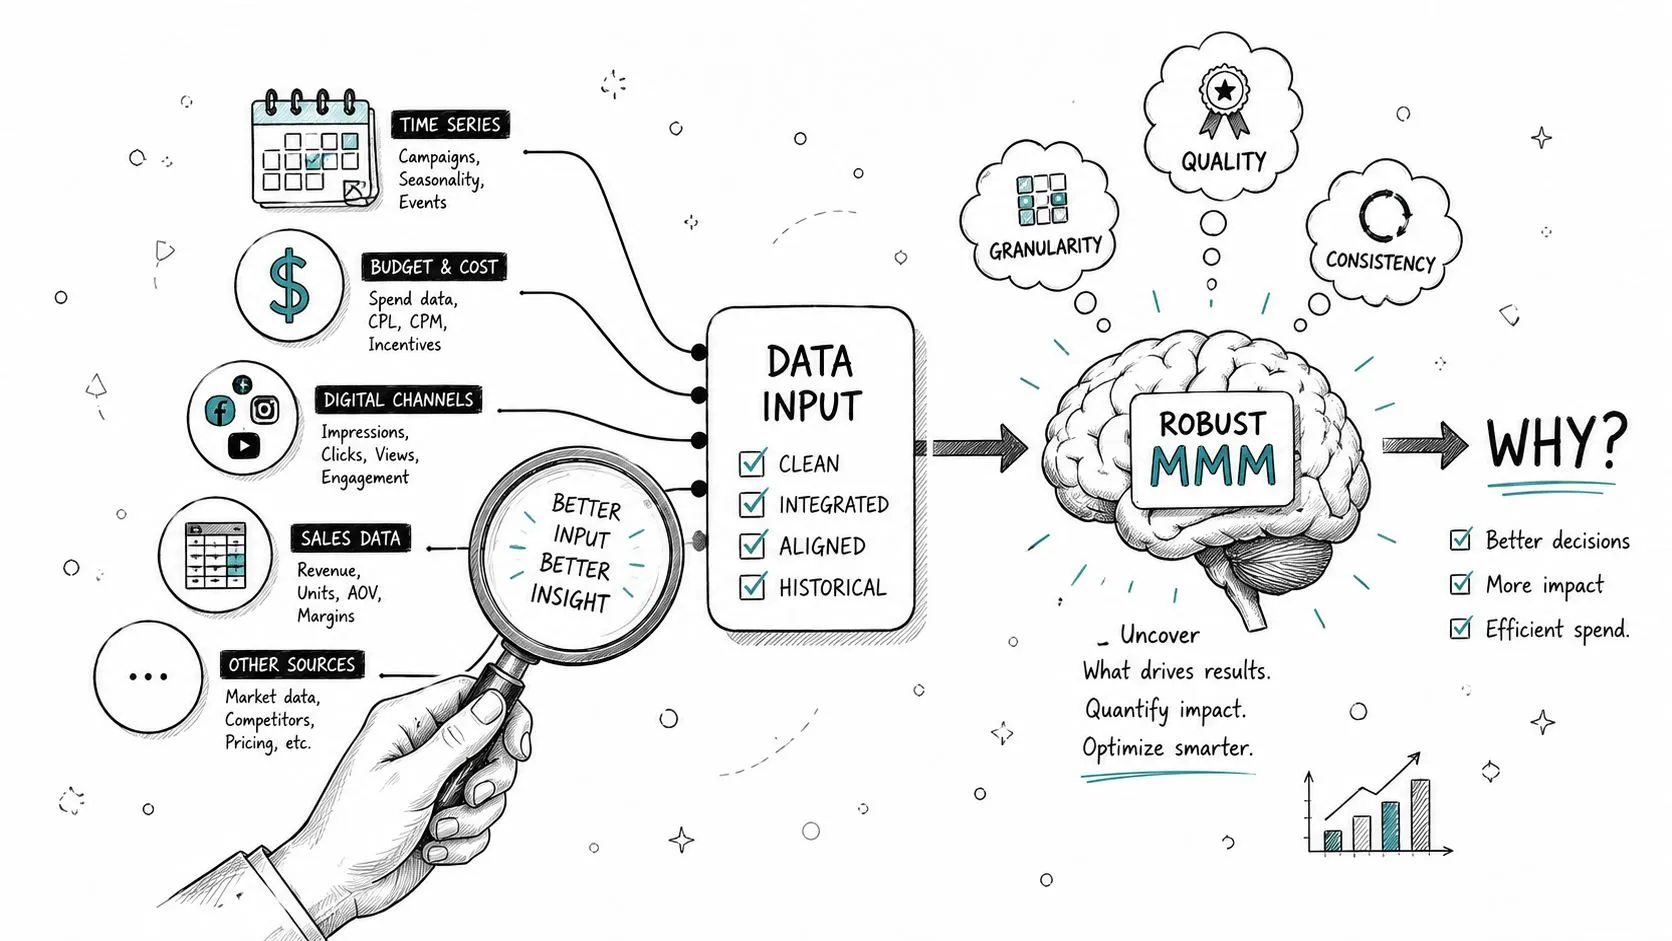
Most MMM failures don't begin in modeling. They begin in data assembly, naming inconsistencies, missing weeks, and channel definitions that changed three times without documentation.
A critical requirement is history. MMM needs enough time-series variation to separate real channel effects from seasonality and noise. Improvado's guide to marketing mix modeling states that MMM necessitates 18 to 24 months of weekly observations, with 80 to 100 data points as the floor for reliable regression analysis. The same source notes that this history is what allows adstock and saturation to be estimated with enough stability to support budget decisions.
What the model needs every week
A workable MMM dataset usually pulls from four layers.
- Media inputs: Spend is mandatory. Impressions, clicks, or reach can help when they're reliable and consistently defined.
- Business outcomes: Revenue, orders, leads, subscriptions, or pipeline creation. Pick the KPI that matches the decision you need to make.
- Commercial context: Promotions, pricing changes, launches, stock issues, and distribution shifts.
- External controls: Seasonality, holidays, macro context, and major market events that materially affect demand.
What matters most isn't volume. It's consistency. If paid social includes different tactics over time but keeps the same label, the model sees one variable where the business executed several different strategies.
What usually breaks the data before modeling starts
The most common issues are boring and damaging.
- Taxonomy drift: Channel names and campaign hierarchies change over time.
- Calendar gaps: Missing weeks or partial periods distort the time series.
- Metric mismatches: Finance revenue, ecommerce revenue, and CRM conversions don't reconcile.
- Granularity problems: One source is daily, another weekly, another monthly, and none align cleanly.
That's why the data preparation work is usually more important than the first model run. Teams that treat MMM as an analytics product, not a one-off analysis, invest early in governed tables, QA checks, and reusable transformations. Work on improving data quality pays off directly here because MMM amplifies every inconsistency in the source data.
Clean weekly time series beat messy “richer” datasets almost every time.
A strong dataset also needs documentation. Every variable should have an owner, a definition, and a history of changes. Without that, the team can still build a model. They just won't be able to defend it when someone asks why affiliate spend suddenly became more productive after a naming change.
How to Interpret MMM Outputs and Drive Strategy
The hard conversation starts after the model run.
A CMO sees paid search with the highest historical ROI and wants to increase budget there next quarter. Finance sees total media contribution flattening and asks for cuts. Growth points out that branded search is harvesting demand created elsewhere. All three can be looking at the same MMM output and reach different conclusions if the output layer is weak.
Interpretation is the operating system for MMM. The model needs to translate into budget moves, testing priorities, and a shared view of what is driving demand. In practice, the outputs that matter most are contribution, ROI, marginal return, and elasticity. Each answers a different question, and treating them as interchangeable usually leads to bad budget decisions.
Start with contribution over time
Channel rankings are rarely the best first view. Contribution trends are.
A good decomposition shows how much demand came from baseline factors, media, promotions, pricing, and other modeled effects by period. That view helps stakeholders separate growth that marketing created from demand the business would have captured anyway. It also makes it easier to spot periods where promotions or seasonality are getting credit that teams want to assign to media.
Three cuts usually matter:
- Base versus incremental contribution: This anchors the discussion in what marketing changed.
- Channel contribution by period: A yearly average can hide saturation, creative fatigue, or shifts in channel role.
- Promotion and pricing effects: These need their own lines, or media ROI gets overstated fast.
This is also where interpretation benefits from an in-warehouse workflow. Analysts can trace a contribution chart back to governed transformations, campaign mappings, and business definitions instead of asking a vendor to explain a black-box number. Teams already investing in a modern data stack for analytics workflows usually get better adoption because the outputs are inspectable.
Average ROI is descriptive. miROAS is for decisions.
Average ROI explains how a channel performed across the spend levels already observed. That is useful for retrospective reporting. It is weaker for next-quarter planning.
Budget decisions depend on marginal return. miROAS estimates what the next unit of spend is likely to produce, given the current spend level and the fitted response curve. A channel can post strong historical ROI and still be a poor place to add money if the curve is flattening. The reverse is also true. A channel with lower average ROI may still deserve more budget if it is far from saturation and the marginal return is still attractive.
That distinction matters in portfolio planning. Search often looks efficient because it captures existing demand well. Video or upper-funnel social may look less efficient on an average basis while still creating future demand that keeps lower-funnel channels productive.
Use elasticity to set the size of the move
Elasticity answers a different question. It estimates how sensitive outcome volume is to changes in spend, price, or another input. That makes it useful when the team is debating the size of a reallocation, not just the direction.
If paid social has a stronger marginal return than display, that does not mean budget should shift aggressively in one step. Elasticity and the response curve help set the range where the recommendation is still credible. Outside that range, the model is extrapolating, and confidence should drop.
Good readouts make that explicit. Show the recommended move, the likely impact range, and the assumptions behind it.
For smaller operators who are not building a full MMM program yet, resources on how to improve small business ad ROI can still help frame efficiency decisions, even if the measurement stack is lighter.
Turn outputs into a planning routine
MMM earns trust when it changes recurring decisions, not when it produces a polished deck once a quarter.
A practical review process usually includes these steps:
- Read contribution before efficiency. Confirm what drove volume in the last period before debating budget shifts.
- Use miROAS for reallocations. Reserve average ROI for context, not for the final budget call.
- Separate channels that harvest demand from channels that create it. They play different roles and should not be judged with one metric.
- Run scenarios before the finance meeting. Compare a few realistic budget plans instead of defending one static recommendation.
- Show uncertainty in plain language. Ranges, assumptions, and known model limits build more trust than false precision.
The final deliverable should feel less like a statistical appendix and more like a decision product. Marketing needs clear actions. Finance needs defensible assumptions. Data teams need output definitions that can be refreshed, audited, and reused. When those pieces are in place, MMM stops acting like a legacy modeling exercise and starts functioning as a modern analytics capability the business can use every planning cycle.
Building MMM In-Warehouse on a Modern Data Stack
A common failure pattern looks like this. Marketing wants updated ROI guidance before the next planning cycle, finance wants numbers it can reconcile to booked revenue, and the MMM output is stuck behind a vendor refresh queue. By the time the model is rerun, channel mix, promotions, and tracking rules have already changed.

That gap is why in-warehouse MMM matters. The primary constraint is usually not the regression itself. It is the operating model around data ingestion, taxonomy control, refresh cadence, and output access.
Vendor-led MMM can still be useful, especially for teams that need outside support on methodology or have limited data engineering capacity. The trade-off is slower iteration and less visibility into the assumptions that shape the result. If spend mappings change, a new retail promo launches, or the business wants a different geographic cut, internal teams often have to wait for someone else to rebuild the pipeline.
Why black-box MMM programs stall
The problem starts when data prep, feature engineering, model code, and reporting logic all live outside the warehouse.
Three things usually follow:
- Pipeline fixes become service requests: A broken channel mapping or missing cost feed turns into a queue, not a quick patch.
- Model refreshes lag the business: Teams cannot test new hypotheses on the same cadence as planning and budget reviews.
- Trust stays shallow: Stakeholders see outputs, but they cannot inspect input tables, transformations, or parameter choices.
I have seen this become an adoption issue faster than a modeling issue. Executives will accept uncertainty if they can trace how the estimate was built. They rarely accept a recommendation they cannot audit.
What an in-warehouse architecture looks like
A workable setup is simpler than many teams expect. Land raw media, conversion, sales, promo, and calendar data in the warehouse. Standardize taxonomies and time grains in transformation models. Build governed fact tables for spend, impressions, outcomes, pricing, promotions, and other controls. Then train and refresh the MMM from those shared tables instead of one-off extracts.
That pattern fits naturally with a modern data stack for analytics teams. The point is not tool fashion. The point is reproducibility, version control, and shared access across marketing, finance, and data.
A practical stack often includes:
- SQL models for source cleanup and conformed dimensions
- dbt or similar transformation workflows for testing and documentation
- Python notebooks or production jobs for adstock, saturation, and model fitting
- Scheduled runs tied to the business review cadence
- BI or app-layer access so non-technical users can inspect results and scenarios
Build the marketing data model once, then reuse it for diagnostics, model training, scenario planning, and reporting.
That reuse matters. If the spend table in the model does not match the spend table in finance reporting, every results review turns into a reconciliation meeting.
How teams operationalize MMM after launch
The first shipped model is the start of the program.
Teams that keep MMM useful over time usually put a few habits in place:
- Stabilize metric definitions: Spend, conversions, revenue, promotions, and channel groupings need controlled definitions and change logs.
- Set a refresh cadence that matches decision speed: Weekly or biweekly updates are common for fast-moving businesses. Monthly may be enough for slower planning cycles.
- Document modeling choices: Adstock windows, saturation functions, priors, exclusions, and holdout decisions should be written down and reviewed.
- Publish outputs in business tools: Marketing leaders should be able to inspect contribution, efficiency curves, and budget scenarios without opening a notebook.
- Assign clear ownership: Data engineering owns pipelines, analytics or data science owns modeling, and marketing operations validates taxonomy and campaign context.
A short product walkthrough helps make that operating model concrete:
Building MMM in the warehouse changes the role of the method. It stops being a periodic consulting deliverable and becomes a reusable analytics product. Data teams can inspect the full chain from source data to scenario output, marketers can ask better questions without waiting on a black box, and finance gets assumptions that can be reviewed against the same systems used for planning.
Common Pitfalls and Advanced Modeling Challenges
A team ships its first in-warehouse MMM, shows a neat contribution chart to executives, and gets an immediate question: why did paid social lose credit the same quarter search and promotions increased? That is where weak model specification turns into a business problem. The hard part is rarely fitting the regression. The hard part is deciding what the model is allowed to claim, given the data history, channel overlap, and operational context behind the numbers.
Multicollinearity is still expensive because modern media plans are coordinated on purpose. Search, paid social, affiliates, email, and promotions often move together around launches, season peaks, and pricing events. A model can still be useful in that setting, but channel-level splits become less stable. Good teams respond by using sensible priors, grouping channels where separation is not identifiable, and validating whether budget recommendations remain directionally consistent under small specification changes.
Omitted variable bias causes more damage than many teams expect. Distribution changes, creative refreshes, pricing moves, merchandising decisions, stockouts, and major business events often live in planning docs or Slack threads instead of warehouse tables. If those drivers never make it into the dataset, media variables absorb the effect. The result looks precise and can be badly wrong.
Executive trust usually breaks on interpretation, not math.
MMM supports decision-making when analysts present it as a constrained estimate with uncertainty, not as channel truth carved in stone. That matters even more in an in-warehouse program, where more people can inspect outputs and run scenarios. Transparency helps, but it also means every assumption needs to hold up under scrutiny from finance, marketing, and data teams.
Emerging channels create the hardest identification problems
TV is familiar. Sparse digital channels are harder.
Influencer, podcasts, creator partnerships, retail media tests, and newer social inventory often have short histories, irregular spend patterns, and shifting measurement definitions. Many of these channels ramp fast, then change format or targeting before enough stable history accumulates. A standard regression will produce an answer anyway. That does not mean the answer is reliable enough to use for budget moves.
For those channels, the practical options are usually:
- Bayesian priors: Use prior information when the observed history is too thin to estimate a stable effect from data alone.
- Substitution priors: Borrow structure from a neighboring channel with similar auction dynamics, audience behavior, or funnel position.
- Grouped models first: Estimate a broader channel family before splitting into subchannels once spend history and taxonomy are stable.
- Explicit uncertainty ranges: Show wider intervals for sparse channels so decision-makers can see what is known and what is still weakly identified.
Sometimes the right call is to leave a channel out of the decomposition and track it separately until the data improves. Sometimes it belongs in the model, but only as part of a broader group. Sometimes it deserves its own coefficient with strong priors and clear caveats. Those are modeling decisions, but they are also operating decisions. They depend on whether the warehouse has reliable inputs, whether marketing can explain campaign changes, and whether stakeholders will accept uncertainty instead of a false sense of precision.
That is one reason modern MMM should live close to the warehouse rather than inside a vendor black box. Teams need to inspect source tables, rebuild transformations, audit assumptions, and explain why a coefficient moved after taxonomy changes or a backfill. The method is statistical. The program is operational.
Querio helps data teams build analytics directly on the warehouse so measurement programs like MMM don't get trapped in brittle exports, black-box tooling, or endless analyst queues. If you want a more transparent, self-serve way to operationalize marketing analytics, explore Querio.