Business Intelligence
Best AI Dashboard Generators
Compare top AI dashboard generators by features, integrations, pricing, and security to find the right tool for turning data into fast, actionable insights.
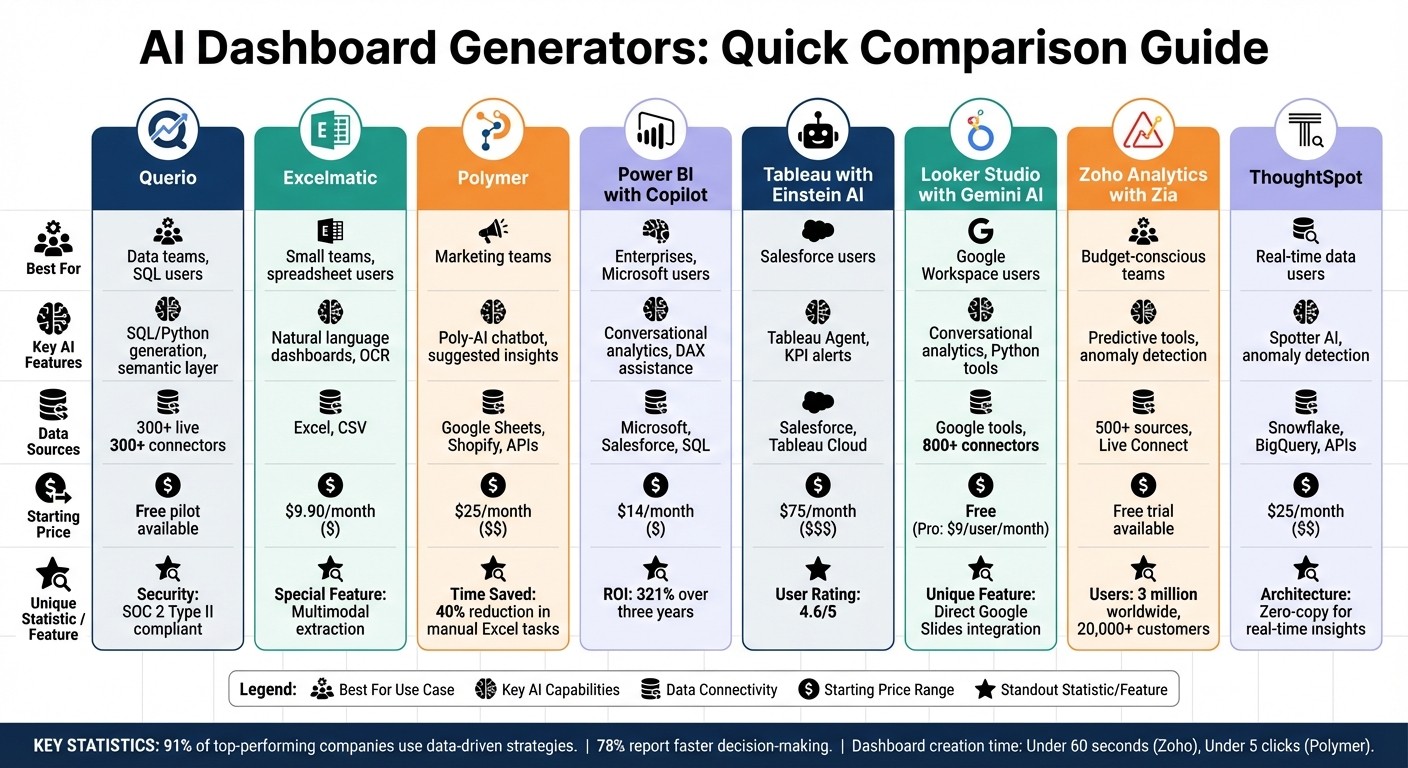
AI dashboard generators simplify turning raw data into actionable insights using plain English prompts. These tools help businesses save time, improve accessibility, and make data-driven decisions faster. Here's a quick look at the top options:
Querio: Converts plain-text queries into SQL/Python, integrates with 300+ data sources, and ensures security with SOC 2 compliance.
Excelmatic: Ideal for small teams, transforming spreadsheets into dashboards with natural language commands and automated insights.
Polymer: Offers conversational AI for quick visualizations, great for marketing teams needing fast insights from platforms like Shopify or Google Analytics.
Microsoft Power BI with Copilot: Enterprise-focused, integrates with Microsoft 365, and simplifies complex tasks with AI-driven visuals and summaries.
Tableau with Einstein AI: Combines Salesforce integration and AI features like Tableau Agent for conversational insights and KPI monitoring.
Google Looker Studio with Gemini AI: Free platform with AI-powered analytics, seamless integration with Google Workspace, and Python-based calculations.
Zoho Analytics with Zia: Budget-friendly, supports natural language queries, and includes predictive tools for forecasting and anomaly detection.
ThoughtSpot: Provides real-time insights with zero-copy architecture and AI-driven "Spotter" for natural language querying.
Quick Comparison
Platform | Best For | AI Features | Data Sources | Starting Price |
|---|---|---|---|---|
Querio | Data teams, SQL users | SQL/Python generation, semantic layer | 300+ live connections | Free pilot available |
Excelmatic | Small teams, spreadsheet users | Natural language dashboards, OCR | Excel, CSV | $9.90/month |
Polymer | Marketing teams | Poly-AI chatbot, suggested insights | Google Sheets, Shopify, APIs | $25/month |
Power BI with Copilot | Enterprises, Microsoft users | Conversational analytics, DAX assistance | Microsoft, Salesforce, SQL | $14/month |
Tableau with Einstein AI | Salesforce users | Tableau Agent, KPI alerts | Salesforce, Tableau Cloud | $75/month |
Looker Studio with Gemini AI | Google Workspace users | Conversational analytics, Python tools | Google tools, 800+ connectors | Free |
Zoho Analytics with Zia | Budget-conscious teams | Predictive tools, anomaly detection | 500+ sources, Live Connect | Free trial available |
ThoughtSpot | Real-time data users | Spotter AI, anomaly detection | $25/month |
Each tool has its strengths, from advanced AI capabilities to budget-friendly options. Choose based on your team's needs, data infrastructure, and goals.
AI Dashboard Generators Comparison: Features, Pricing, and Best Use Cases
Create Dashboards in Seconds With AI (It's Mind-Blowing 🤩)
1. Querio
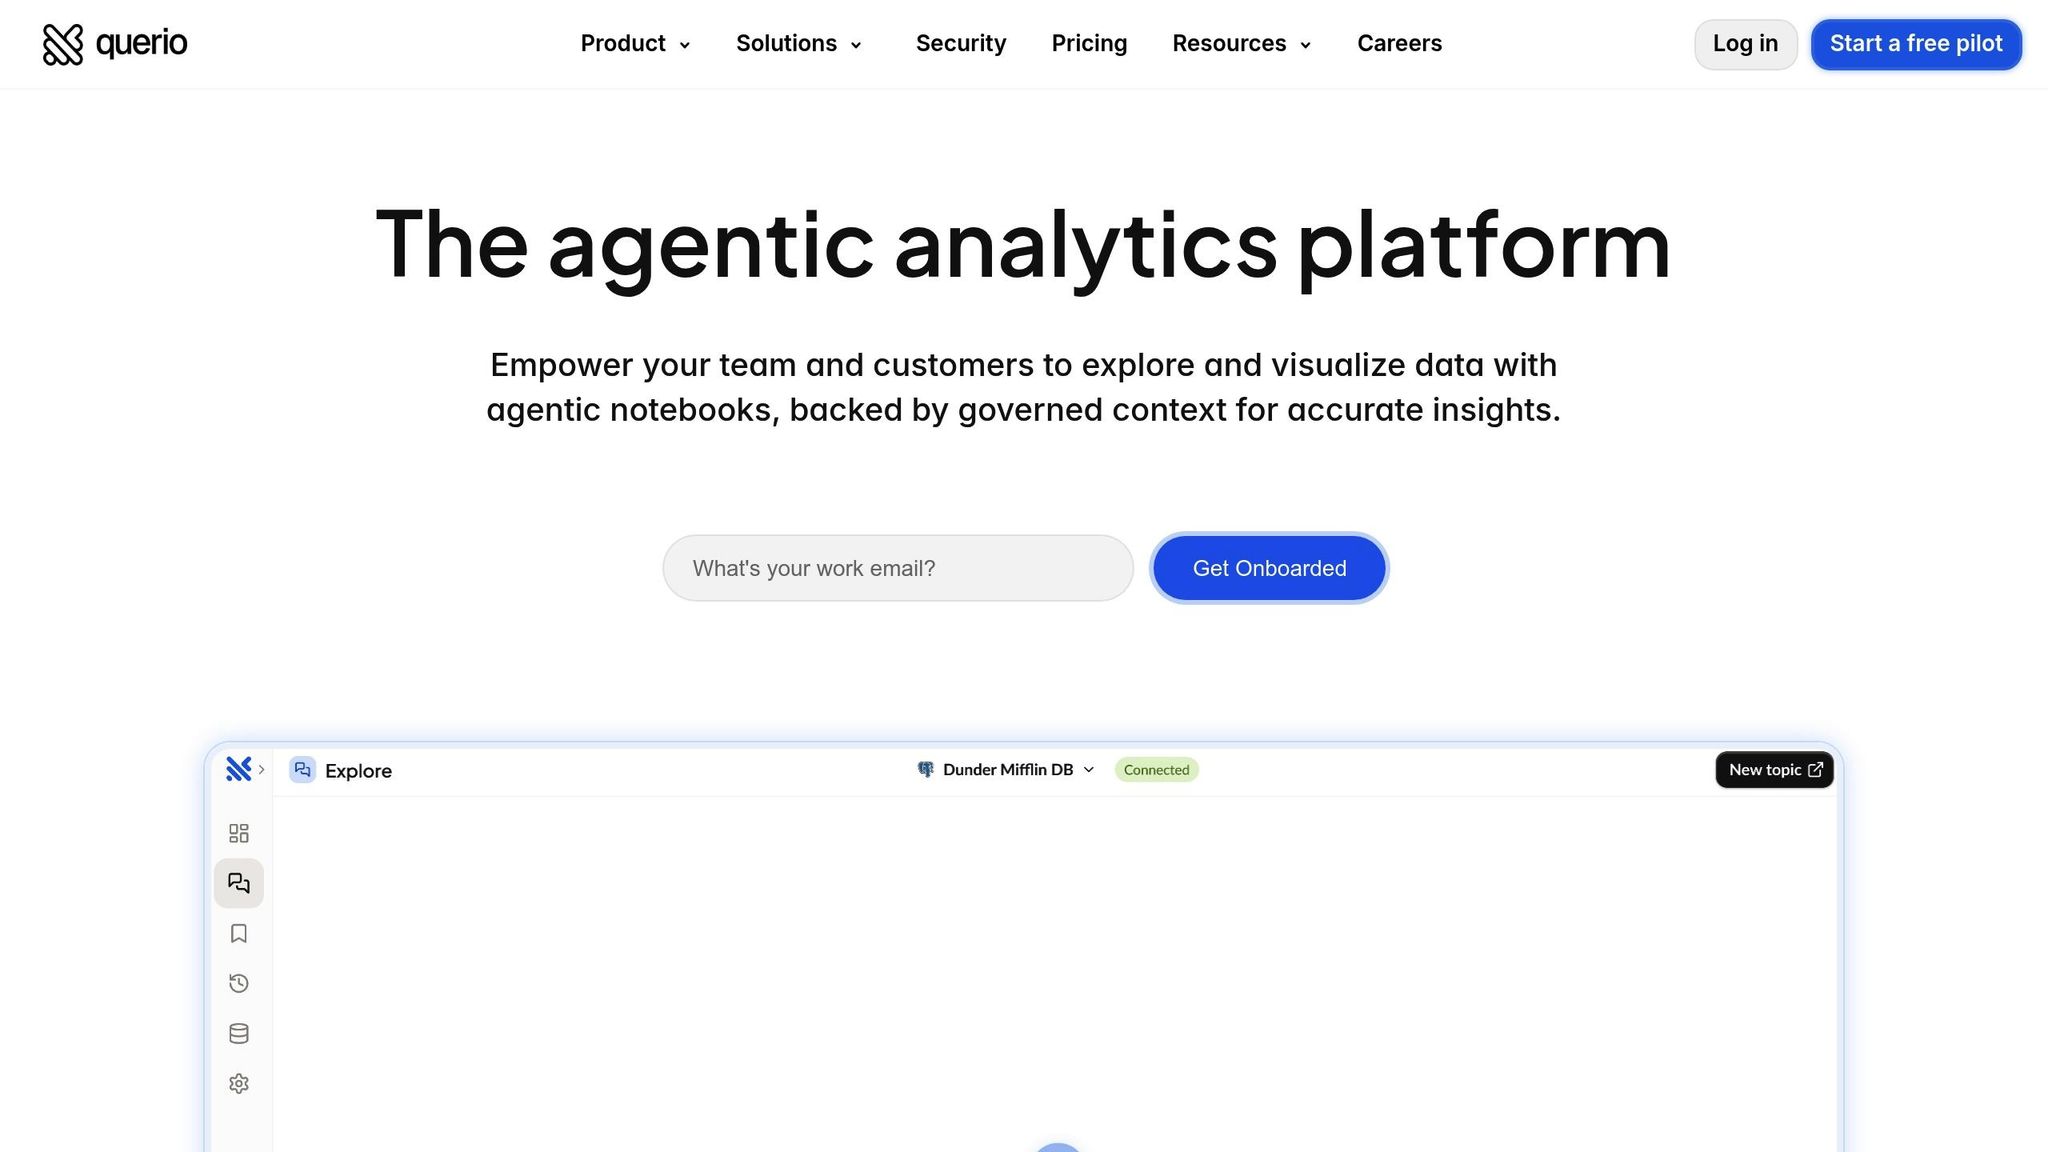
Querio is an AI-powered analytics workspace designed for teams that want to ask business questions in plain English and get precise answers directly from their live data warehouse. By transforming plain-language queries into SQL and Python, Querio runs them securely against your warehouse using encrypted, read-only connections. This approach ensures efficient and transparent analytics.
AI Features
Querio's AI takes plain-text questions and converts them into executable SQL and Python code. The platform even displays the generated code, allowing users to inspect, tweak, and reuse it as needed. For more advanced analytics, Querio provides AI Python Notebooks, enabling iterative analysis within a unified environment.
Data Integration
With connections to over 300 data sources, Querio integrates directly with your existing data warehouse via live, read-only connections. This setup minimizes security risks and ensures data accuracy. For businesses in the U.S., dashboards are automatically formatted to reflect USD currency, MM/DD/YYYY dates, and proper number formatting.
Governance and Security
Querio is SOC 2 Type II compliant, offering robust role-based access controls (RBAC) to manage who can view or query specific datasets. Its semantic layer allows data teams to define joins, metrics, and business terms once, applying these definitions consistently across all reports and dashboards. This ensures uniform metric definitions throughout the platform.
Flexible Pricing and Deployment
Querio provides a free pilot program, giving teams the opportunity to explore the platform before committing. While positioned as a premium solution, its pricing remains competitive. Teams can choose between a cloud-based SaaS option or a self-hosted deployment, depending on their infrastructure needs. Enterprise-level AI features are included across all plans.
2. Excelmatic
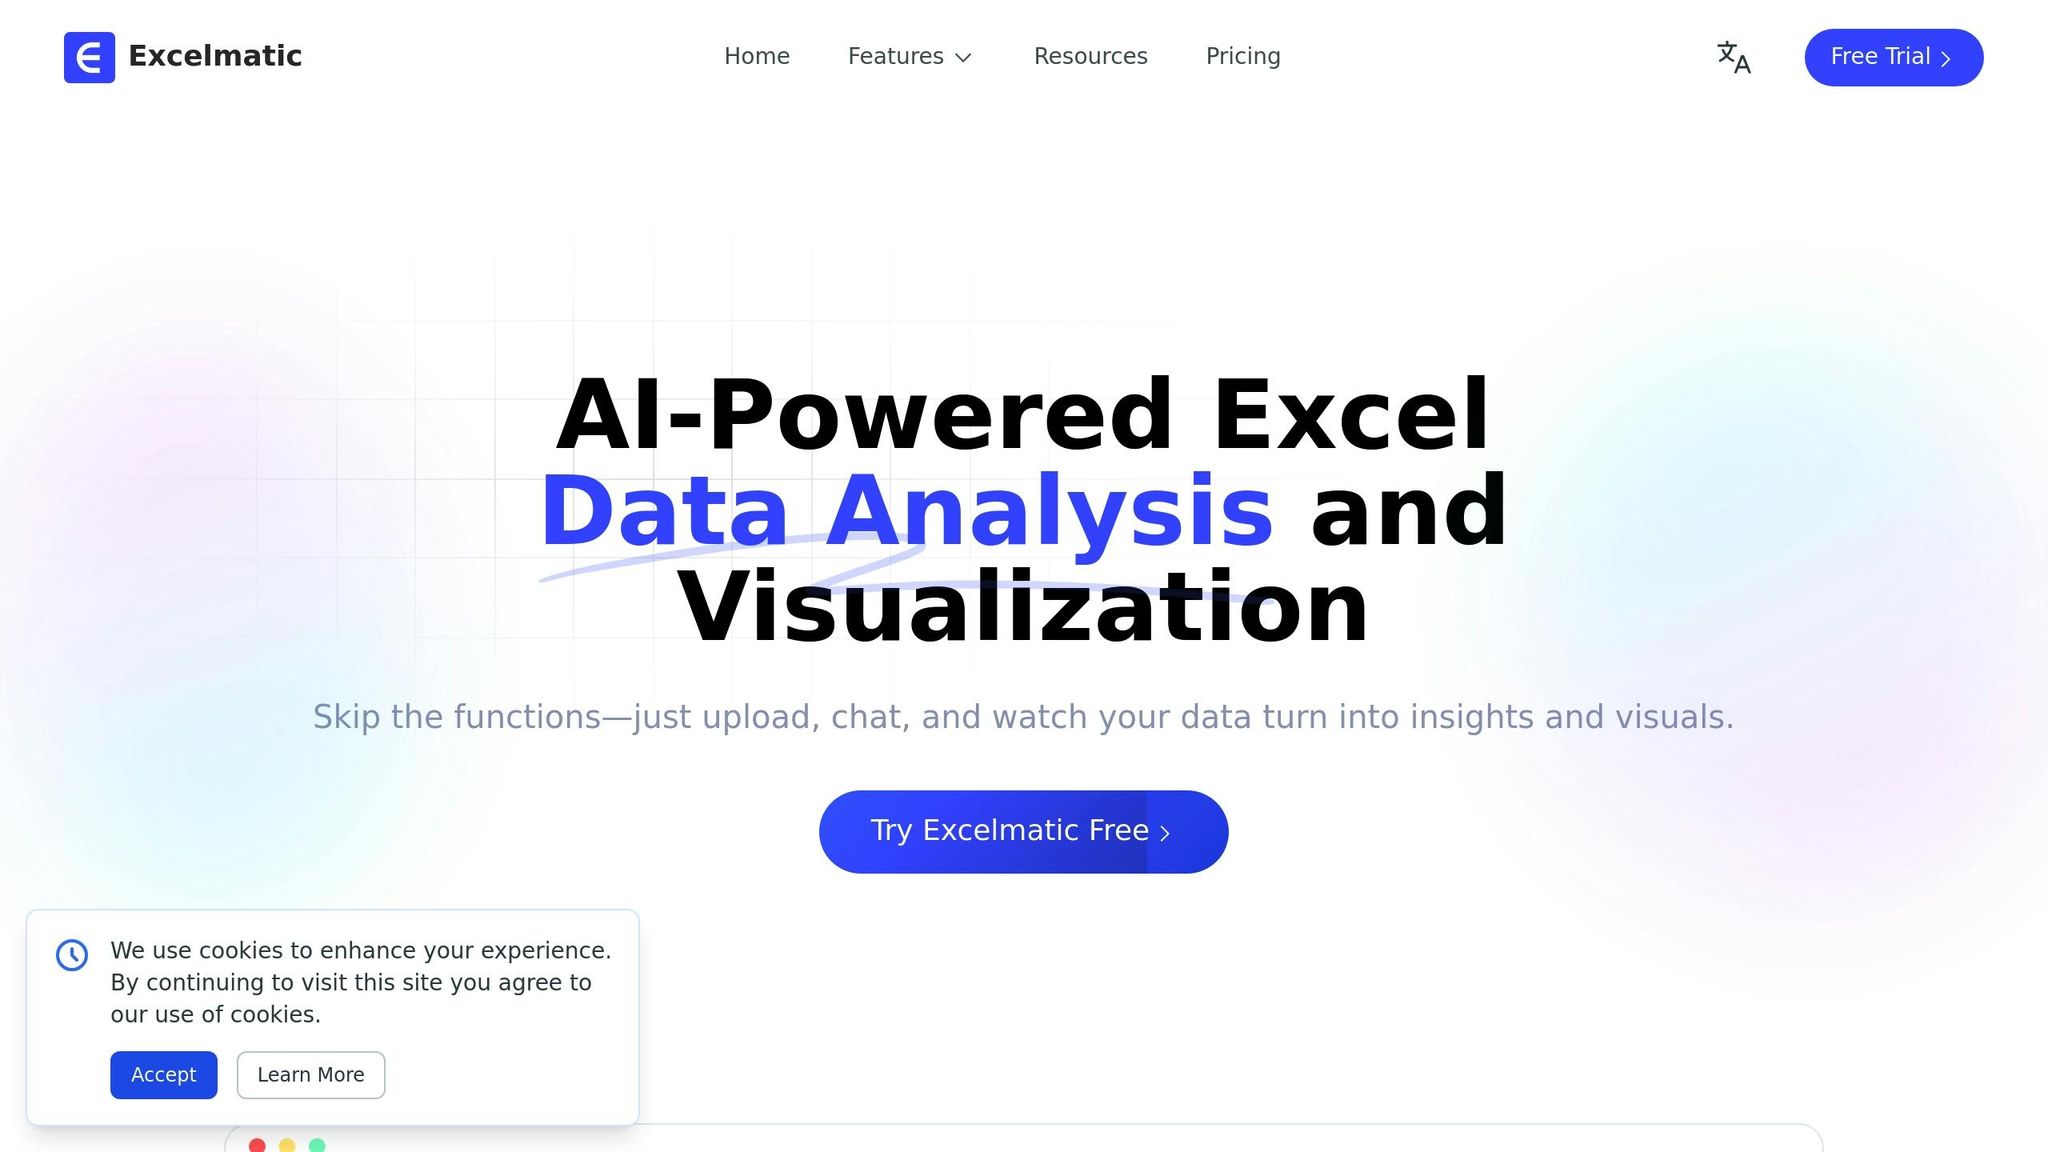
Excelmatic is a browser-based AI dashboard generator that makes creating dashboards from spreadsheets incredibly fast and simple. With its "Upload, Ask, Get" process, users can transform Excel and CSV files into fully functional dashboards in just seconds. This efficiency aligns with the broader trends in AI-powered analytics tools.
AI Capabilities
Excelmatic uses a natural language interface to turn plain-English commands (like "Show sales trends by region") into fully interactive dashboards. Users can also make real-time adjustments through conversational editing [1][5].
Sarah Chen, a Data Analyst at TechCorp, shared her experience: "Excelmatic has completely transformed how we analyze our data. The automated insights and visualizations save us hours of work every week" [2].
The platform comes equipped with advanced features like automated data cleaning, anomaly detection in BI dashboards, and a formula assistant that converts natural language into complex Excel functions [2][4]. Higher-tier plans even include predictive analytics, which can forecast trends up to three times faster than traditional methods [6]. A standout feature is multimodal extraction, which uses OCR technology to convert screenshots, photos, and PDF reports into editable Excel data. This data can then be seamlessly integrated into dashboards [1][3].
Data Connectivity
Excelmatic focuses on file-based data input, supporting direct uploads of .xlsx and .csv files. Depending on the subscription plan, users can upload files with varying size limits. The platform also allows users to merge multiple reports or datasets into a single master file, automatically adding identifying columns based on file names. Storage capacity ranges from 500MB to 10GB, depending on the plan [2].
Governance Features
To ensure data security, Excelmatic employs bank-level encryption for both data transmission and storage. Users can delete images from their conversion history at any time, offering an added layer of privacy [2][4]. For organizations with strict compliance needs, Excelmatic provides on-premises deployment options, allowing companies to host the platform within their own infrastructure [2][4].
Pricing and Scalability
Excelmatic is designed to be an affordable and flexible solution for small to medium-sized teams. It offers three subscription tiers: Essential ($9.90/month), Professional ($29.90/month), and Premium ($59.90/month). The Essential plan includes 10 dashboards per month, each with 20 editable blocks, while the Premium plan offers 100 dashboards with unlimited blocks [2]. New users can take advantage of a 7-day refund policy for limited use [2]. While the current focus is on individual users and smaller teams, a version tailored for team collaboration is currently in development.
3. Polymer
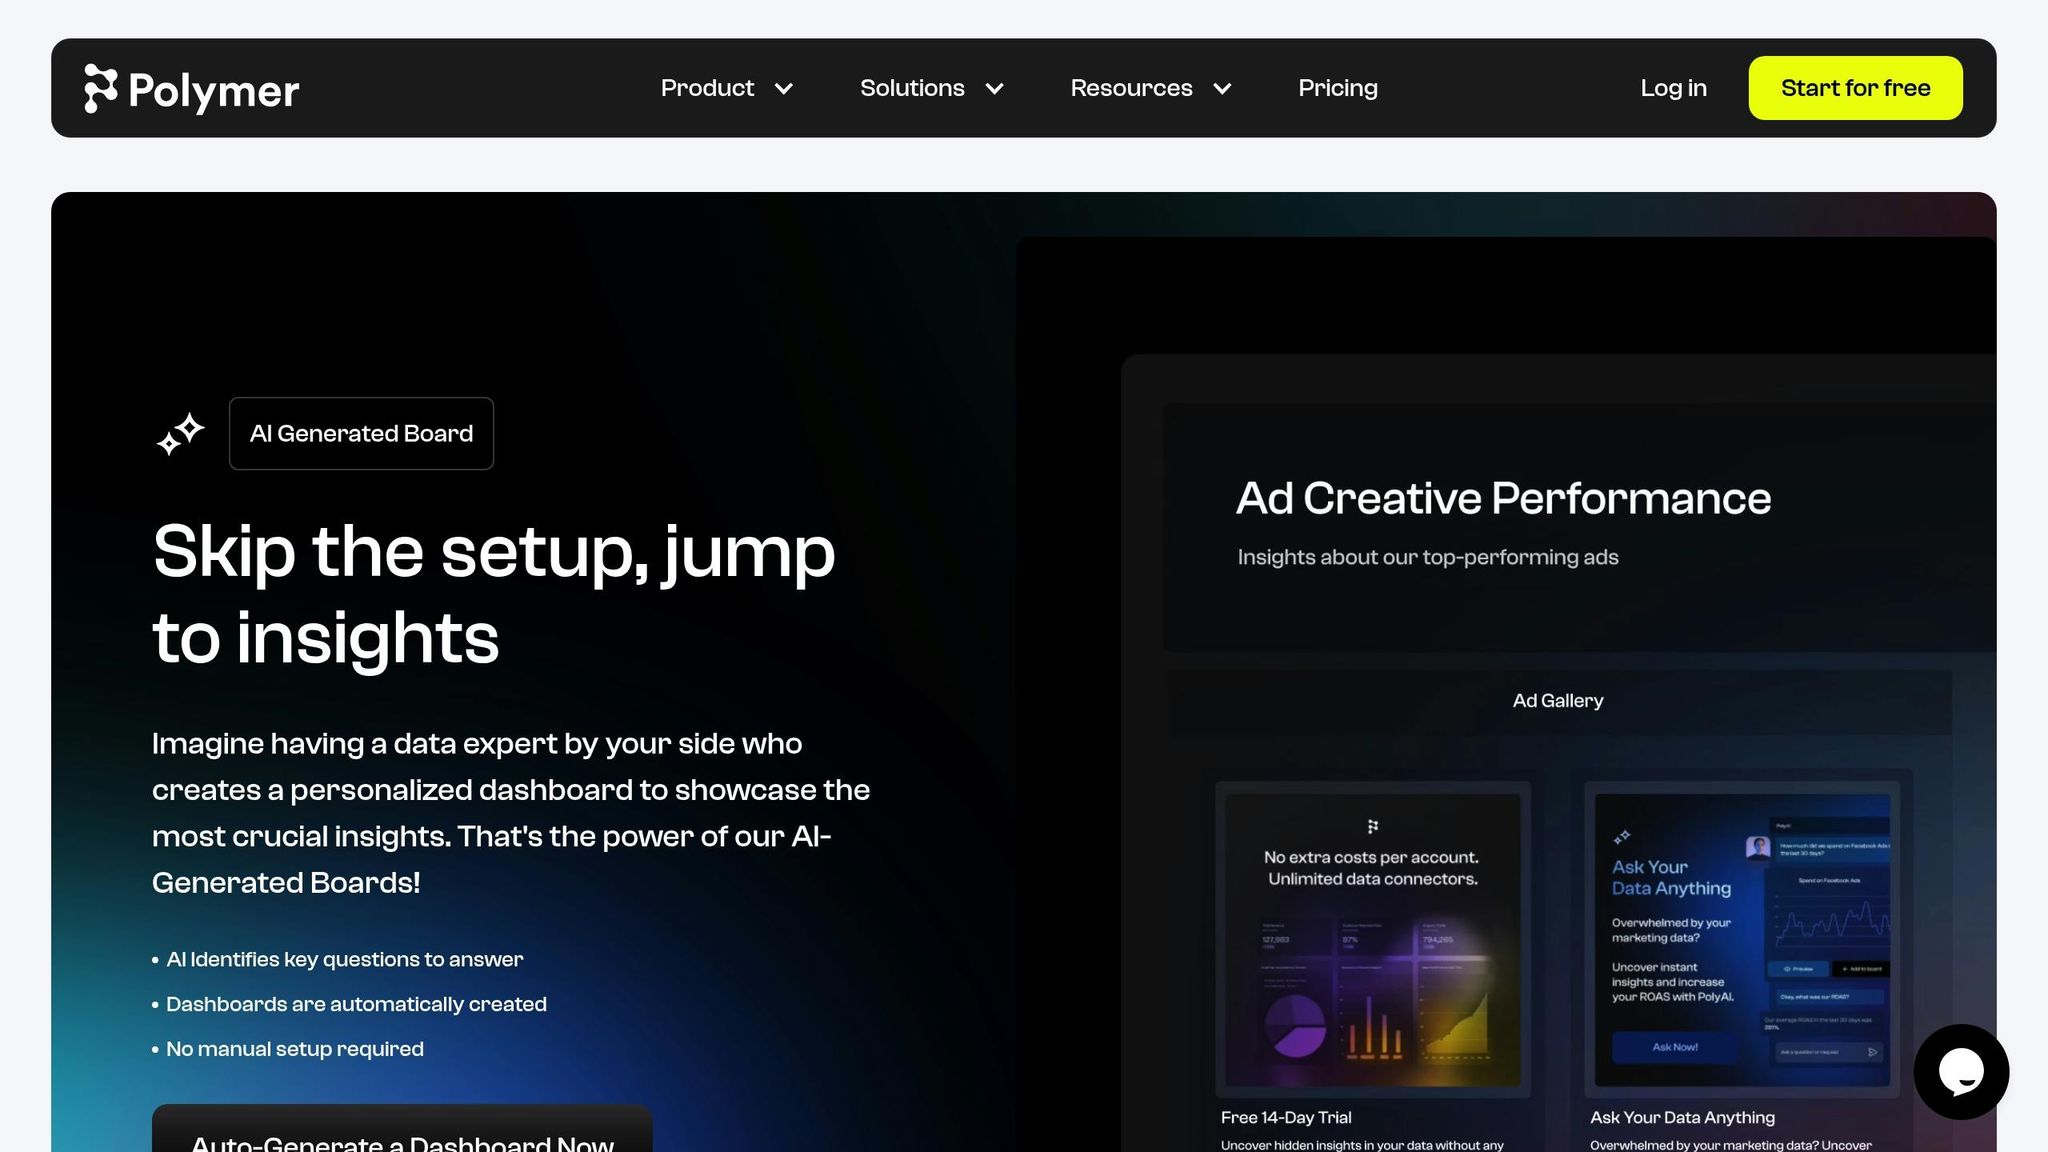
Polymer is a web-based AI dashboard platform designed to transform raw data into visual insights with the help of conversational AI. One of its most impressive features is the ability to create a dashboard in under five clicks by identifying key questions within datasets [7]. This rapid functionality addresses a major challenge faced by over 65% of businesses today - managing overwhelming amounts of data [7]. This streamlined process lays the foundation for Polymer's powerful AI-driven tools.
AI Capabilities
At the heart of Polymer is the Poly-AI conversational AI data analyst chatbot, which enables users to interact with their data in plain English. With no coding required, users can ask questions and receive instant visualizations [8]. Beyond generating charts, Polymer adds concise text explanations for each visualization, simplifying the process of identifying trends and outliers [7]. The platform also includes a Suggested Insights feature, which recommends specific data questions and generates visualizations with a single click [10].
"You can literally ask any question about a dataset and get an answer. I think the world's been waiting for this for a long time."
Erik Fogg, Co-founder, ProdPerfect [11]
Craig Belcher, founder of YourPPCpro, highlighted how Polymer’s automated insights led to a 19% increase in ad conversions and cut client reporting time by two-thirds [11][9].
Data Connectivity
Polymer offers seamless integration with popular tools like Google Sheets, Excel, Facebook Ads, Google Ads, Shopify, Google Analytics 4, Airtable, Jira, and Zendesk [7]. Data imports take less than 30 seconds, and users can schedule automatic refreshes hourly, daily, or weekly [7]. For databases, Polymer connects with platforms like BigQuery and supports API integrations. Additionally, it works with third-party ETL tools such as Windsor.ai and Dataddo [9].
Governance Features
Polymer prioritizes data security and accessibility with features like automated user permissions via API [9]. Enterprise workspaces allow organizations to create tailored environments for different teams, ensuring data remains relevant and secure [11]. Reports can be toggled between private and public modes, with public reports accessible through shareable links [7].
Pricing and Scalability
Polymer’s pricing is designed to suit a range of users, from individual analysts to large enterprises. The Starter plan begins at $25 per month [7], while API access for developers starts at $500 per month [9]. This makes it a strong contender when evaluating the best embedded analytics tools for scaling software products. The platform claims to save users 40% of the time typically spent on manual Excel tasks [11]. For new users, Polymer offers a 7-day free trial with full access to all features [7].
"Polymer helped us automate our weekly reporting which previously took hours of manual, tedious work. We can now clearly see the big picture of our product development which enabled us to make decisions faster. Absolute game changer."
Jen Laing, VP of Operations, Causal IQ [7]
4. Microsoft Power BI With Copilot

Microsoft Power BI with Copilot brings advanced AI capabilities to Power BI, enabling users to create entire report pages using simple English prompts instead of manually designing charts [12][17]. It can also adjust existing visuals instantly - whether it’s changing chart types, tweaking data fields, or removing elements [12][19]. Below, we’ll explore how to use AI in data analytics, data connectivity options, governance tools, and pricing details.
AI Capabilities
With its conversational interface, Power BI with Copilot allows users to ask questions about their data and receive auto-generated visuals or narrative summaries. It simplifies complex tasks like creating and refining DAX formulas, offering suggestions and clarifications along the way [14][18][16]. The tool also enhances natural language data querying tools by recommending synonyms for data fields, making it easier to interact with datasets [14].
"Copilot in Power BI aims to help both Power BI developers and analysts create models and reports, while also giving business users new ways to consume those models and reports." - Microsoft [13]
It's worth noting that Copilot summaries are limited to visuals with fewer than 30,000 rows of data, and accuracy can drop for table visuals with more than 500 rows [15]. The AI identifies the top 20 relevant visuals in a report to generate summaries, providing clickable citations so users can trace the source visuals [15].
Data Connectivity
Power BI integrates smoothly with a variety of data sources, including Microsoft Excel, SharePoint, SQL Server, Azure, Dynamics 365, Google Analytics, Salesforce, Adobe Analytics, and GitHub [20]. However, there are some limitations: AI-driven page creation doesn’t support real-time streaming models, live connections to Analysis Services, or semantic models with implicit measures disabled [12][19]. Additionally, Copilot cannot handle custom visuals or intricate formatting changes through prompts [12][17].
Governance Features
Administrators have robust control over Copilot access, allowing them to enable or restrict it at the tenant or capacity level, or limit it to specific groups [13][16]. Developers can manage what Copilot processes by hiding certain pages, visuals, or fields from its context [13][14]. To maintain security, the platform filters out inappropriate prompts and includes citations in its summaries for verification [13][15]. Organizations can also use a dedicated Fabric Copilot Capacity (FCC) to centralize AI-related costs and ensure that essential business operations remain unaffected [13].
Pricing and Scalability
Accessing Copilot requires a paid Microsoft Fabric capacity (F2 or higher) or a Power BI Premium capacity (P1 or higher). A Power BI Pro or Premium Per User (PPU) license alone won’t grant access [16]. Power BI Pro is priced at $14.00 per user per month (billed annually), while Premium Per User costs $24.00 per user per month [21]. Organizations can save 40.5% by opting for Fabric Capacity Reservation instead of pay-as-you-go pricing [21]. A commissioned study revealed that businesses using Power BI Pro as part of Microsoft 365 E5 achieved a 321% return on investment over three years [22]. Keep in mind, new or scaled-up capacity may take up to 24 hours to activate Copilot features [16].
5. Tableau With Einstein AI
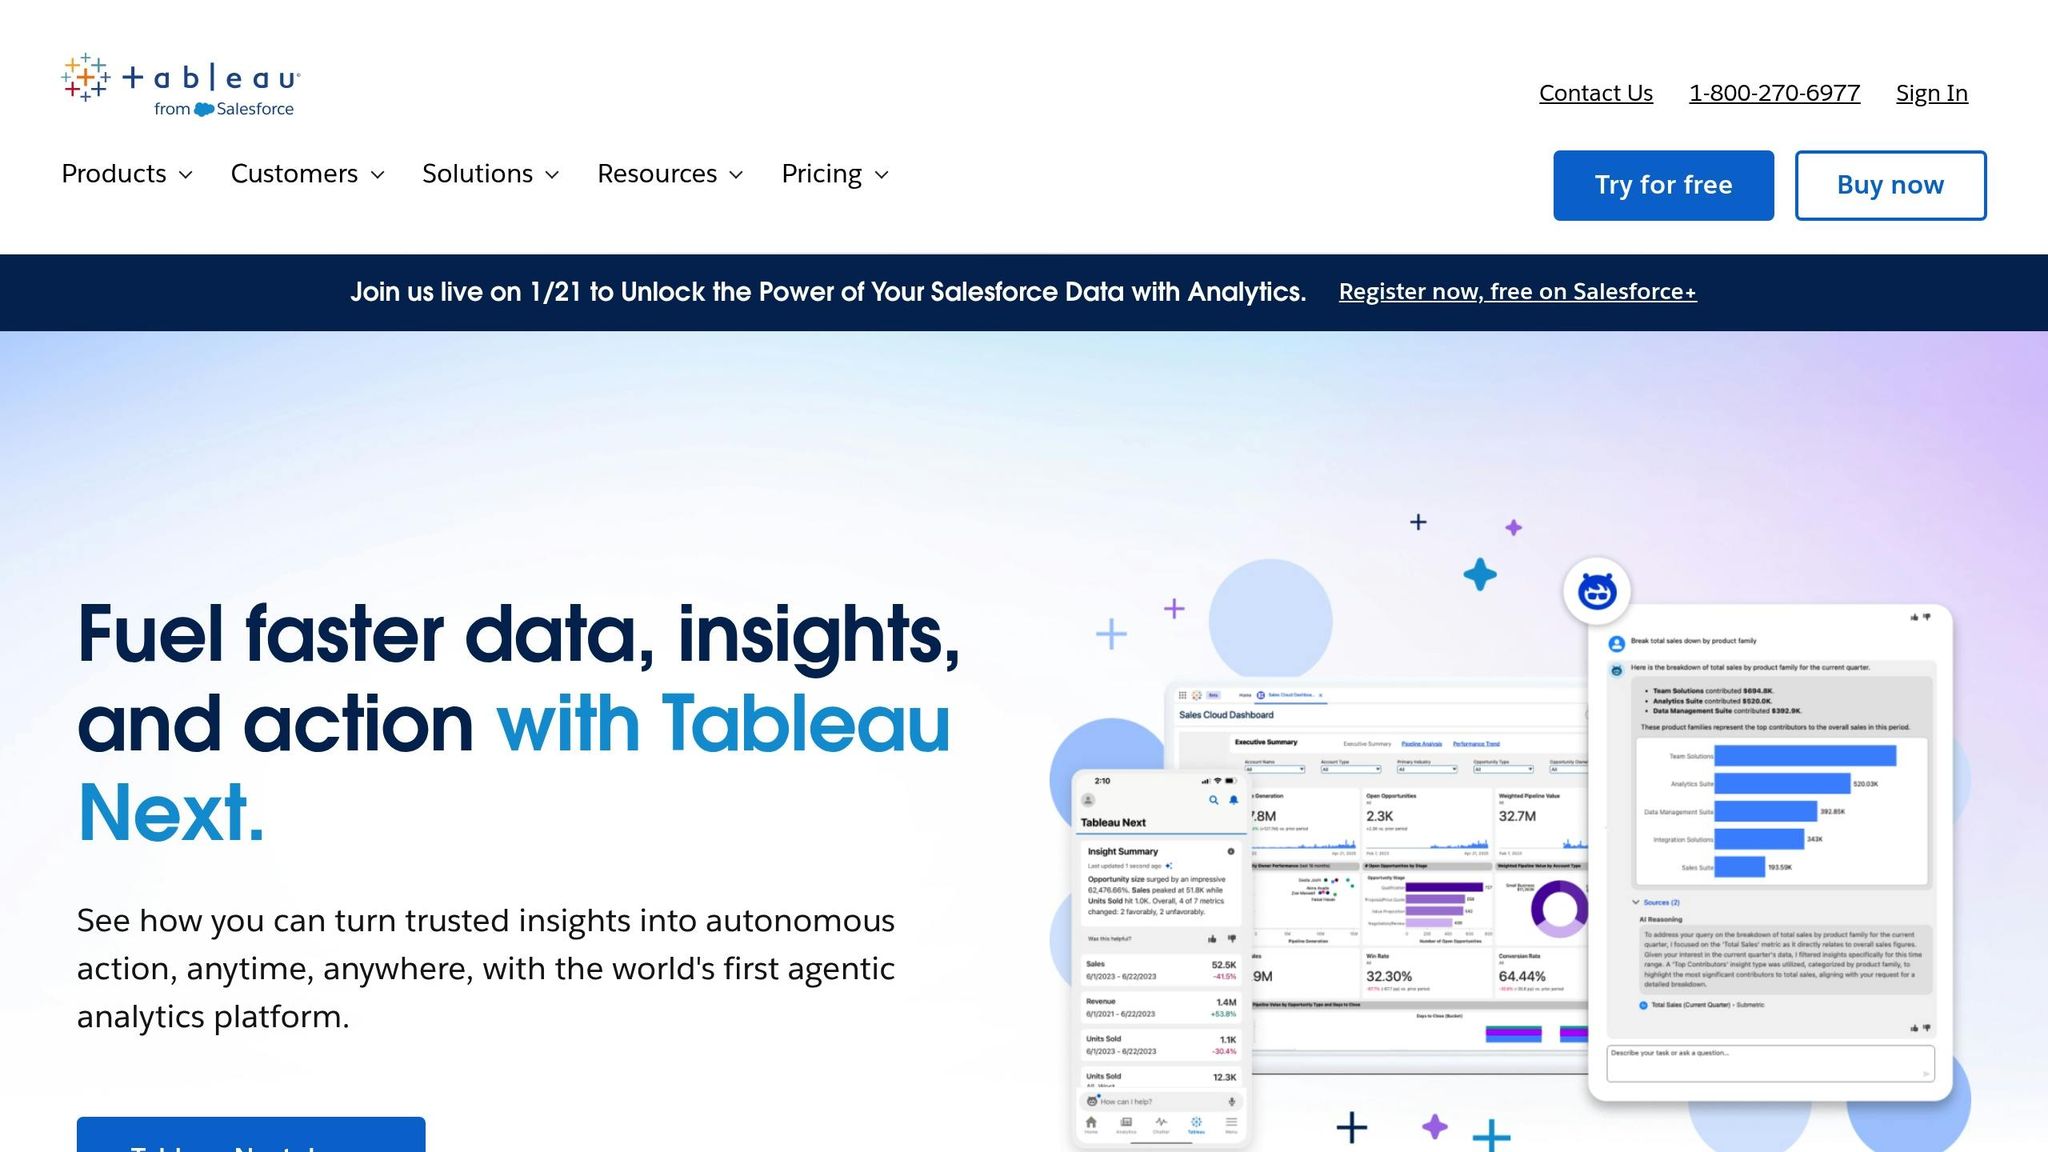
Tableau combined with Einstein AI brings a fresh way to interact with data through Tableau Agent, a conversational assistant that turns natural language prompts into visualizations and complex calculations [24][25]. Want to create aggregations, LOD expressions, or regex? Just describe what you need, and the AI takes care of the rest [27]. On top of that, Tableau Pulse keeps an eye on key performance indicators (KPIs), delivering summaries straight to Slack, Microsoft Teams, or email to help you understand data trends effortlessly [23][26]. Below, we break down the AI features, connectivity, security, and pricing that make Tableau with Einstein AI what it is.
AI Capabilities
Tableau Agent offers two standout skills. The Concierge skill identifies root causes in your data and suggests visualizations, while the Inspector skill monitors metrics and sends alerts when thresholds are crossed [23]. Meanwhile, Tableau Catalog steps in to automatically generate descriptions for data sources, workbooks, and tables, indexing metadata by sampling up to 1,000 unique values from string fields [25].
"Tableau Agent becomes your trusted companion, empowering you to unlock insights and make informed decisions with confidence." - April Doud, Tableau [27]
Data Connectivity
Tableau Agent supports a range of data sources, including extracts, live database connections, and file uploads in formats like .hyper, .csv, .txt, and .xlsx [24][25]. It works seamlessly with Tableau Cloud, Tableau Desktop (version 2025.1+), and Tableau Server (version 2025.3+). Plus, its deep integration with Salesforce Data 360 ensures unified customer data analysis [24][26]. However, the AI doesn’t yet handle cubes or data modeling tasks like creating joins and relationships [24][25].
Governance Features
Tableau prioritizes data security with the Einstein Trust Layer, which ensures that customer data and interactions are not stored or used for model training [24][25]. Machine learning and pattern matching are used to mask personal identifiers in prompts, while existing row- and column-level security policies remain intact [25]. For those seeking more control, Tableau Server can connect directly to user-provided large language models, bypassing the Einstein Trust Layer [24].
Pricing and Scalability
To unlock most generative AI features, you'll need a Tableau+ subscription, starting at $75 per user per month when billed annually [20][24]. As of October 2025, AI usage no longer consumes Einstein Request credits, although some Data 360 services may still require other credit types [24][25]. If you're curious, a 14-day free trial is available to test out the platform before committing [20]. With an aggregated user rating of 4.6/5, Tableau with Einstein AI has received praise for its capabilities, though users often mention a steep learning curve and higher costs compared to simpler tools [20].
6. Google Looker Studio With Gemini AI
Google Looker Studio, enhanced with Gemini AI, changes the way we interact with data. You can now query datasets using plain English to generate charts, tables, and even Python analyses instantly. Features like Conversational Analytics transform straightforward language into visualizations without requiring coding skills. Meanwhile, the Code Interpreter handles advanced calculations in Python, and the "Help me write" tool suggests formulas based on your descriptions and schema, simplifying the process of creating expressions. Additionally, you can directly import report components into Google Slides, where Gemini provides text summaries for each chart automatically.
AI Capabilities
Gemini's strength lies in its ability to interpret your queries and deliver accurate visualizations. Administrators can create custom data agents to provide context and instructions, connecting up to five Explores at once to ensure results align with your business needs. The Code Interpreter translates queries into Python code, enabling more advanced analytics compared to SQL-based methods. If the AI-generated formula isn't quite right, the "Refine" feature allows you to tweak it by adding instructions or adjustments. Furthermore, Gemini integrates seamlessly with both Google-native and external data sources, ensuring flexible and reliable connectivity.
Data Connectivity
Looker Studio supports over 800 data sources and 600+ partner connectors, making integration quick and code-free [28]. It works effortlessly with Google tools like BigQuery, Google Ads, Google Sheets, and Search Console, as well as external databases such as MySQL and PostgreSQL. To unlock Gemini's full potential - including Conversational Analytics and AI-assisted calculated fields - ensure that "Field Editing in Reports" is enabled in your data source settings. For Gemini-powered summaries to work, you’ll need at least four rows of data, and note that blended data sources are not supported.
Governance Features
Looker Studio prioritizes security and compliance with its governance tools. Administrators can manage access using Cloud Identity and Google Workspace roles. The Pro version offers added control through features like team workspaces, Google Cloud project linking, and access to Google Cloud Customer Care. With Conversational Analytics, data at rest stays within your Looker instance and is restricted to a single region, although data in transit may pass through global services. Users need the gemini_in_looker permission to utilize AI features with Looker models. While Conversational Analytics supports data residency for resting data, it is not currently covered under FedRAMP High or Medium authorization boundaries.
Pricing and Scalability
Looker Studio Standard is free, making it a great option for individuals and small teams. For larger organizations, Looker Studio Pro is available at $9 per user per project per month [28]. The Pro plan includes advanced features like team workspaces, Cloud project linking, and Gemini AI tools. In some cases, existing Looker instances may qualify for free Pro licenses if they meet certain criteria. Before rolling out natural language analytics self service dashboards in a live environment, consider testing them in a personal sandbox to ensure smooth implementation.
7. Zoho Analytics With Zia
Zoho Analytics merges traditional business intelligence with Zia, its AI assistant, to not only create dashboards but also explain the reasons behind metric changes. With over 20,000 customers and 3 million users worldwide [33], the platform enables users to ask Zia questions in plain English, Spanish, or French, delivering instant visualizations, insights, and explanations [30]. This seamless AI integration reflects the high-level functionality expected from leading dashboard tools.
AI Capabilities
Zia's Auto-Analysis Engine can transform raw CSV files into interactive dashboards in under a minute [34]. The "Ask Zia" feature builds data pipelines, applies transformations, and generates reports - all through natural language commands [36]. Zia also offers Key Driver Analysis to clarify KPI fluctuations, along with predictive tools for forecasting, anomaly detection, and cluster analysis [29][36]. For more advanced needs, AI Studio supports AutoML and custom models via Python Code Studio, while OpenAI's GPT models assist in generating SQL queries, complex formulas, and column synonyms [36][30].
"Whenever I have a new client meeting, I demonstrate the Ask Zia feature of Zoho Analytics with a question like 'what was my income last month?' Its quick reply or a visual fascinates my clients."
– Craig Roxby, Managing Director, Magnify [29]
Data Connectivity
Zoho Analytics connects to over 500 data sources, including 100+ pre-built connectors for widely used business applications [33]. It integrates with file types like Excel, CSV, and JSON; cloud storage services like Google Drive and Dropbox; and both relational and NoSQL databases. It also supports stream analytics from platforms like Kafka and Google Pub/Sub [37]. With Live Connect, users can query databases directly without storing data on Zoho's servers, while Zoho Databridge ensures secure connections between on-premise data and the cloud [37].
For example, John Sheldon, Business Intelligence Manager at Renu Energy Solutions, uses Ask Zia to analyze agent performance across regions, uncovering within minutes that coastal customers were better understood by certain representatives compared to those in mountainous areas [30]. Similarly, Eddie Shekari, Principal & CEO of Versa Creative, reported saving 5,000 man-hours annually by automating data integration and reporting workflows with Zoho Analytics [33].
Governance Features
Beyond its AI and connectivity, Zoho Analytics provides detailed governance tools. These include row-level security, fine-grained access controls, and a full audit trail for all connectors [36]. Administrators can implement workplace IP restrictions and integrate with Single Sign-On (SSO) and Active Directory [36]. Zoho Analytics has been recognized in the Gartner Magic Quadrant for Analytics and Business Intelligence Platforms for four consecutive years, as of 2025 [32]. Its Metrics Layer ensures business logic remains consistent and reusable as companies grow, and its APIs and SDKs allow integration with any technology stack [36].
Pricing and Scalability
Zoho Analytics offers a 15-day free trial with no credit card required, as well as a free AI dashboard generator for CSV files [34]. The platform emphasizes straightforward pricing, with advanced tools like Zoho DataPrep included in its Premium and Enterprise plans [33][35]. Deployment options are flexible, spanning Zoho Cloud, on-premise setups, or public/private clouds such as AWS, Google Cloud, and Microsoft Azure, making it suitable for both individuals and large enterprises [32].
"Zoho Analytics is the only product with the right mix of cost and value - with features like data visualization, integration, data blending, and collaboration at an affordable price."
– Ben Smith, Advisor and former COO, Sugarfina [31]
8. ThoughtSpot
ThoughtSpot stands out in the world of AI dashboard generation with its SpotterViz, an AI-powered tool that creates detailed Liveboards from simple natural language prompts. Instead of starting from scratch, users can describe their needs in plain English, and SpotterViz takes care of structuring, designing, and styling the dashboards. This approach eliminates the dreaded "blank-page problem", making dashboard creation faster and more intuitive.
AI Capabilities
At the heart of ThoughtSpot's platform is Spotter, an AI assistant that acts like a virtual analyst. It maintains context across multi-turn conversations, delivering clear and explainable answers to follow-up questions. The platform’s AI-enhanced Liveboards provide real-time, interactive views with "Drill Anywhere" functionality, letting users seamlessly move from broad metrics to specific details without needing predefined paths.
Additional AI-driven features include:
AI Highlights: Automatically identifies key trends in the data.
Change Analysis: Explains the factors driving fluctuations in KPIs.
Anomaly Detection: Continuously monitors data to flag unusual patterns.
For data modeling, SpotterModel simplifies the process by automatically mapping relationships, dimensions, and measures from raw data. Users can validate these models, ensuring accuracy while keeping human oversight in the loop. All this is backed by ThoughtSpot’s commitment to real-time data access through extensive connectivity options.
Data Connectivity
ThoughtSpot employs a "zero-copy" architecture, directly querying live data from cloud warehouses like Snowflake, Databricks, and BigQuery. This ensures visualizations are always up-to-date. It also connects with cloud databases such as Amazon RDS and Microsoft SQL Azure through Live Connect. Legacy systems like PostgreSQL and MySQL, as well as file formats like Excel, CSV, and Google Sheets, are supported too. For SaaS tools, integrations with platforms like HubSpot, Segment, Mixpanel, and Airtable are made possible via Python and API connections.
Pricing and Scalability
ThoughtSpot offers flexible pricing plans to suit businesses of all sizes:
Essentials Plan: Starts at $25 per user per month (billed annually). Ideal for teams of 5–50 users, it supports up to 25 million rows of data.
Pro Plan: Designed for growing businesses, it offers two pricing options - $0.10 per query or $50 per user per month. This plan supports teams of 25–1,000 users and up to 250 million rows of data.
Enterprise Plan: Tailored for large organizations with custom pricing, unlimited users, and unlimited data capabilities.
Developer Plan: Free for one year, this plan is geared toward individual developers, supporting up to 10 users and 25 million rows of data for testing purposes.
With its robust features, seamless data connectivity, and adaptable pricing, ThoughtSpot provides a versatile solution for businesses looking to harness the power of AI in analytics.
Strengths and Weaknesses
Here’s a breakdown of the strengths and trade-offs for each tool, specifically tailored to the needs of U.S. businesses:
Querio shines with its semantic layer, ensuring consistent metrics across teams. That said, its reliance on live, read-only connections may push companies to upgrade or tweak their existing data warehousing setups.
Excelmatic is perfect for small teams thanks to its easy-to-use file upload workflow, making it a breeze for those who primarily work with spreadsheets. However, it falls short on scalability and isn’t built for real-time data warehousing or complex multi-source integrations.
Polymer offers great value at around $25 per month, especially for marketing teams needing quick insights from platforms like Shopify or Google Analytics 4. But its straightforward design may not meet the needs of those requiring more advanced customization for complex reporting.
Microsoft Power BI with Copilot and Tableau with Einstein AI cater to enterprises with advanced features and seamless integration into their ecosystems - Microsoft 365 for Power BI and Salesforce for Tableau. These tools, however, come with steeper learning curves and higher costs, making them better suited for larger organizations with dedicated analytics teams.
Google Looker Studio with Gemini AI is a standout free option, offering smooth integration with Google Workspace, making it a great choice for teams already using Google’s suite of tools.
Zoho Analytics with Zia combines rich functionality with competitive pricing, making it appealing for businesses already aligned with Zoho’s ecosystem.
ThoughtSpot excels with its Spotter feature for natural language querying and zero-copy architecture, delivering real-time insights. However, its pricing - ranging from $25 to $50 per user per month - might be a hurdle for smaller teams.
These considerations highlight the importance of essential features of modern business intelligence tools in these tools, which can save time and reduce inefficiencies.
Ultimately, your choice should align with your current data infrastructure, team capabilities, and strategic goals - whether you prioritize simplicity, advanced AI features, or strict adherence to data governance.
Conclusion
In today’s fast-paced world, where quick insights often shape important decisions, selecting the right AI dashboard generator is crucial. The best choice will depend on your team’s expertise, existing infrastructure, and specific goals. Let’s take a moment to recap what each option brings to the table.
For smaller businesses or teams without much technical know-how, Zoho Analytics offers a great starting point. Its free dashboard tool can turn CSV files into polished, professional dashboards in under 60 seconds[34]. It’s an excellent way to explore AI-driven analytics before committing to a paid platform. Understanding the future of AI-driven analytics can help you choose a tool that scales with your long-term needs.
Larger enterprises, on the other hand, might benefit from more advanced tools like Power BI with Copilot, Tableau with Einstein AI, or Google Looker Studio with Gemini AI. These platforms provide deep integrations and advanced features designed to work seamlessly within their ecosystems.
With 91% of top-performing companies using data-driven strategies and 78% reporting faster decision-making as a major advantage, it’s clear that timely insights can significantly improve business outcomes[38]. The numbers speak for themselves: accurate, actionable business data analytics can be a game-changer.
Take stock of your current data systems and try out free trials to find the platform that aligns best with your team’s needs and workflow.
FAQs
How do AI-powered dashboard tools improve data-driven decisions?
AI-powered dashboard tools simplify the process of turning raw data into meaningful insights. Using advanced technologies like natural language processing and machine learning, these tools let users ask straightforward, plain-English questions and instantly receive clear, visual results - no coding or technical expertise needed. They can spot trends, predict outcomes, and detect anomalies as soon as data shifts, all while automating routine reporting tasks to save time.
These dashboards also break down complex data with features like smart chart suggestions and narrative explanations, making it easier for teams to spot patterns and maintain consistent metrics. With real-time updates and customizable alerts, decision-makers in departments like finance, sales, and marketing can dive into data, test scenarios, and respond to insights quickly. This streamlined approach eliminates bottlenecks, helping businesses act decisively and with confidence.
What security features do AI dashboard tools typically offer?
AI-powered dashboard tools take data security seriously, employing a range of protective measures to keep information safe. One key approach is encryption, which secures data both when it's stored and while it's being transmitted. By using strong protocols like TLS/SSL, these tools help block unauthorized access.
Another critical feature is role-based access controls (RBAC), which limit users to viewing only the data that's relevant to their specific roles. This ensures sensitive information stays accessible only to those who need it.
To further bolster security, many platforms align with industry standards like SOC 2 Type II and comply with privacy regulations such as GDPR and CCPA. They also incorporate advanced features like multi-factor authentication (MFA), single sign-on (SSO), and comprehensive audit logs. These tools not only improve access control and traceability but also help businesses stay compliant while safeguarding their data.
What should I consider when selecting an AI dashboard generator for my business?
When selecting an AI dashboard generator, it's essential to start by pinpointing your business's unique requirements. Make sure the platform supports seamless data integration with your current systems, such as Snowflake, BigQuery, or on-premises databases, without the need for a complicated setup. It's also worth considering AI-powered features like natural language querying, automated chart recommendations, and real-time updates to ensure your insights stay relevant and actionable.
Security should be a top priority. Focus on tools that offer strong governance and compliance measures, such as SOC 2 Type II certification, encryption, and role-based access controls. Additionally, evaluate the cost and scalability to confirm the platform aligns with your budget and can grow alongside your business. For instance, Querio provides pricing starting at $14,000 annually, tailored for midsize to large enterprises, with unlimited viewers and a generous usage quota.
To make the best choice, identify your key performance indicators (KPIs) and confirm the platform can handle them effectively. Run a trial with a small team to assess its usability, customization capabilities, and security features. If the tool meets your needs and fits within your budget, it could be the ideal solution to improve your analytics and decision-making processes.
Related Blog Posts


