Business Intelligence
how to reduce ad-hoc analysis bottlenecks with ai
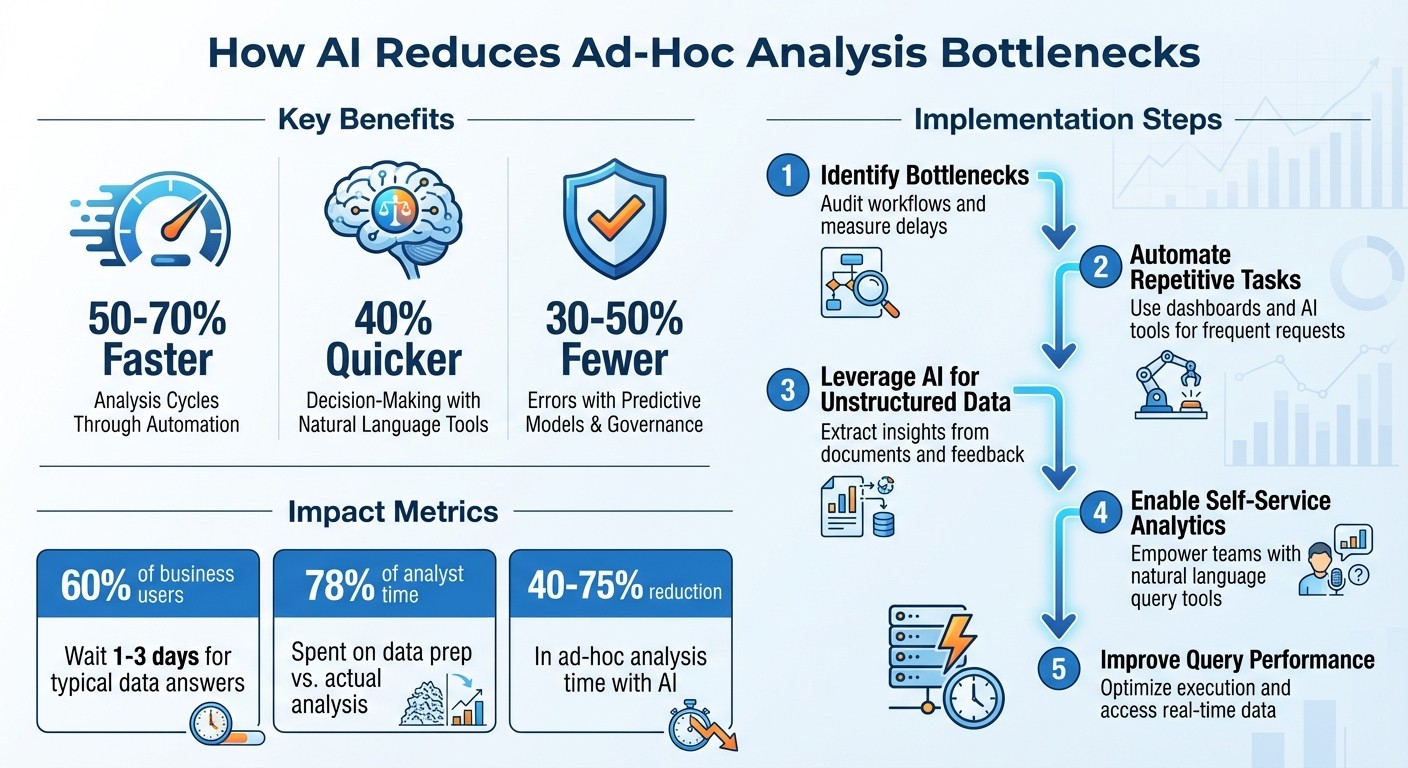
Automate data prep, extract insights from unstructured sources, enable self-service queries, and optimize execution to eliminate ad-hoc analysis delays.
Ad-hoc analysis bottlenecks waste time and money for businesses, slowing down decision-making and draining resources. The main culprits? Manual data cleaning, inconsistent metrics, and repetitive requests that overwhelm analytics teams.
AI offers a solution by automating data prep, speeding up query execution, and enabling self-service analytics. Key benefits include:
50–70% faster analysis cycles through automation.
40% quicker decision-making using natural language tools.
30–50% fewer errors with predictive models and governance.
To get started, focus on these steps:
Identify bottlenecks: Audit workflows and measure delays.
Automate repetitive tasks: Use dashboards and tools like Querio for frequent requests.
Leverage AI for unstructured data: Extract insights from documents and feedback.
Enable self-service analytics: Empower teams with natural language query tools.
Improve query performance: Optimize execution and access real-time data.
AI-Powered Analytics: Key Performance Improvements and Implementation Steps
Finding Bottlenecks in Ad-Hoc Analysis
Common Bottleneck Areas
Ad-hoc analysis often hits roadblocks, and understanding where delays occur is the first step to addressing them. A major issue for most data teams is the sheer imbalance between resources and demand. Typically, analysts are tasked with supporting ten times more stakeholders than they can realistically manage, leading to a constant backlog of requests [12]. This backlog grows faster than analysts can keep up, creating a cycle of delays.
One significant contributor to this problem is the "quick question" trap. Requests like "What's churn by region this week?" seem simple but dominate an analyst's workload. These repetitive, low-complexity queries consume hours, leaving little room for deeper, strategic analysis [11][12]. Analysts often end up functioning as ticket-clearing machines instead of focusing on meaningful insights.
"Analysts lose hours context-switching between tools and queries, making it difficult to focus on meaningful analysis or model improvements."
– Ievgen Krasovytskyi, Head of Marketing, OWOX [11]
Another major slowdown comes from metric drift. When teams define the same key performance indicators (KPIs) differently - like "revenue" or "active users" - analysts spend valuable time reconciling these discrepancies. For instance, one team might define an "active user" as someone who logged in within 30 days, while another uses a 7-day window. This inconsistency forces manual verification and delays insights [11].
The impact of these bottlenecks is clear: for 60% of business users, answering a typical question takes 1–3 days - far longer than most decision windows allow [15]. By the time the data is ready, decisions have often already been made without it. Pinpointing these delays is essential for uncovering inefficiencies and improving workflows.
Auditing Current Workflows
To address bottlenecks, start by auditing your team's workflows. Categorize all ad-hoc requests over a two-week period by type - such as sales, churn, or product usage. This helps identify recurring patterns that could be automated [1]. If your team is handling more "one-off" requests than strategic projects, it’s a sign of a reactive cycle [11].
Pay attention to how much time analysts spend switching between tools like Slack, SQL, and dashboards. Context-switching can add significant hidden delays to their work [11]. Another key metric to track is time-to-insight - the time it takes from the initial question to delivering actionable insights. If most requests take days or weeks when they should take hours, you’ve found a critical bottleneck [3][4]. Additionally, measure decision latency - how often does data arrive too late, after decisions have already been made? [12]
"A two-day delay might sound acceptable on paper, but product and growth decisions are rarely waiting politely in a queue."
– Ambrus Pethes, Growth, Mitzu [12]
Another area to review is the "Excel tax." Identify reports that rely on outdated VLOOKUPs or manual CSV stitching, which are prone to errors and inefficiencies [13]. Lastly, check if governance practices are consistent - if departments define key metrics differently, it’s a sign of a governance bottleneck that needs attention [2].
Once inefficiencies are identified, the next step is quantifying their impact to build a case for adopting AI-driven solutions.
Measuring the Impact of Bottlenecks
To justify improvements, you need to measure the costs of these bottlenecks. For mid-market companies, analytics backlogs often exceed 200 requests, with custom reports taking 2–3 weeks to complete [14]. Count how often requests pile up without leading to decisions - this highlights the inefficiency of the current process [15].
"The analyst bottleneck becomes the ceiling on how fast the company can make decisions."
– Databox [15]
Track how analysts spend their time. If 78% of their hours go toward data preparation and context-switching instead of actual analysis, that’s a clear area for improvement. Multiply these wasted hours by your team’s hourly rate to calculate the financial impact - many businesses lose hundreds of thousands of dollars annually.
Finally, assess the impact on decision quality. Document how many key decisions - like product launches, pricing changes, or marketing campaigns - were made without data due to delays. The true cost of bottlenecks isn’t just lost time; it’s missed opportunities and reduced momentum. Quantifying these effects makes the case for change undeniable.
The #1 PROBLEM with AI & Automation for Businesses (And How to Fix It)
Automating High-Frequency Requests
To tackle bottlenecks effectively, automating repetitive, high-frequency requests is a game-changer.
Identifying Recurring Requests
The first step is figuring out which requests keep popping up. Start by auditing SQL and BI logs from the last 1–3 months. Look for queries that show up daily or weekly, often with slight variations in dates or filters [16]. These patterns are perfect candidates for automation.
Next, dive into your communication tools like Slack or Teams. Use keywords such as "sales", "churn", or "inventory" to identify frequent data requests. A simple spreadsheet tracking request types, frequency, and time spent can reveal where your team’s time is being drained [5][10].
Typical examples include sales performance summaries by region, customer churn rates, inventory levels, and marketing campaign ROI reports. Studies show these repetitive tasks can eat up 40–60% of analysts' time - time that could be redirected to more impactful work [5][6].
To prioritize, categorize requests based on how often they occur and how much time they consume. For instance, automating a weekly sales report that takes two hours is far more impactful than automating a monthly query that takes only 30 minutes.
Creating Automated Views and Dashboards
Once you’ve identified the key repetitive tasks, the next step is building reusable dashboards and automated views. These should rely on shared metric definitions to maintain consistency. For example, if multiple teams request a "monthly recurring revenue" report, create a single, standardized version that everyone can use [5][8].
Leverage tools like Tableau or Power BI to design dashboards with dynamic filters. This allows users to adjust parameters such as date ranges, regions, or product categories - eliminating the need for new requests. Automate dashboard refresh schedules (daily, weekly, or real-time) and set up alerts to notify stakeholders when specific thresholds are reached [7][10].
For technical users, SQL views can provide reusable, standardized data subsets. Meanwhile, platforms like Hex offer shared notebooks that combine code and visualizations, making them accessible to non-technical users. The key across all these approaches is data governance - ensuring consistent metric definitions to avoid conflicting reports, an issue that affects up to 30% of teams [5][6].
Take this real-world example: a retail team automated 15 weekly sales queries into shared dashboards. This reduced response times from four hours to instant access and cut analyst tickets by 50% [7]. In another case, automating daily sales reports slashed preparation time from two hours to five minutes, freeing up 20% more time for strategic projects each month [6][9].
After deploying automation, monitor its impact by tracking dashboard usage and gathering stakeholder feedback. Success metrics should include reduced ad-hoc ticket volume (aim for a 50% drop), hours saved per analyst, and faster decision-making downstream [6][9].
How Querio Supports Automation
Querio simplifies automation by analyzing query patterns across databases and standardizing metric definitions.
It creates reusable metrics that form part of a shared context layer. For instance, if a sales team requests "revenue by region" and a finance team asks a similar question, Querio ensures both get consistent answers based on the same logic - avoiding metric drift and discrepancies.
These standardized metrics are then deployed as self-updating dashboards that connect directly to live warehouse data. Since there’s no data duplication or manual refreshing, any changes in the underlying data are immediately reflected. This eliminates the need for one-off queries and significantly reduces ad-hoc workloads.
Querio also generates real SQL and Python code, ensuring that every automated view is inspectable and transparent. Analysts can verify the logic behind dashboards, maintaining trust in the data while cutting down the time spent on repetitive tasks.
With high-frequency requests automated, your team can shift focus to tackling more complex, unstructured data challenges using AI.
Using AI to Handle Unstructured Data
AI goes beyond automating repetitive tasks - it addresses one of the most time-consuming challenges in analytics: managing unstructured data. Think emails, PDFs, scanned invoices, customer feedback, and contracts. These don’t fit neatly into rows and columns, yet they hold critical business information. Traditionally, analysts would spend hours extracting, cleaning, and organizing this data. AI changes that game entirely.
AI for Document Intelligence
Modern AI tools do more than just read documents - they interpret them. While older OCR systems could only convert images into text, today’s advanced AI uses large language models to understand context, layout, and meaning. For instance, AI can extract the "Total Amount Due" from an invoice, no matter where it appears on the page, or identify that terms like "indemnify" and "cover losses" are related in a legal contract.
Here’s how it works: AI begins by automatically pulling documents from sources like email, Google Drive, or S3. It applies OCR and parsing techniques that retain structural elements like tables and headers. Then, natural language processing (NLP) models step in to enrich the data - tagging it with metadata, extracting key details like names and dates, flagging sensitive information, and even analyzing sentiment. The result? Clean, structured outputs in formats like JSON or tables, ready for business intelligence tools to use - no manual data entry required.
The accuracy speaks for itself. Advanced AI models achieve 92–97% accuracy in document extraction tasks [17]. For example, in February 2026, a logistics company with 32 operations staff used a three-layer AI system - featuring Claude 3.5 Sonnet and GPT-4o Vision - to handle supplier invoices, freight manifests, and customs declarations from over 60 vendors. In just 14 weeks, the system slashed weekly data entry from 40 hours to under 5 (an 87% reduction), with extraction accuracy hitting 96.2%. Errors in ERP data dropped by 94% [21]. These precision gains naturally reduce the need for manual oversight, as we’ll explore next.
Reducing Manual Review Workloads
AI doesn’t eliminate human oversight - it makes it smarter. Instead of reviewing every document, the system assigns confidence scores to its extractions. High-confidence fields are sent directly to downstream systems like ERP or CRM, while low-confidence items are flagged for human review. This targeted approach significantly reduces manual workload without compromising quality. In the logistics example above, only 18% of documents required human review, with each flagged document taking just 51 seconds to verify [21].
"The team doesn't talk about the system anymore. It just works, and they focus on actual work."
– Operations manager at the logistics firm [21]
To ensure accuracy, a dual-model check flags discrepancies for human review, addressing potential errors even with a 97% accuracy rate. This streamlined review process can be applied across various business scenarios.
Example Use Cases
Contract Analysis: In 2025, Vendr, a SaaS management platform, used AI to analyze SaaS agreements. Tasks like identifying contract terms and renewal dates - once done manually - were automated, reducing contract review times by 70–85% [17][19].
Customer Feedback Categorization: AI can sift through thousands of support tickets, reviews, or survey responses, tagging them by topic, sentiment, and urgency. This allows teams to quickly spot trends and respond effectively.
Financial Reconciliation: In early 2026, a logistics company processing 10,000 invoices monthly reduced its manual entry workforce from 5 full-time employees to just 0.5 FTE for exception handling. Processing time dropped from 48 hours to 2 hours, saving $170,000 annually [20]. Similarly, Glassdoor saved 190 hours per week by automating review processes [13].
When starting with AI for unstructured data, it’s wise to begin small. Focus on high-volume, standardized documents like invoices before moving on to more complex ones like contracts. Build human review workflows early to manage the 5–20% of documents that fall below confidence thresholds [18][19]. Additionally, capturing human corrections helps refine AI models over time [19][20].
With unstructured data streamlined, businesses can access insights faster, removing ad-hoc analysis bottlenecks and unlocking new efficiencies.
Enabling Self-Service Analytics with AI
Once high-frequency queries are streamlined through automation, the next step is empowering business users with self-service analytics. This approach addresses a common challenge in ad-hoc analysis: the delay caused by waiting in line for data requests. Requiring SQL expertise for every inquiry often forces teams to wait days for answers that should ideally be instant. AI-powered natural language query interfaces solve this problem by enabling non-technical users to ask questions in plain English and receive accurate results right away - no data analyst required.
Natural Language Query Interfaces
Modern AI tools can handle questions like "What were sales last quarter in the US?" by automatically generating SQL or Python code. These tools rely on large language models to interpret intent, identify metrics and timeframes, and align the query with your database structure. This means a marketing manager can analyze campaign results or a sales director can examine regional trends - all without writing a single line of code.
The benefits are clear. Industry data shows that self-service tools can boost productivity by 50–70% by cutting query wait times from days to minutes [5][10]. For instance, a Fortune 500 retailer that implemented a natural language query platform saw a 60% reduction in ad-hoc bottlenecks, with the system independently resolving 80% of queries [6][9]. By giving users direct access to data, these tools reduce delays and complement earlier automation efforts.
Maintaining Governance and Consistency
While self-service analytics speeds up the process, ensuring consistency and governance is critical. Without proper oversight, different teams might use conflicting definitions, leading to discrepancies. For example, "revenue" might mean gross sales to one department but net sales to another. A governed semantic layer solves this issue by acting as a central repository for metadata, providing consistent definitions, enforcing security policies like row-level access, and preventing query sprawl that could lead to inaccurate insights [5][6][8].
Key practices include role-based access controls (RBAC), workflows for approving high-risk queries, and maintaining versioned semantic models with clear ownership. Regular audits and lineage tracking also help monitor the impact of queries. AI tools make this process more efficient, reducing manual oversight by 40% through automated policy enforcement [5][8]. To measure success, organizations can track metrics like query resolution time (target: under 5 minutes), self-service adoption rates (aim for 70% of ad-hoc requests), and governance compliance rates (99% or higher) [5][10][9].
How Querio Combines Self-Service and Trust
Querio takes self-service analytics a step further by integrating transparency and strong governance to build trust in the analytics process. It allows business users to ask questions in plain English while maintaining the rigor data teams need. When a question is posed, Querio generates SQL or Python code that users can view, edit, and understand before executing - unlike black-box AI tools. This openness fosters trust and ensures accuracy.
For advanced users, Querio provides the flexibility to adjust generated queries while maintaining audit trails and enforcing consistent definitions through its context layer. For example, a regional manager automatically sees only their territory's data, thanks to row-level security, even when asking broader questions. This balance of control and accessibility helped the Fortune 500 retailer achieve zero compliance incidents while scaling self-service analytics [6][9]. Querio demonstrates how effective governance and user-friendly tools can eliminate bottlenecks without sacrificing data integrity.
Improving Query Performance and Reducing Delays
Even with self-service analytics tools, technical hiccups can slow down ad-hoc analysis. The real issue often lies in how efficiently queries are executed, not just who runs them. When query performance drags, it frustrates users and diminishes the advantages of automation and self-service analytics. According to Gartner, poor query performance accounts for 40% of analytics delays, but AI-driven optimizations have the potential to cut these delays by up to 60% [23]. Tackling inefficiencies at the execution level while ensuring real-time access to fresh data is critical. Here's a closer look at methods to speed up query execution.
Improving Query Efficiency
One powerful way to boost query speed is through federated query pushdown. This technique delegates tasks like filters, joins, and aggregations directly to the data warehouse, reducing the time spent transferring and processing data. For example, Netflix uses federated queries with Presto to analyze petabyte-scale data across S3 and HBase, cutting ad-hoc query times by 70% without moving data. Similarly, Airbnb leverages pushdown in their Superset setup, enabling analysts to run complex joins five times faster [8].
Another key strategy is performance monitoring. Tools like Snowflake's query history profile and Datadog can track execution plans, CPU usage, memory usage, and I/O operations. Regular audits using these tools can uncover inefficiencies, leading to optimizations that improve query speeds by 30–50%. Examples of such optimizations include:
Adding strategic indexing to speed up queries on frequently filtered columns.
Partitioning large tables to skip irrelevant data during searches.
Avoiding
SELECT *to reduce unnecessary I/O and network traffic.
Indexing alone can make selective queries 10x to 100x faster, while partitioning can accelerate date-range queries by 5x to 50x [22]. Beyond improving efficiency, accessing real-time data is another essential step in reducing delays.
Real-Time Data Access
Accessing live data directly eliminates delays caused by outdated extracts. Traditional ETL pipelines often create data extracts that are hours or even days old. Zero-copy access solves this issue by querying data warehouses directly, ensuring insights are always based on the latest information. This approach can reduce data preparation time by as much as 90% [7].
For example, e-commerce platforms using live Snowflake queries can dynamically adjust pricing based on current sales data, improving operational efficiency by 20–40% [9]. Real-time querying delivers up-to-date results, enabling quicker and more informed decision-making.
Querio's Real-Time Capabilities
Querio takes real-time querying to the next level by directly connecting to platforms like Snowflake, BigQuery, and Redshift. It translates natural language queries into optimized SQL that runs directly at the source, delivering results almost instantly. Querio's dashboards offer an 80% speed boost and sub-second response times for even the most complex queries [10].
Case studies highlight how Querio has eliminated 2–3 day delays in marketing analysis cycles by providing instant access to live data. Combining federated pushdown, real-time querying, and automated caching for repeated patterns, Querio ensures that technical bottlenecks never stand in the way of fast, data-driven decisions.
Conclusion
This guide brings together strategies to tackle delays in ad-hoc analysis head-on. By automating repetitive requests, leveraging AI for unstructured data, enabling self-service analytics, and boosting query performance, these methods work in harmony to speed up decision-making. Research shows that AI can cut ad-hoc analysis time by 40–75%, with automated data preparation alone saving 30% of analysts' time [6][9].
Adopting these strategies can significantly streamline your workflows. For instance, when AI manages document intelligence, the need for manual reviews drops sharply, leading to faster overall processes [6][10]. Natural language tools let non-technical users query data directly, reducing request backlogs, while live data connections eliminate technical delays.
Querio integrates all these features into a single AI-powered analytics workspace. It connects seamlessly to data warehouses like Snowflake, BigQuery, Redshift, or ClickHouse, translating plain English questions into optimized SQL queries that run directly at the source. With real-time access to live data, Querio eliminates the typical 2–3 day delays seen in traditional analytics workflows [10]. Its governed semantic layer ensures consistent metrics across teams, while its transparent, inspectable code builds trust in every result.
To get started, evaluate your current workflows to identify the most pressing bottlenecks. Begin by piloting AI automation for high-frequency requests and rolling out self-service analytics with proper governance structures. Track metrics like query resolution time and decision latency to measure progress, and refine your approach quarterly based on insights gained [5][7][10].
Teams that adopt these AI-driven methods see decisions made 2–3 times faster, with 90% fewer manual errors [9][23]. When implemented effectively, these solutions transform analytics from a hurdle into a powerful tool for strategic decision-making.
FAQs
Which ad-hoc requests should we automate first?
Focus on automating ad-hoc requests that tackle urgent, high-priority questions - like sudden dips in website traffic, unexplained sales anomalies, or pressing operational challenges. These situations demand immediate insights and can’t afford the delays tied to traditional reporting processes.
By leveraging AI-powered tools that support natural language queries and connect to real-time data, you can speed up response times, eliminate bottlenecks, and give your team the ability to act quickly. This approach ensures that decisions are based on accurate, up-to-the-minute information, without waiting for lengthy report cycles to catch up.
How do we prevent metric drift with self-service AI?
Keeping metrics accurate and consistent in self-service AI systems requires a strong foundation of data governance and quality controls. One way to achieve this is by automating processes like data cleaning and anomaly detection. These automated tools help catch errors early, ensuring the data feeding your AI remains reliable.
It’s also important to assign clear ownership for all data sources. When everyone knows who is responsible for specific datasets, it’s easier to maintain accountability. Pair this with thorough documentation so users can easily understand the origin, structure, and purpose of the data.
Finally, automated compliance and monitoring systems can further safeguard metric integrity. These tools continuously check for issues, helping to ensure the insights generated by your AI remain trustworthy and support better decision-making over time.
What data should we use first for unstructured-data AI?
Start by working with unstructured data that’s both relevant and readily available for your immediate analysis needs. This could include sources like customer feedback, social media posts, or key documents tied to your decision-making process. Tools such as Querio can help streamline the process by automating tasks like data preparation, cleaning, and analysis. This not only speeds up the workflow but also minimizes manual effort. Concentrate on data that directly addresses your current questions to get the most useful insights.
Related Blog Posts


