Business Intelligence
how to automate excel-reports
Automate Excel reports with Querio, Power Query, Power Automate, and Python for live data, scheduled refreshes, and polished formatting.
If you're tired of spending hours on manual Excel reporting, automation can save time, reduce errors, and ensure your data is always up-to-date. Tools like Querio, Power Query, Power Automate, and Python simplify the process by connecting directly to your data, automating transformations, and formatting reports efficiently.
Key Takeaways:
Querio: Use plain English to query data directly from your warehouse, eliminating CSV exports.
Power Query: Automate data cleaning and transformations in Excel.
Power Automate: Schedule report updates and data refreshes automatically.
Python: Handle advanced formatting, pivot tables, and custom calculations.
By combining these tools, you can build a workflow that keeps your reports accurate, consistent, and ready for decision-making.
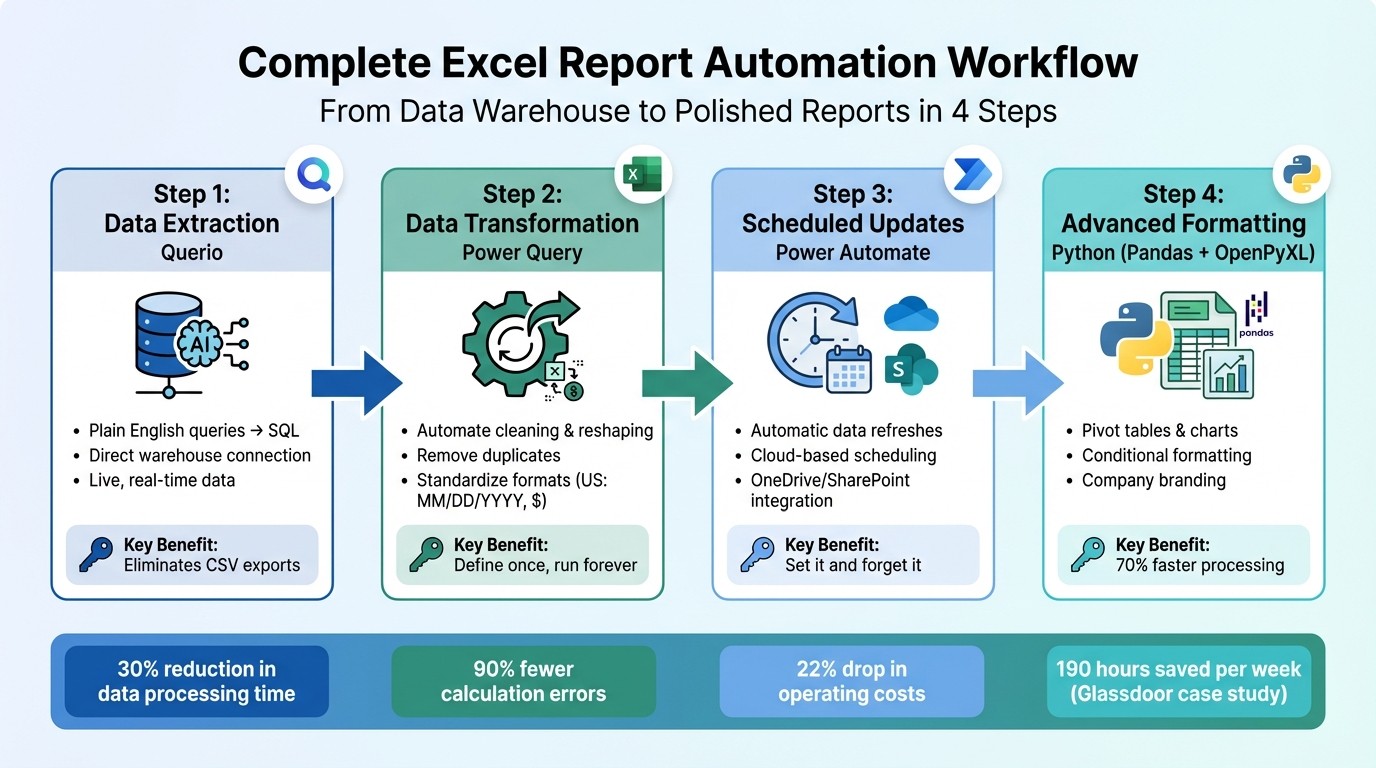
Complete Excel Report Automation Workflow: From Data Extraction to Formatted Reports
Automate Excel Reports in 2025 (Real World Examples)

Prerequisites and Setup
To automate your Excel reports effectively, you’ll need to start with a solid foundation. This means having three key components ready to go: a Querio account connected to your data warehouse (like Snowflake, BigQuery, or SQL Server), Excel with Power Query enabled (accessible under the "Data" tab in modern Excel versions), and Python installed with the pandas and openpyxl libraries.
Required Tools and Software
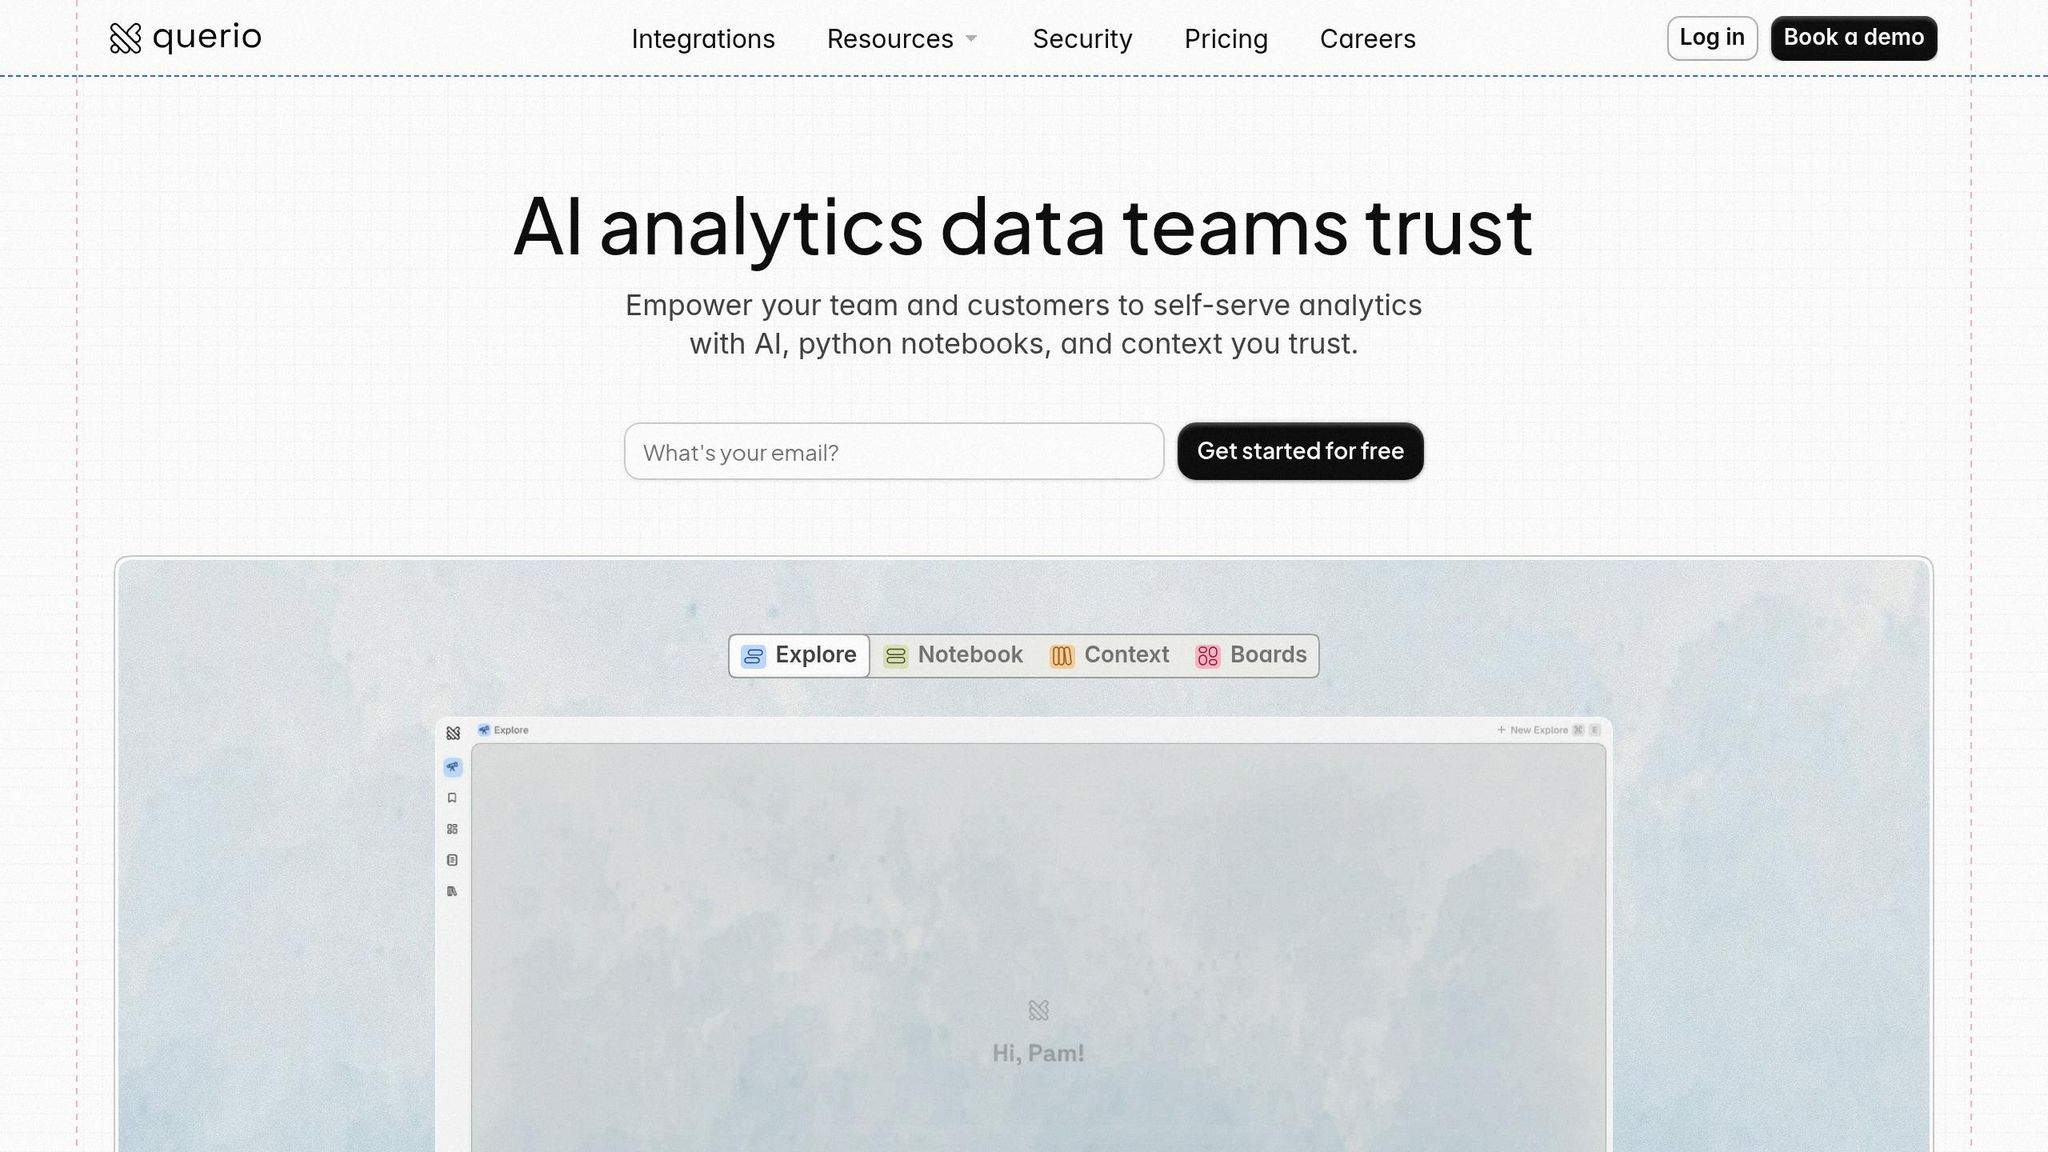
Your automation toolkit revolves around Querio, which acts as the bridge between your data warehouse and your reports. Instead of manually exporting CSVs, Querio allows you to ask plain English questions, which it translates into SQL queries. This means you can pull live data directly from your centralized storage without extra effort.
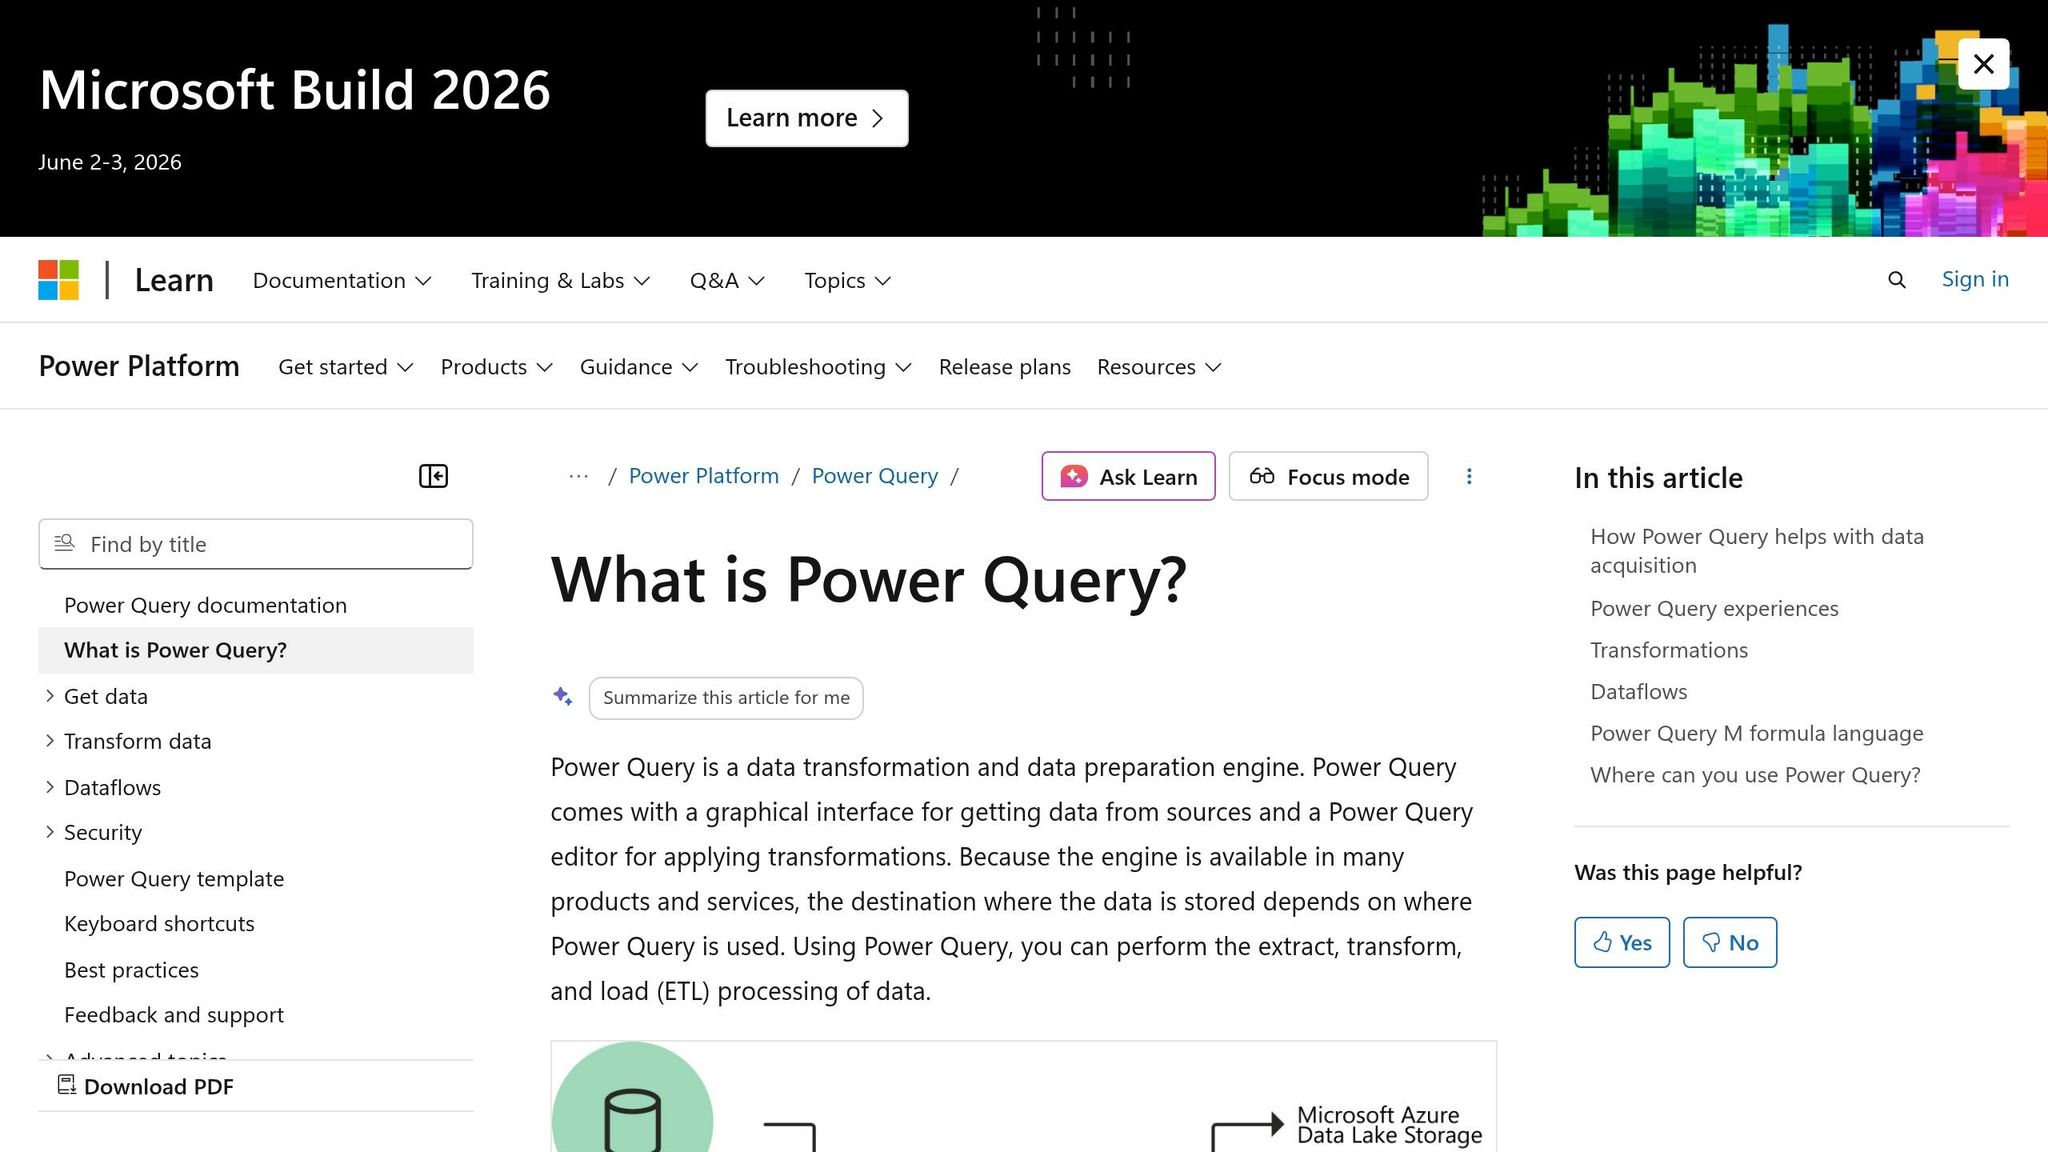
Power Query takes care of cleaning and reshaping your data. It’s like a "record" button for data preparation - once you define tasks like removing duplicates, filtering rows, or adjusting data types, Power Query applies those steps every time you refresh your data. This ensures consistency and saves you from repeating manual data prep every time [1].
For more complex tasks, Python steps in. With the pandas library, you can process large datasets quickly, while openpyxl helps you generate formatted Excel files programmatically. Whether you need to create custom charts, apply conditional formatting, or merge API data, Python handles tasks that go beyond Excel's native capabilities.
"Define the process once, and let Excel run it forever." [1]
Once your tools are in place, the next step is to ensure your data is formatted to meet standardized US conventions.
US Formatting Standards
Automation can break down if your data formats are inconsistent. For example, a date stored as "14-Apr-2026" in one system and "04/14/2026" in another can cause formulas to fail. To avoid this, it’s crucial to standardize all data to US formats: use MM/DD/YYYY for dates, include the dollar sign ($) for currency, and format numbers with commas for thousands and periods for decimals.
In Power Query, the "Change Data Types" feature allows you to ensure Excel recognizes dates as actual dates instead of text. This simple adjustment can prevent countless errors later on. For Python users, the openpyxl library makes it easy to apply US-specific formatting across all reports, helping maintain consistency in every file [1].
Connecting Querio to Your Data Warehouse
Once your tools are ready, the next step is connecting Querio to your data warehouse. This is a one-time setup that might require help from your IT or data team to configure credentials and permissions correctly [3].
After the connection is established, Querio becomes your single source of truth. There’s no need to download, reformat, or manually import CSV files into Excel anymore. Simply ask questions like "Show me Q1 2026 sales by region", and Querio delivers live, accurate data. This eliminates the chaos of version control, where multiple team members might work off conflicting datasets, leading to errors and wasted time [3].
With Querio feeding clean data into Power Query for transformations and Python handling advanced formatting, you’ve created a seamless pipeline. No more scrambling to fix spreadsheets on Friday afternoons - your reports now run themselves.
Automating Data Extraction with Querio AI
Once your warehouse connection is set up, Querio becomes your fastest option for getting Excel-ready data as part of a fully automated workflow. Forget spending hours on manual SQL queries that often come with syntax errors. With Querio, you just ask your questions in plain English, and it instantly converts them into accurate, dialect-specific SQL. The result? Live data pulled directly from your warehouse without the hassle of manual exports.
Writing Queries in Plain English
Querio’s standout feature is its ability to interpret business questions without requiring technical know-how. For instance, you could ask, "What were total sales by region for Q1 2026?" Querio will not only generate the correct SQL query but also apply any pre-defined business logic from your semantic layer. This ensures that terms like "Revenue" are calculated consistently, no matter when or how the question is asked.
Unlike traditional SQL, which can vary depending on who writes it, Querio introduces a centralized context layer. This standardizes joins and calculations across your team, ensuring consistency. Plus, if you’re ever curious about how a query works, the "Explain SQL" feature translates the generated code back into plain English, making it easier for non-technical users to review the logic. And if there’s a syntax error? The "Fix with AI" feature steps in to resolve it automatically.
Feature | Traditional Manual SQL | Querio AI SQL Generation |
|---|---|---|
Input Method | Manual Code Writing | Plain English Queries |
Speed | Hours/Days | Seconds/Minutes |
Accuracy | Prone to Syntax Errors | Dialect-Compatible & Governed |
Logic | Siloed in Scripts | Centralized Semantic Layer |
Verification | Manual Peer Review | "Explain SQL" Feature |
With this streamlined query process, exporting data to Excel becomes a quick and hassle-free step.
Exporting Querio Results to Excel
Once Querio delivers your data, exporting it to Excel is simple. The exported data is already formatted to meet US standards, saving you additional cleanup time.
Because Querio connects directly to live data, your Excel reports are always up-to-date. You won’t have to worry about using outdated CSV files or accidentally working with the wrong version of a report. Every export reflects the real-time state of your data warehouse, ensuring accuracy and reliability in your reporting.
Up next, learn how tools like Power Query and Power Automate can make refreshing your data even smoother.
Using Power Query and Power Automate for Data Refresh
After exporting data from Querio, keeping your Excel reports up-to-date is essential. Power Query manages the data transformation process, while Power Automate takes care of scheduling updates, so your workflow runs automatically.
Setting Up Power Query for Data Transformation
Power Query captures and records every step you take to prepare your data. Whether you're removing duplicates, standardizing date formats, or adjusting currency values, it saves these actions as "Applied Steps." Each time you refresh the data, Excel repeats these steps automatically.
For recurring reports from multiple files, the "From Folder" connector is your best friend. Navigate to Data > Get Data > From File > From Folder and select the folder containing your CSV or Excel files. Power Query will combine all the files into a single table. When new files are added to the folder, they'll automatically be included during the next refresh - no extra effort needed.
You can also add Conditional Columns for tasks like applying different tax rates based on date ranges or create Custom Columns for calculations like currency conversions or net pricing. To simplify troubleshooting later, rename each step in the Applied Steps pane for clarity.
"The core idea is brilliantly simple: define the process once, and let Excel run it forever. Shifting from manual data wrangling to an automated transformation saves teams hundreds of hours a year." - Querio
Once you've set up the transformation steps, the next step is automating the refresh schedule using Power Automate.
Scheduling Automated Data Refreshes
Power Automate takes over by scheduling data refreshes after Power Query processes the data. To make this work, your Excel file must be saved in OneDrive for Business or SharePoint Online - local files won't be compatible.
Start by creating an Office Script in Excel Online. Open your workbook in a web browser, go to the Automate tab, and write a new script with the following code:
This script tells Excel to refresh all Power Query connections.
Next, set up a scheduled cloud flow in Power Automate. Choose how often you want updates to occur (e.g., every weekday at 8:00 AM). Add the Run script action from the Excel Online (Business) connector, then specify your file location, document library, and the script you created. Save the flow, and your reports will update automatically.
A couple of things to keep in mind: ensure the Excel file isn't open in the desktop app during scheduled updates, as file locks can cause errors. Also, save your credentials under Data > Get Data > Data Source Settings so Power Automate can access external data sources securely.
With this setup, your Excel reports will seamlessly integrate live, formatted data from Querio, ensuring your automation pipeline stays intact and efficient.
Automating Formatting and Pivot Tables with Python
Python takes Excel automation to a new level by streamlining formatting, creating pivot tables, and adding charts. This is the final step in a complete automation process, covering everything from data extraction to polished report formatting. By combining Pandas for data handling with OpenPyXL for Excel-specific tasks, you gain full control over how your reports are presented.
Python Workflow for Formatting and Analysis
Start by loading your data with Pandas using functions like pd.read_csv() or pd.read_excel(). From there, apply filters, transformations, and generate summary tables using pd.pivot_table(). This allows you to perform aggregations such as sums, averages, or counts with ease.
When it comes to formatting, OpenPyXL offers precise tools. You can define reusable style objects, such as header_font = Font(bold=True, size=12) for headers or currency_style = '$#,##0.00' for financial data. These styles can be applied to specific cells or ranges using commands like ws.cell().font = header_font or ws.cell().number_format = currency_style. This approach ensures consistent formatting, especially for US-style reports.
To improve readability, adjust column widths dynamically with ws.column_dimensions['A'].width = 15. You can also use conditional formatting with openpyxl.formatting.rule.Rule to highlight important data points like overdue payments or negative balances. Studies show that leveraging OpenPyXL can reduce manual Excel processing time by up to 70%, and reusable style templates can cut formatting time by up to 40% for large files [5].
For datasets exceeding 100,000 rows, XlsxWriter is a better choice than OpenPyXL due to its speed and lower memory usage [4].
Once you've mastered these formatting techniques, you can integrate them with your Querio data exports to complete your automation pipeline.
Integrating Querio Data with Python Scripts
After automating data extraction with Querio, Python can handle the final formatting steps. Export your Querio data as a CSV or Excel file, load it into Pandas with pandas.read_csv(), and then apply OpenPyXL for formatting. Save the final product as a polished report, ready for use.
This workflow tackles the "last mile" tasks, such as advanced modeling, applying company branding, and automating distribution. You can even schedule Python scripts to run automatically using Windows Task Scheduler - for instance, every Monday at 9:00 AM - to keep reports consistently updated without manual effort [6].
Complete Automation Workflow with Querio
Building on the earlier steps, this phase integrates Querio's AI-driven features into a fully automated workflow, streamlining your data processes.
Building a Governed Automation Workflow
Querio revolutionizes Excel automation by directly connecting to your data warehouse - whether that's Snowflake, BigQuery, or Postgres - removing the need for manual CSV downloads. Instead of spending hours piecing together data from multiple systems, you can simply ask a question in plain English, like, "What is our customer retention rate?" Querio's AI takes care of generating the SQL, pulling real-time data, and delivering precise results [1][7].
A critical step in automation is defining governed metrics from the outset. With Querio, you can establish a master data dictionary, ensuring terms like "Revenue" or "Customer" mean the same thing across all reports. This consistency eliminates the risk of conflicting numbers between departments [7]. Starting small is key - begin by automating one high-impact report, like a P&L statement, to build trust in the system before expanding automation across your reporting suite [7].
Once the data is extracted, push it into Excel's pre-formatted templates, PivotTables, and dashboards for the final presentation. This stage uses the Python techniques discussed earlier to add specialized calculations or company branding. By combining Querio for data discovery and Excel for presentation, you get the best of both worlds: powerful automation and polished, branded reports.
With a governed workflow in place, it's worth comparing this AI-powered approach to traditional manual scripting.
Querio vs. Manual Scripting Methods
To evaluate automation options, it's helpful to compare Querio's AI-driven capabilities with conventional manual scripting methods. The differences become apparent when you consider maintenance needs and error rates. Manual scripts in VBA or Python often break when spreadsheet structures change, while Querio's managed platform adapts seamlessly to your data without constant updates [1][3]. Automation with Querio can cut human errors in complex calculations by up to 90% [7] and reduce data processing times by as much as 30% [3].
Feature | Querio (AI-Powered BI) | Manual Scripting (VBA/Python) |
|---|---|---|
Speed | Instant: Near real-time data processing [3]. | Slow: Requires manual execution and updates. |
Accuracy | High accuracy; reduces errors by up to 90% [7]. | Prone to human error and broken formulas. |
Maintenance | Low: Scales effortlessly with changes [3]. | High: Scripts often fail when structures are altered. |
User Accessibility | High; intuitive for non-technical users with plain English queries. | Low; requires advanced technical expertise. |
Conclusion
Automating Excel reports reshapes how businesses handle data by providing near-real-time insights and reducing processing times by up to 30% [3]. The benefits are clear: Glassdoor reported saving 190 hours per week by automating data review processes [3], and companies implementing automation experienced an average 22% drop in operating costs by 2024 [2]. Yet, despite these advantages, around 82% of organizations still rely on manual Excel processes [2].
Manual reporting keeps businesses stuck in the past, forcing them to make decisions based on outdated data. Automation flips the script, offering timely insights that drive smarter decisions [1]. By integrating tools like Querio for data extraction, Power Automate for scheduled updates, and Python for advanced formatting, businesses can eliminate inefficiencies - dubbed the "Excel tax" - caused by repetitive tasks, broken formulas, and version control headaches [3]. This shift allows analysts to move beyond mundane tasks and focus on delivering strategic insights.
To harness the full potential of automation, start by automating a single high-impact report. Establish clear metrics to ensure consistency, and then gradually expand your automation efforts. The tools are available, the benefits are proven, and automation can free your team to focus on what truly matters.
FAQs
What’s the simplest report to automate first?
The easiest reports to automate are those involving repetitive, manual tasks like importing data, formatting, or performing basic calculations. A good starting point is working on reports that need minimal technical expertise. For example, you could use Power Query to consolidate data from multiple sources or rely on Python libraries like pandas and openpyxl to handle daily or weekly updates. Tools like Power Automate are also great for streamlining such tasks. These straightforward processes are perfect for beginners, offering time savings and reducing the likelihood of errors.
How do I keep dates and dollars in US format automatically?
To keep dates and dollar amounts in US format in Excel, adjust the cell formats directly. Here's how:
Highlight the relevant cells, then right-click and select Format Cells.
For dates, go to the Date category and choose the MM/DD/YYYY format.
For currency, select the Currency category and ensure $ English (United States) is applied.
If you need to streamline this process across multiple reports, consider using VBA macros or Python scripts to apply these formats automatically.
What should I do if a scheduled refresh fails?
If a scheduled refresh doesn't work, the first step is to check the data connection and ensure the source data is both accessible and properly set up. Look over any error messages or logs to identify the root of the problem. Tools like Power Query or VBA may require manual adjustments if there are broken links or outdated credentials. To stay ahead of issues, monitor refreshes regularly and enable failure notifications to quickly tackle problems and minimize disruptions.
Related Blog Posts


