Business Intelligence
How to Build an Analytics Feature Customers Will Pay For
How to design, embed, and price AI-driven analytics that solve customer pain points, scale on cloud data stacks, and convert into paid features.
Creating analytics that customers are willing to pay for starts with one key principle: solve their biggest problems, not just display data. Most dashboards overwhelm users with numbers but fail to provide actionable solutions. To stand out, your analytics must address specific pain points, improve decision-making, and integrate seamlessly into workflows. Here’s how to do it:
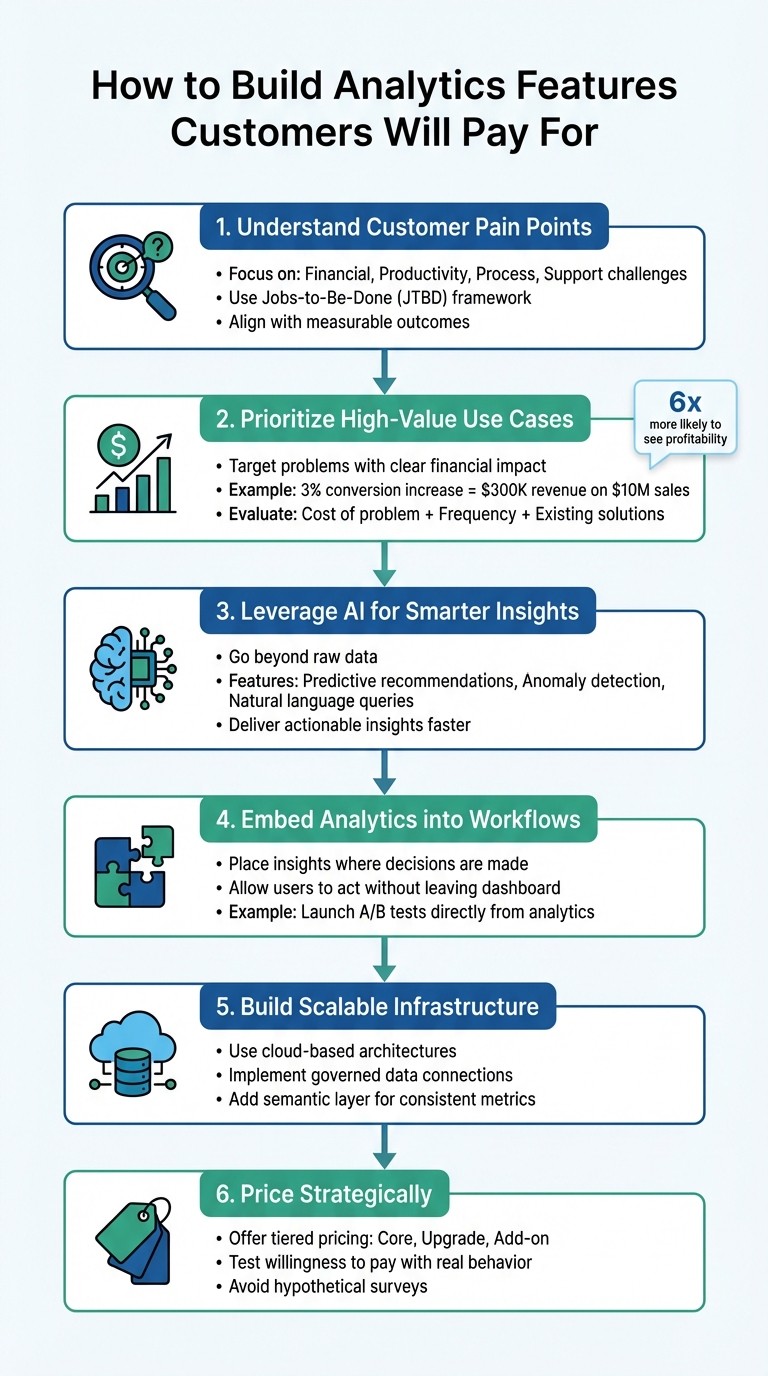
Understand customer pain points: Focus on financial, productivity, process, or support challenges. Use the Jobs-to-Be-Done (JTBD) framework to align analytics with measurable outcomes like reducing churn or boosting revenue.
Prioritize high-value use cases: Target problems with clear financial impact. For example, analytics that help an e-commerce business increase conversions by 3% can justify a $25,000 price tag.
Leverage AI for smarter insights: Go beyond raw data. Use AI for predictive recommendations, anomaly detection, and natural language queries to deliver actionable insights faster.
Embed analytics into workflows: Place insights directly where decisions are made. For example, allow users to act on data (e.g., launching A/B tests) without leaving the dashboard.
Build scalable infrastructure: Use cloud-based architectures, governed data connections, and a semantic layer for SaaS to ensure consistent metrics and reliable performance.
Price strategically: Offer tiered pricing (e.g., Core, Upgrade, Add-on) and test willingness to pay using real behavior, not hypothetical surveys.
6-Step Framework for Building Paid Analytics Features
How I build Analytics and BI Solutions - Data Analytics Expert's Blueprint
Finding Customer Needs and Paid Use Cases
When designing customer-facing analytics features, the goal should always be to tackle real customer problems. But here's the catch: customers often struggle to articulate their true needs. Instead of asking them what features they want, dig deeper into the core issues that influence their choices.
"When engaging with customer feedback, you're better off listening to the pain rather than the solution. The pain will tell you where the problem lies." – Sara Shaughnessy, Content Editor, Front
Start by grouping customer pain points into four main categories:
Financial: Issues like unclear ROI or costs outweighing the benefits.
Productivity: Tasks that take too long or feel inefficient.
Process: Complicated workflows or unnecessary steps.
Support: Poor assistance or slow response times.
Each of these categories presents a chance to build analytics that deliver measurable improvements. For instance, if customers are bogged down by productivity challenges, they might value analytics that pinpoint workflow bottlenecks instead of just presenting raw data. By focusing on these fundamental pain points, you can uncover analytics use cases that customers will find genuinely useful.
Understand Jobs-to-Be-Done for Analytics
The Jobs-to-Be-Done (JTBD) framework shifts the focus from features to outcomes. Customers don’t buy analytics features - they buy solutions to problems like reducing churn, increasing conversions, or optimizing resources. The key is to map these outcomes to specific, measurable KPIs that align with their goals.
For example, imagine a retail SaaS platform learning that store managers need to cut inventory waste by 15% to meet quarterly goals. A generic inventory dashboard won’t cut it. What they’ll pay for is a tool that predicts expiring products and suggests markdown pricing to clear them out. The result? A clear outcome, measurable KPIs, and direct financial benefits.
Engage with your sales and support teams - they’re on the front lines of customer frustrations. Use open-ended survey questions like, “What was your biggest struggle during the sales process?” to uncover challenges you might not have considered. These insights reveal the jobs customers are trying to accomplish and how analytics can help.
Prioritize Use Cases by Financial Impact
Once you’ve identified customer pain points, focus on use cases that promise clear financial returns. Not every analytics idea is worth pursuing. This is especially true when deciding whether to build or buy your analytics platform. Prioritize those that address costly problems or generate tangible revenue. Companies that leverage data effectively are six times more likely to see consistent profitability - but only if they’re solving the right problems.
Develop a simple framework to evaluate use cases based on three factors:
Cost of the problem: How much money is this issue costing customers?
Frequency: How often do customers encounter this issue?
Existing solutions: Are they already paying for alternatives?
For example, if your analytics can help an e-commerce director boost conversion rates by 3%, calculate the potential revenue impact. A company generating $10 million annually in online sales could see a $300,000 increase - making a $25,000 analytics feature an easy sell.
"A good monetization model is intrinsically linked to the problems a product solves, who it solves them for, and how it solves them." – Elena Verna, Dan Hockenmaier, and Patrick Campbell
Document each use case by persona, problem frequency, and financial impact. This approach ensures you’re building features that customers will see as essential, not optional.
Find Insights from Behavioral Data
After identifying high-impact use cases, validate them with behavioral data. Customers reveal what they value through their actions. Analyze query logs, dashboard usage, and clickstreams to understand where users experience friction and where they find value.
Pay attention to "value moments" - those specific actions where customers clearly benefit from your analytics. For instance, DocuSign found that 82% of agreements are completed within 24 hours, with 50% finalized in under 15 minutes. This speed metric became a cornerstone of their ROI story.
However, it’s important to distinguish between features users genuinely value and those they merely pass through. For example, a dashboard with high daily active users might just be a stepping stone to access a specific report, not a feature they’d pay for. Use journey mapping to identify and filter out this "transitional traffic." Focus on analytics that solve a direct problem and deliver real benefits, not the ones users encounter on their way to something else.
Designing AI-Driven Analytics Features for Workflows
Once you've pinpointed high-impact use cases, the next step is to create analytics that seamlessly integrate into existing workflows. The best analytics tools don't just deliver insights - they do so in ways that align with how users already work. This is where AI-driven capabilities and thoughtful design can turn a feature from something users tolerate into one they genuinely value. By embedding analytics directly into workflows, you provide in-context solutions that empower smarter decisions.
Add AI for Proactive, Actionable Insights
Raw data is just numbers on a page - it’s the insights that matter. AI takes analytics beyond static reports, transforming them into proactive tools that help users make decisions faster and smarter. Features like natural language querying let users ask questions in plain English and get immediate answers, bypassing the need for technical skills like SQL. AI-powered anomaly detection can catch unusual trends before they turn into costly problems, while predictive recommendations guide users toward the best possible actions.
Take the example of Vitality, an energy management platform. In 2020, they integrated Sisense analytics into their product instead of building their own solution. This decision allowed them to attract enterprise clients and expand into new markets by offering advanced, AI-driven visualizations that made energy optimization easier for customers. The key wasn’t just adding charts - it was delivering insights that helped users act without needing to manually sift through data.
The goal is to shorten the time between a question and an action. AI-generated summaries can break down complicated reports into clear takeaways in seconds. Tools like root cause analysis go a step further, helping users understand not just what changed but why. These features make analytics a natural part of decision-making, rather than just an add-on.
Embed Analytics Where Decisions Happen
Once you’ve built AI-powered insights, the next step is embedding them directly into the workflows where users already operate. Embedded analytics means users don’t have to open a separate tool to access insights - they’re built right into the application they’re already using. When analytics feel like a native feature, adoption rates soar. Many companies compare embedded analytics tools to meet customer demands for data and make their products stickier.
For example, between 2020 and 2021, Hive, a productivity platform, integrated a white-labeled analytics solution in just six to eight weeks. By adding a self-service BI layer instead of building one from scratch, they quickly stood out in the market and landed large enterprise clients. The secret? The analytics weren’t tucked away in a separate portal - they were part of the day-to-day tools managers already used to track team performance.
APIs play a crucial role here. They act as the backbone for custom user interfaces that match your product’s design. You can even embed action buttons directly into dashboards, allowing users to act on insights without leaving the screen. For instance, if your analytics detect a drop in conversion rates, users could launch an A/B test or tweak pricing right from the same dashboard. This kind of seamless integration transforms analytics into an essential part of the workflow, rather than an afterthought.
Localize Analytics for US Users
If your target audience includes US-based customers, localization isn’t just a nice-to-have - it’s a must. Analytics should display currency in US Dollars (USD), format dates as MM/DD/YYYY, and use commas as thousand separators (e.g., $1,000.00). These small details not only make the tool easier to use but also build trust with your audience.
It’s not just about formatting, though. Think about measurement units and cultural norms. Use imperial units like miles, pounds, and Fahrenheit where relevant, and align benchmarks with US standards. For example, if your analytics track sales performance, presenting quarterly results based on the US fiscal calendar (starting in January) will feel more intuitive to users than an alternative structure.
To gauge how well your analytics resonate with US users, track engagement using filters like “Language = English.” This can help you identify patterns and fine-tune your features for this audience. By paying attention to localization, you show that you understand your customers’ needs and make it easier for them to trust and adopt your analytics into their workflows.
Building a Scalable Data and AI Infrastructure
To deliver effective analytics features, you need a strong technical backbone. Without it, even the best features can falter with slow performance, inconsistent metrics, or unreliable AI outputs. Modern cloud-based architectures provide the flexibility and scalability needed to support both analytics and AI insights. This foundation is key to unlocking the potential of AI-driven insights.
Use Governed Cloud Data Connections
Your analytics feature must have secure, direct access to your data sources. Governed connections to cloud warehouses like Snowflake, BigQuery, or Postgres - with read-only credentials - ensure fresh data access and minimal latency. A great example of this is JetBlue's 2024 migration to Snowflake and dbt. Over three months, the airline integrated 26 data sources and built over 1,200 transformation models. The payoff? Pipeline uptime soared from 65% to 99.9%, and reporting inconsistencies dropped significantly.
Adopting an ELT (Extract, Load, Transform) model can further optimize your infrastructure. This approach involves loading raw data into your warehouse and performing transformations within it, leveraging the warehouse’s parallel processing capabilities. Autodesk followed this strategy when redesigning its analytics platform with Snowflake. The result was a 10x boost in data ingestion speed while requiring three times fewer staff to maintain the system compared to their old data lake.
Standardize Metrics with a Semantic Layer
A semantic layer vs traditional data models comparison shows how this bridge between raw database tables and business terms improves accessibility. By defining metrics, joins, and business terms once, it ensures that everyone - whether analysts, executives, or AI models - operates from the same playbook. Without this consistency, teams might calculate metrics like "revenue" differently, undermining trust in your analytics.
This structure relies on three key elements: Entities (like customer_id for joins), Dimensions (attributes like region or order_date), and Measures (numeric values such as order_total). These components provide the context AI models need to interpret your data. For instance, Snowflake’s Cortex Analyst achieves over 90% SQL accuracy by leveraging semantic models for context in real-world scenarios.
"A semantic layer acts as a translation layer between data and human language." - Kathryn Chubb, dbt Labs
Start with a focused approach. Identify three to five high-impact metrics for a specific use case rather than attempting to standardize everything at once. Use version control and CI/CD deployment to keep the semantic layer aligned with your data.
Integrate AI Services for Better Insights
With a solid infrastructure and semantic layer in place, incorporating AI services becomes much simpler. Specialized AI agents can classify questions, extract features, and generate SQL queries, reducing errors and improving accuracy compared to relying on a single large language model (LLM).
"An LLM alone is like a super-smart analyst who is new to your data organization - they lack the semantic context about the nuances of your data." - Nipun Sehrawat, Snowflake Engineering Blog
The semantic layer adds this critical context, helping AI understand not just table structures but also business logic - like calculating "Profit" as NET_REV - COGS. To ensure optimal AI performance, keep semantic views concise, ideally between 50–100 columns, and include representative, non-sensitive sample values in metadata to help AI interpret your data without exposing sensitive information.
A compelling example of this approach is the Canadian Football League's 2024 initiative. By creating a Customer 360 view on Snowflake, they consolidated over 120 data points per fan. This unified data allowed them to deliver personalized content, leading to a 9x increase in conversion rates and 3x better retention of marketable fans. Their infrastructure enabled them to act on insights quickly and consistently across all channels.
Packaging, Pricing, and Validating Your Analytics Feature
Transform your analytics feature into a revenue stream by pricing it in a way that reflects its true value to your customers.
Choose the Right Pricing Model
Selecting the right pricing model - whether it's seat-based, usage-based, outcome-based, or agent-based - depends on how your customers interact with your product. Each model has its pros and cons:
Seat-based pricing provides predictable revenue but can discourage customers from expanding access due to added costs.
Usage-based pricing aligns costs with actual consumption but can lead to unpredictable budgeting for customers.
For example, a conjoint analysis once led to a 67% price increase and boosted annual revenue by 25%-45%.
"Selling seats for your genAI feature can actually put you in the position of hoping your customers don't use your products." - Sarah Wang, General Partner, Andreessen Horowitz
Hybrid subscription models are becoming popular among B2B companies. These models combine flat-rate tiers with usage credits, offering flexibility. Keep in mind that 40% of IT buyers see seat reduction as their go-to strategy for cutting software costs, which makes relying solely on seat-based pricing increasingly risky.
Create Tiered Offerings for Analytics Features
Organize your analytics features into three distinct tiers - Core, Upgrade, and Add-on - based on their importance and value. For instance, basic reporting could fit into the Core tier, AI-driven insights might go into the Upgrade tier, and embedded analytics tools could be offered as an Add-on.
Using tiered metrics instead of continuous scaling can simplify choices for customers. For example:
Starter Plan: 1-5 users
Professional Plan: 6-20 users
Enterprise Plan: Unlimited users
This approach reduces friction and makes decision-making easier. According to an L.E.K. Consulting case study, transitioning to a "better/best" tiered model led 80% of new buyers to opt for higher-tier packages. Conjoint analysis helped identify which features customers valued most and were willing to pay for. Once your tiers are defined, it’s time to validate customer interest.
Test Willingness to Pay
After setting up your pricing model and tiers, gauge the market's willingness to pay. Avoid relying on hypothetical questions - real customer behavior is what matters.
"Anytime we ask anybody, 'What would you do?' - whether it's about pricing, behavior, or anything else - that response is garbage. Throw that answer away. It is completely unreliable." - Teresa Torres, Author and Product Discovery Coach
Start by learning what customers currently pay for similar solutions or how they’re solving the problem today. Then, use tools like mock pricing pages with "Join Waitlist" buttons to test interest. The best validation, however, comes from asking for real money. This could mean pre-orders, non-binding letters of intent (LOIs), or manual "concierge testing" to confirm value.
For B2B analytics features, have your sales team demo the feature and request a non-binding LOI before committing significant development resources. Track conversion rates across different price points to determine the optimal pricing sweet spot.
Measuring Success and Improving Product-Market Fit
Once your analytics feature is live, it’s crucial to monitor its performance to determine if it’s delivering value and contributing to revenue growth.
Track Adoption and Business Impact
Start by creating a metrics hierarchy that connects feature usage to business outcomes. At the top, identify your North Star Metric - a key indicator of overall product health, such as Weekly Active Subscribers. Beneath that, track Level 1 metrics, like total subscribers or expansion MRR, which align with departmental goals. Level 2 metrics should dive deeper, focusing on specific feature performance, such as retention rates for users engaging with your AI insights versus those who don’t.
Define what counts as active usage by focusing on meaningful actions. For example, track activities like generating insights, sharing reports, or exploring recommendations. A study of a music streaming app revealed that users who engaged with a social sharing feature on their first day had a 40% retention rate after 30 days, compared to just 5% for non-users. That kind of difference highlights whether a feature truly aligns with market needs.
Pay attention to both leading and lagging metrics. Leading metrics, like feature adoption and time-to-first-value, help predict success, while lagging metrics, such as ARPU uplift, expansion MRR, or reduced churn, confirm the impact over time. For B2B analytics features, segment your data by subscription tier to uncover which features drive upgrades. For instance, compare how Free and Premium users interact with the feature, and analyze detailed usage patterns to draw actionable conclusions.
Use Analytics on Analytics Usage
Leverage tools like Querio to understand how customers engage with your analytics feature. Build behavioral cohorts by grouping users based on specific actions - such as "Users who generated their first AI insight within 7 days" - and compare their conversion rates to the general user base. For example, one case study found that users engaging with a specific feature had a 45.2% conversion rate to paid plans, compared to just 14.1% for non-users. That’s a strong indicator of the feature’s ability to drive monetization.
Be mindful of transitional traffic - users who only pass through your analytics dashboard to access other areas, like a settings page, aren’t truly engaging with the feature. Use journey mapping to filter out this type of traffic so your engagement metrics reflect real value. These insights can guide you toward meaningful improvements based on how customers actually use the feature.
Continuously Improve Based on Customer Feedback
"Don't be data-driven - be data-informed. Data can tell you what is happening, while intuition tells you why it's happening." - Lenny Rachitsky, Advisor & Former Lead PM at Airbnb
While quantitative data shows you what users are doing, qualitative feedback uncovers the reasons behind their behavior. If engagement drops, talk to your customers to find out why. Are they struggling with the interface? Does the AI insight fail to meet their expectations? Or is the feature addressing the wrong problem altogether?
Test your hypotheses through A/B testing before implementing changes. For example, if customers request a new chart type or data source, validate that it actually boosts activation or retention rates. For more substantial updates, run willingness-to-pay tests to ensure you’re building features customers find valuable enough to pay for - not just features they mention in surveys. This iterative approach ensures your product remains aligned with real customer needs, strengthening its product-market fit.
Finally, revisit and update your tracking plan every quarter to keep it aligned with current user behaviors and key value moments.
Conclusion
Creating a paid analytics feature requires focusing on real-world solutions and delivering outcomes that matter. The goal is to transform raw data into meaningful insights that empower smarter decisions.
At the heart of this process is understanding your customers’ needs. It all starts with identifying the tasks your customers are trying to accomplish and pinpointing the key moments where value is delivered. From there, integrating an AI semantic layer into their workflows becomes essential. Combine this with a scalable data infrastructure and a metrics and semantic layers for standardized metrics, and you’ve built a system that evolves alongside your customers’ challenges.
Pricing should reflect the value your customers perceive. Whether it’s based on differentiated features, usage, or outcomes, a tiered pricing model allows you to cater to various segments - from casual users who need basic insights to enterprise teams requiring advanced analytics. For instance, in October 2024, Walmart Data Ventures reported a 173% year-over-year growth in customers and a 100% renewal rate for its Scintilla platform. This success came from combining rich shopper behavior data with AI-driven recommendations that transform insights into automated actions. Such strategies highlight the importance of aligning pricing with perceived value.
Finally, keep a close eye on metrics and customer feedback. While data tells you what is happening, feedback explains why. Striking this balance ensures your analytics feature stays relevant, addresses real customer needs, and continues to drive value. By delivering AI-powered insights that solve genuine problems, you’ll maintain customer trust and willingness to pay.
FAQs
How can I identify key customer pain points for building valuable analytics features?
To pinpoint your customers' most pressing pain points, start by implementing a voice-of-the-customer (VoC) program. This means gathering feedback from multiple sources, like surveys, interviews, support tickets, and tracking user behavior within your product. By combining what customers express with how they interact with your product, you can zero in on the problems that directly affect retention and revenue.
Then, dig deeper by asking key questions to gauge the demand for analytics features:
Are customers struggling to analyze data they currently can't access in your product?
Do they frequently export data or request custom reports?
Have they specifically asked for dashboards or reporting tools?
Once you've gathered this information, prioritize opportunities by considering three essential factors: how urgent the customer problem is, whether you already have the necessary data, and your technical ability to address the issue. This approach helps ensure you're developing features that tackle real challenges and deliver measurable value for your U.S.-based audience.
What’s the best approach to seamlessly integrate analytics into existing workflows?
To make analytics a natural part of workflows, treat it as a core feature right from the start. The process begins with defining clear objectives that link analytics to the decisions users need to make. By planning integration during the early stages of product design, you can ensure that data visualizations, alerts, and insights are seamlessly woven into the user interface. This proactive approach helps avoid expensive redesigns down the road.
Leverage modular, API-driven components to deliver analytics that are flexible and context-aware. This ensures users get relevant data exactly where and when they need it. Stick to proven software practices like version control, automated testing, and detailed documentation to maintain reliability and performance.
When launching the feature, include training, in-app guidance, and opportunities for user feedback to fine-tune the analytics to match real-world needs. This thoughtful approach enhances the user experience, making the insights not just accessible but worth paying for.
How can I choose the best pricing model for my analytics feature?
Choosing the right pricing model for your analytics feature starts with a deep understanding of your customers and the value your feature brings to the table. Start by diving into customer behavior - look at how various price points influence usage, conversions, and churn. This gives you a clearer picture of what your customers are willing to pay and ensures your pricing reflects the value they perceive.
From there, explore common SaaS pricing models to see which fits your feature best. A tiered subscription can be a smart choice if you want to segment customers based on data usage or specific feature needs. If demand tends to fluctuate, a usage-based model might be more effective. For features that directly impact measurable outcomes - such as boosting revenue or cutting costs - value-based pricing could be the way to go, as it ties your pricing to the tangible results you deliver.
Once you’ve chosen a pricing approach, test it on a smaller scale. Experiment with different price points or models, keeping an eye on metrics like Monthly Recurring Revenue (MRR) and churn rates. Use these insights to fine-tune your strategy. By aligning your pricing with both customer value and your business objectives, you can build a model that not only drives revenue but also meets market expectations.
Related Blog Posts


