Business Intelligence
The notebook-first BI stack for data engineers who hate dashboards
Replace dashboards with reactive notebooks (SQL/Python), live warehouse connections, shared metrics, and AI to speed reporting and cut costs.
Dashboards are outdated for technical teams. A notebook-first BI stack offers a better way: it replaces dashboards with code-driven workflows using SQL, Python, and Markdown. Here's why this matters:
Efficiency: No need to recreate insights in separate tools. Workflows align with software development practices.
Cost Savings: Companies report saving 70–95% on licensing fees, cutting dashboard counts by 40–70%.
Flexibility: Notebooks allow real-time data exploration, unlike rigid dashboards.
Transparency: Version control and shared metric and semantic definitions ensure consistent, auditable results.
Querio's platform connects directly to live data warehouses, enabling reactive notebooks and AI-powered query generation. This approach simplifies collaboration, reduces maintenance, and speeds up reporting cycles by up to 20×. It’s a modern, streamlined solution for data engineers who want control without the clutter of unused dashboards.
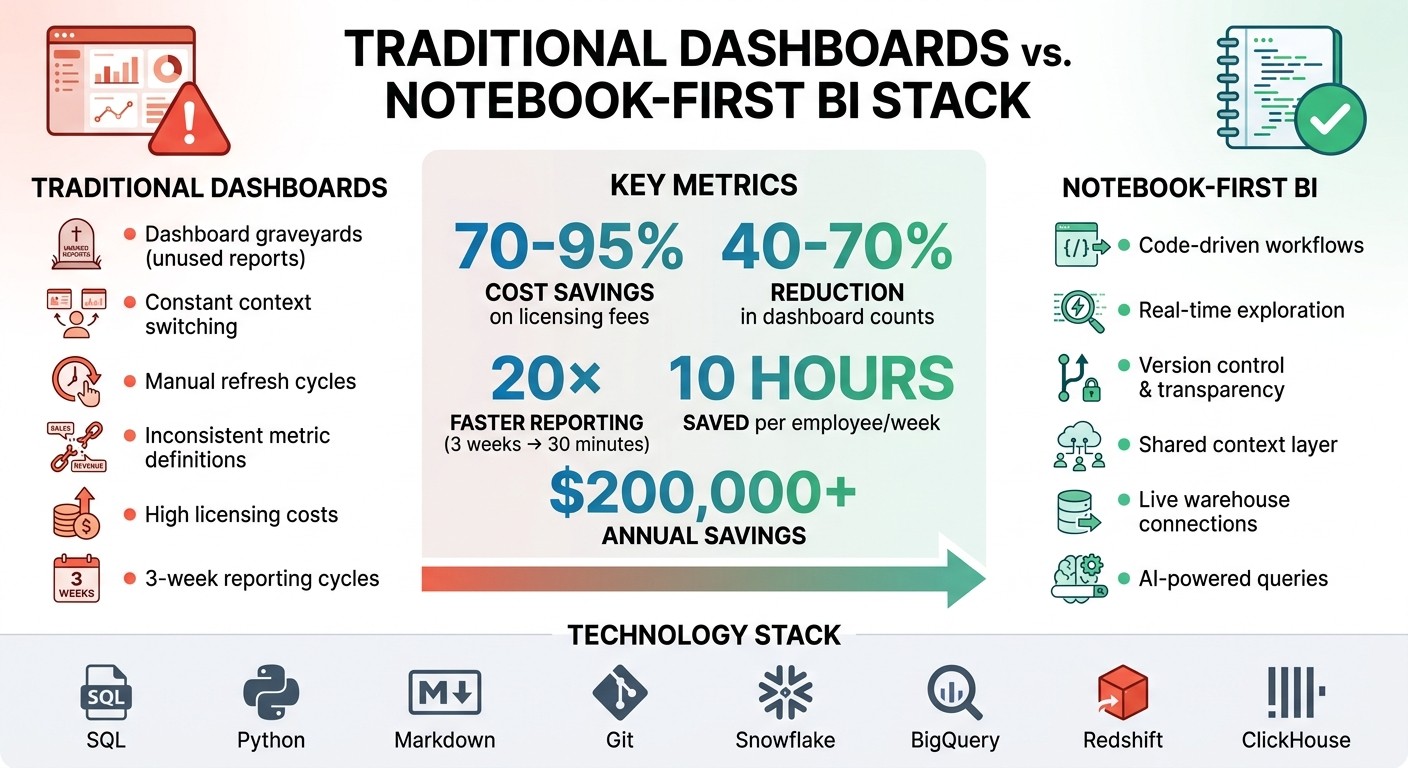
Dashboards vs Notebook-First BI: Cost Savings and Efficiency Comparison
Why Data Engineers Prefer Notebooks Over Dashboards
Dashboard Limitations for Technical Users
Dashboards are great for answering predefined questions with structured KPIs, but they fall short when it comes to exploring large, unstructured datasets. Mahdi Karabiben highlights this limitation:
"The problem with such technologies [dashboards] is that they were built with data discovery in mind... they neglect one key element: data exploration" [2].
One major frustration for engineers is the "human SQL API" issue. This happens when stakeholders constantly request minor SQL adjustments, turning engineers into query machines and creating significant inefficiencies.
Another issue is the rise of "dashboard graveyards." These dashboards are often created to showcase a "data-driven" image but are rarely used for meaningful decision-making. Ahmed Youssef, a Data Solution Architect, points out:
"Orphaned dashboards quickly become technical debt, forcing engineers to maintain rarely used pipelines" [3].
When upstream data models change, these unused dashboards often break, requiring engineers to spend time troubleshooting outdated reports. This inefficiency underscores the need for a different approach - enter notebooks.
How Notebooks Enable Better Analysis
Notebooks provide a more dynamic and integrated environment, addressing many of the limitations of dashboards.
One big advantage is the elimination of constant context switching. Notebooks allow engineers and data scientists to work together seamlessly, using both SQL and Python in a single environment. This setup supports real-time exploration and enables iterative data transformations without waiting for dashboard updates.
Notebooks also offer logic transparency. Every step of the analysis is visible, making it easier to audit and troubleshoot. As Mahdi Karabiben puts it:
"Dedicating the main portal to your data merely to insights means that you're only reading the first page of a very interesting book" [2].
Another benefit is the immediate feedback provided by notebook kernels and interpreters. Unlike dashboards, which require rebuilding and republishing for updates, notebooks allow for quick testing and validation of ideas. This responsiveness is crucial for tasks like hypothesis testing and ensuring data quality.
Many teams are now taking notebooks beyond experimentation. By using tools like Dagster or Papermill, they can parameterize and schedule notebook-based pipelines, turning these flexible environments into reliable, production-ready solutions [1].
What Makes Up a Notebook-First BI Stack
Creating a notebook-first BI stack involves three key components: direct warehouse connectivity, a reactive notebook environment, and a shared context layer for consistent metrics. Each of these addresses specific challenges that traditional dashboard-driven systems often present for data engineers.
Live Data Warehouse Connections
Direct connections to your data warehouse eliminate the need for creating data extracts, duplicates, or intermediate storage. Instead, you query the data where it resides - whether that’s in Snowflake, BigQuery, Amazon Redshift, or ClickHouse.
This setup ensures your data is always up-to-date. Whenever your warehouse updates, your analysis reflects those changes instantly. Queries consistently pull the latest data without requiring manual refreshes.
Querio takes this a step further by using encrypted, read-only credentials to securely connect to your warehouse. This ensures that your data never leaves your infrastructure, and analysts can’t unintentionally alter production tables. With this live connection, engineers no longer need to manage sync schedules or worry about outdated dashboards. Every query runs against the most current data, providing a solid foundation for a reactive notebook experience.
Notebook Platforms and Querio's Reactive Environment
Building on live data, a reactive notebook environment ensures seamless collaboration and up-to-date analysis across teams.
While traditional platforms like Jupyter are excellent for individual exploration, they fall short when it comes to team collaboration and live updates. For example, if one analyst updates a metric or modifies a transformation, others might not see those changes unless they manually re-run cells or fetch the latest version.
Querio’s reactive notebooks address this by automatically updating all related cells whenever underlying logic changes. This ensures everyone works with the most current analysis, reducing the common "it works on my machine" problem seen with file-based notebooks.
Additionally, Querio transforms notebooks into shared team assets. Analysts can edit, duplicate, and build on each other's work within a shared workspace. Since Querio notebooks are stored as .py files, they integrate seamlessly with Git-based workflows. This allows for version control, making it easier to track changes, review contributions, or roll back when necessary [5].
Shared Context Layer for Consistent Metrics
One of the biggest hurdles in scaling analytics isn’t technical - it’s semantic consistency. Different teams often define metrics differently, join tables inconsistently, or use conflicting business definitions. This leads to confusion and undermines confidence in data-driven decisions.
A shared context layer resolves this by standardizing joins, metrics, and business terminology. For example, if both the finance and product teams request "monthly recurring revenue", they’ll receive identical results because both queries rely on the same governed definition.
Querio’s semantic layer ensures this consistency by allowing data teams to define logic - such as how to calculate customer lifetime value or what qualifies as an "active user" - once. This logic then applies across all use cases, whether someone is querying in plain English, writing SQL in a notebook, building a dashboard, or embedding analytics in an application. This approach guarantees uniform results and builds trust in the data being used for decision-making.
How to Build Scalable Notebook Workflows
If you're aiming to fully adopt a notebook-first BI stack, scaling your workflows from initial exploration to dependable production is a must. It’s not just about connecting to your data warehouse and running queries - it’s about creating workflows that can handle analytics at scale. Here’s how you can evolve exploratory notebooks into workflows that deliver consistent results.
Transforming Raw Data into Analysis-Ready Tables
The first step in scaling your notebook workflows is parameterization. This process allows you to turn ad-hoc analysis into repeatable templates. Tools like Papermill make this possible by enabling dynamic inputs - such as date ranges, region IDs, or customer segments - so you don’t have to hardcode values. With parameterization, a single notebook can cover multiple use cases, eliminating the need for countless one-off copies.
Next comes modularization, where you take stable transformation logic from your notebook cells and move it into standalone Python libraries (often stored in a /src directory). This approach not only makes your code easier to manage but also lets you use testing frameworks like pytest to catch errors early. As data engineer Daniel Beach explains:
The issue is not that notebooks exist... The issue is that some engineers never transition out of the exploratory phase into a more disciplined approach to building software [4].
By converting notebooks into Python scripts, you create maintainable production assets. This allows for cleaner code reviews and smoother collaboration among team members. For example, Querio integrates with Git, streamlining version control from the start. Once your transformation logic is modular and version-controlled, the next step is automation.
Automating Data Transformations with Orchestration
Running notebooks manually doesn’t scale. To ensure your workflows can handle regular data updates, you’ll need to integrate parameterized notebooks into orchestration frameworks like Dagster. These platforms treat notebooks as production-grade assets, offering features like lineage tracking, monitoring, and automated scheduling.
Dagster stands out because it lets you prototype directly in a notebook and transition that same logic into production without rewriting code. By defining notebooks as "ops" or "assets" in a pipeline, Dagster handles execution, dependencies, and failure notifications - making it easier to move from exploration to production.
To add another layer of reliability, incorporate quality gates. Configure your orchestrator to refresh notebooks only after upstream data quality tests pass, whether those tests run in dbt, Coalesce, or your warehouse. This ensures that only validated data flows into your analytics stack. Querio’s shared context layer further enhances reliability by maintaining consistent metric definitions across all outputs, ensuring standardized analytics at scale.
Moving from Dashboards to Querio's Notebook-First Workflow
Shifting from traditional dashboard-based analytics to a notebook-first workflow keeps business users at the heart of the process. Querio makes this possible by allowing technical teams to maintain complete control over analytics logic while empowering non-technical users to explore data independently. The platform treats analytics like software - complete with version control, transparency, and collaboration. This setup lays the groundwork for integrating AI-driven query generation and fostering seamless teamwork. The result? A smoother path to AI-powered queries and real-time collaboration across teams.
Plain English to Code with AI
Querio takes things a step further by using AI to bridge the gap between natural language and code. It can transform plain English questions into SQL or Python code that runs directly against your live data warehouse. Every query is visible and editable, ensuring full transparency. For instance, a business user might ask, "What's our customer churn rate by region this quarter?" and instantly see the corresponding code. If tweaks are necessary, users can switch to exploration mode to refine the query or hand it off to a data engineer. This level of transparency fosters trust - when a finance analyst can view the exact SQL that calculates revenue, they can confirm it aligns with their expectations. Data engineers can then review, approve, and add these AI-generated queries to a shared context layer for future use. As Querio emphasizes:
Analytics should work like software that your team and AI can operate on [5].
Team Collaboration in Notebooks
Querio's reactive notebook environment is designed for seamless teamwork. When a team member updates a metric or fixes a calculation, all dependent cells automatically recalculate - similar to how a spreadsheet updates formulas. Additionally, Querio’s "Boards" feature allows engineers to publish specific notebook cells as live, interactive reports. These reports stay up-to-date through live connections to the data warehouse. Stakeholders can drill into the underlying data while maintaining consistent metrics across the team.
Case Study: B2B SaaS Company Adopts Notebook-First Analytics
Adopting a notebook-first workflow has delivered significant benefits for organizations. For example, companies using Querio have reported saving over $200,000 annually, cutting reporting cycles from three weeks to just 30 minutes - a 20× improvement - and enabling employees to save an average of 10 hours per week on analysis [5]. The transition usually begins with data engineers connecting Querio to their existing data warehouse (like Snowflake, BigQuery, Redshift, or PostgreSQL), migrating key metrics into a shared context layer, and moving recurring reports into reactive notebooks. Business users then start querying in plain English, gaining confidence as they see the transparent, editable code behind every response. Within weeks, teams experience fewer ad-hoc data requests and more self-sufficient analysis across departments.
Conclusion
A notebook-first BI stack reshapes how data teams deliver analytics. Instead of relying on rigid dashboards, this approach embraces a code-driven, transparent, and collaborative workflow. Data engineers retain full control over the logic behind analytics, while business users gain the flexibility to explore data on their own terms. The result? Faster insights, reduced costs, and analytics that evolve alongside your team.
Querio embodies this philosophy by integrating reactive notebooks, live warehouse connections, and AI-powered query generation into one platform. Each query produces fully inspectable SQL or Python code, ensuring transparency. Metrics are stored in a shared context layer, maintaining consistent definitions across the organization. When a team member updates a calculation, all dependent analyses automatically refresh - no manual intervention needed. These features lead to clear, measurable financial gains.
The benefits are hard to ignore. A code-first BI approach eliminates costly per-seat licensing fees, delivering substantial savings. Organizations using Querio report 20× faster reporting cycles and employees reclaiming an average of 10 hours per week from analysis tasks [5]. By applying engineering principles - like version control, peer reviews, and automated testing - to analytics, data teams can elevate their work to a whole new level of precision and efficiency.
This notebook-first approach isn’t just a shift in tools; it’s a shift in mindset. It’s analytics designed to fit seamlessly into the way your team operates, rather than forcing your team to adapt to the tools.
FAQs
When should dashboards still be used?
Dashboards work best for static, high-level reporting, offering executive summaries and a clear visual snapshot of key performance indicators (KPIs). They’re particularly effective for non-technical stakeholders who need quick, digestible insights to guide decision-making.
How do notebook workflows scale safely to production?
Notebooks can transition smoothly from development to production by tackling issues such as version control, stability, and integration with other systems. Tools like Querio make this process easier by enabling features like version tracking, team collaboration, and governance. Using a notebook-first approach minimizes risks like hidden states or inconsistent outcomes by merging development and deployment into a single workflow. This ensures real-time data access and simplifies operations in production settings.
How do we keep metric definitions consistent across teams?
Querio keeps everyone on the same page by using a centralized governance layer. This system enforces standardized metric definitions, ensuring that all teams work with the same data interpretations.
It also incorporates role-based permissions to control access and safeguard sensitive information. Plus, compliance measures are baked in to maintain data accuracy, security, and consistency across the board.
Related Blog Posts


