Business Intelligence
natural language query business intelligence ThoughtSpot vs Power BI vs Tableau 2026
Natural language queries now define BI: weigh search-first, ecosystem-integrated, or metrics-driven platforms for real-time insights, governance, and cost.
Choosing the best business intelligence tool in 2026 comes down to how well each platform handles natural language queries (NLQ). Here's a quick breakdown:
ThoughtSpot focuses on search-driven analytics, offering live data query capabilities through Spotter AI. It's ideal for teams needing quick, real-time insights without technical expertise. Pricing starts at $25/user/month or $0.10/query.
Power BI is transitioning to its AI Copilot feature, retiring its Q&A tool by December 2026. Copilot integrates with the Microsoft ecosystem but requires well-structured data models. Pricing starts at $14/user/month for Pro, with additional costs for Fabric capacity.
Tableau emphasizes metrics through its Pulse and Enhanced Q&A features, delivering KPI-focused insights. It’s best for organizations prioritizing visual storytelling. Enhanced Q&A is part of the Tableau+ Bundle, which requires Salesforce integration.
Each tool has strengths tailored to specific use cases, such as fintech, e-commerce, or teams already embedded in Microsoft or Salesforce ecosystems. Key considerations include essential BI tool features like ease of use, integration, and pricing.
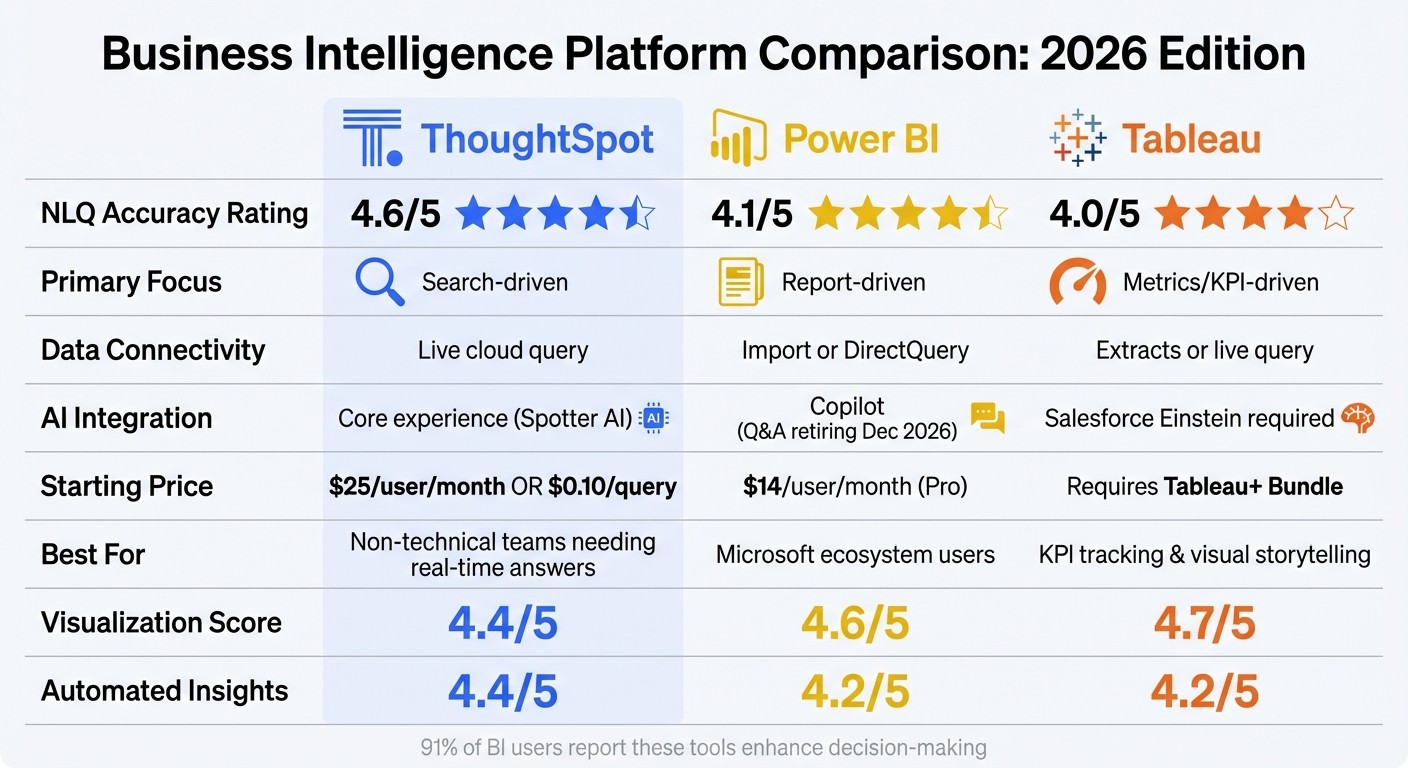
Quick Comparison
Feature | ThoughtSpot | Power BI | Tableau |
|---|---|---|---|
NLQ Accuracy | 4.6/5 | 4.1/5 | 4.0/5 |
Primary Focus | Search-driven | Report-driven | Metrics/KPI-driven |
Data Connectivity | Live cloud query | Import or DirectQuery | Extracts or live query |
AI Integration | Core experience | Copilot (Q&A retiring) | Salesforce Einstein required |
Starting Price | $25/user/month or $0.10/query | $14/user/month (Pro) | Requires Tableau+ Bundle |
For non-technical teams needing real-time answers, ThoughtSpot stands out. Power BI is a solid choice for those in the Microsoft ecosystem, while Tableau excels in KPI tracking and visualizations.
ThoughtSpot vs Power BI vs Tableau 2026 Feature Comparison
First Look at Natural Language Query in PowerBI
ThoughtSpot: Search-Driven Analytics with Spotter AI
ThoughtSpot brings natural language queries (NLQ) front and center, allowing users to search through data as effortlessly as browsing the internet. At the heart of this platform is Spotter AI, which connects directly to live cloud data warehouses, enabling users to explore data without the need to build dashboards first.
What makes Spotter AI stand out is its patented search model, which interprets raw data in context. For instance, if you ask, "show me checkout abandonment by payment method," the AI understands table relationships, applies the correct filters, and scans billions of rows to deliver precise results. The latest release, Spotter 3, takes this even further - it handles multi-step analyses, complex queries, and can even pull data from external tools like Slack or Confluence during an ongoing conversation.
Spotter AI also incorporates a human-in-the-loop governance system, allowing users to approve or refine AI-generated answers. The platform uses search tokens to reveal data lineage, ensuring transparency without requiring any SQL expertise. This is especially crucial for teams, like those in finance, that need complete confidence in the accuracy of their data. With these capabilities, ThoughtSpot creates a strong foundation for its NLQ-driven offerings.
ThoughtSpot's NLQ Features
Spotter AI’s Auto Mode simplifies the process by automatically selecting the most relevant data models for each query. For example, a marketing manager doesn’t need to know technical details about data tables - they can simply ask a question, and the AI handles the rest.
The platform also includes Spotter Shortcuts, which allow users to type "@" to quickly select specific columns or filter values. This combination of natural language and precise inputs makes queries more accurate and user-friendly.
To ensure trust, the Answer Explainer feature provides full data lineage, showing exactly where each number comes from and detailing how calculations are performed. This level of transparency is particularly critical in industries like fintech, where audit trails and regulatory compliance are non-negotiable.
Finally, ThoughtSpot’s pricing model is straightforward, offering per-user pricing that ensures everyone has access to the same AI-powered features. This avoids the common "creator versus viewer" licensing issues seen in top business intelligence tools.
What ThoughtSpot Does Well and Where It Falls Short
ThoughtSpot excels at making data accessible to everyone. Non-technical teams can get answers in minutes without relying on analysts. Because it connects to live data, insights are always up-to-date - there’s no need to work with outdated extracts or pre-aggregated data. For organizations already leveraging cloud data warehouses, ThoughtSpot is quick to set up and scales effectively, even with massive datasets. Its search-first design positions it uniquely in the NLQ space.
That said, ThoughtSpot’s focus on search can be a drawback for teams that rely heavily on traditional dashboards or highly detailed visualizations. The platform’s interface may feel restrictive for users who need static, polished reports. Additionally, its pricing model, based on data and users, could pose challenges for smaller startups with limited budgets - especially in fast-paced industries like fintech or e-commerce, where agility is key. For these teams, finding the best business intelligence tools for startups is essential for balancing cost and performance.
Power BI: Q&A and AI Copilot for Natural Language Queries
Power BI is stepping up its game in natural language queries with a mix of older tools and emerging AI capabilities. It currently offers two systems: the legacy Q&A feature and the newer AI Copilot, which leverages Azure OpenAI. However, Microsoft has announced that the Q&A feature will be retired by December 2026, making Copilot the go-to tool for conversational analytics moving forward [3][5].
While the legacy Q&A feature highlighted matches with colors, it often fell short when compared to the capabilities of generative AI. Enter Copilot, a tool that dynamically creates Data Analysis Expression (DAX) queries. It also provides a "How Copilot arrived at this" feature, offering transparency - a critical feature for finance and compliance teams who need to verify AI-driven results [7][8].
Copilot integrates seamlessly with Microsoft Fabric and OneLake, allowing users to pull data from multiple reports or semantic models simultaneously. It even supports voice dictation on iOS devices [6][7][11]. However, using Copilot requires a Fabric capacity of F2 or higher, or a Power BI Premium capacity of P1 or above. Power BI Pro or Premium Per User licenses alone won’t suffice [6][9].
These updates position Copilot as a powerful tool for natural language querying (NLQ). For a deeper look at how these systems work, see our natural language querying in BI guide.
Power BI's NLQ Features
One standout feature of Copilot is its ability to generate narrative summaries. Instead of simply answering questions, it can create entire report pages, complete with visualizations and written explanations of trends and patterns. For instance, a query about quarterly revenue could result in a chart alongside a paragraph explaining the factors driving those trends.
The standalone Copilot (currently in preview) takes this further by enabling searches across any report or semantic model the user has access to [6][9]. This means you don’t need to know which report holds the answer - Copilot can find it for you.
Another feature, available through Copilot in Fabric Notebooks, is the "Semantic Link" capability. This allows data teams to manage semantic models, making it easier for business users to interact with data through conversational queries [11]. However, the accuracy of Copilot's responses heavily depends on how well the data is prepared. Model owners must ensure their data includes detailed descriptions, synonyms, and clearly defined relationships. Without this groundwork, Copilot may misinterpret the data or provide generic responses [6].
What Power BI Does Well and Where It Falls Short
Power BI excels in several areas. Its integration with the Microsoft ecosystem is a major advantage. Organizations already using tools like Excel, Teams, and Azure will find Power BI fits seamlessly into their workflow. Additionally, its ability to generate DAX queries on the fly eliminates the need for constant analyst intervention.
Another strength is its capability for report summarization. Copilot can break down complex dashboards into plain-language summaries, making it easier for executives to understand key insights without diving into every chart.
However, there are limitations. Copilot currently cannot handle advanced analytics tasks like anomaly detection or forecasting through natural language queries [8]. The tool is also inconsistent - identical prompts can yield different results across sessions [7]. Users need to be trained to validate outputs and know when to clear the chat history to avoid confusing the AI with unrelated context [6].
There are also regional and language constraints. Copilot is disabled by default in tenants outside the US and France unless administrators enable data processing for other regions [4][6]. Language support is primarily in English, with Spanish only available in preview [5].
For teams in industries like fintech or e-commerce, where data models are often complex, Power BI's reliance on well-prepared semantic models can be a challenge. Unlike tools that connect directly to live data warehouses, Power BI requires upfront modeling work. If this foundation isn’t solid, Copilot’s responses can lack accuracy or depth [6][10].
Tableau: Pulse and Enhanced Q&A for Metrics-Focused Queries
Tableau takes its own path in natural language querying (NLQ), focusing on metrics and predefined KPIs rather than raw data exploration.
In early 2024, Tableau transitioned from its keyword-based "Ask Data" feature to Tableau Pulse, a platform centered on metrics. Pulse operates through a centralized Metrics Layer, where analysts define KPIs once, ensuring consistent data across the organization [12]. This approach is designed with non-technical users in mind [12].
The standout feature is Enhanced Q&A (Discover), launched in 2025. This premium tool harnesses Large Language Models (LLMs) to analyze multiple metrics at once. Instead of a single chart, Enhanced Q&A generates Insight Briefs - executive-style summaries that highlight shared contributors, correlated trends, and outliers across KPIs [13]. Phil Naranjo, Product Management Director at Tableau, describes the feature:
"Enhanced Q&A allows users to ask complex, multi-metric questions and receive contextual, AI-generated insights that connect patterns for multiple metrics." [13]
A key aspect of Tableau's approach is separating statistical calculations from language generation. While LLMs handle narrative synthesis, the statistical computations remain deterministic. Every AI-generated insight includes citations, ensuring transparency. As Naranjo puts it:
"Frontier LLMs are a bit like a genius with an occasional lapse in judgment... we never let the LLM do math - it's not calculating the statistical insights." [13]
Citations link directly to source charts, helping users verify results - an essential feature for finance and compliance teams.
Tableau's NLQ Features
Enhanced Q&A works by analyzing Metric Groupings, which are collections of related KPIs sharing the same time granularity or dimensions. It identifies patterns, flags anomalies, and explains contributing factors [13].
To assist users who may not know where to start, the platform offers templated questions that encourage further exploration. Homer Wang, Product Manager at Tableau, explains:
"Pulse already answers business questions before business users even know what they want to explore or what questions to ask." [14]
Insights are delivered directly through platforms like Slack or email, removing the need to open dashboards.
Enhanced Q&A also adapts to the user's query language while keeping metric names intact [13]. However, it's worth noting that this feature is available only through the Tableau+ Bundle, which requires integration with Salesforce and Einstein generative AI [13]. It’s also exclusive to Tableau Cloud [12].
What Tableau Does Well and Where It Falls Short
Tableau's metrics-first design shines for teams that need consistent KPI tracking across large groups of non-technical users. The system proactively identifies unusual changes, key drivers, and trends without requiring manual queries [13]. Its explainability features - complete with citations and interactive charts - make complex data more accessible. For example, users can ask the system to simplify explanations, such as clarifying a period-over-period change in plain terms. This combination of narrative and visualization is particularly useful for fintech teams managing regulatory reports or e-commerce teams tracking seasonal trends across products [13].
That said, Tableau has its limitations. Its NLQ capabilities are confined to metrics within the Pulse framework. It can’t query raw data columns or perform custom calculations on the fly [13]. This makes it less effective for highly granular datasets, such as minute-by-minute logs or static survey results [13].
Cost and platform requirements are additional hurdles. Enhanced Q&A is a premium feature tied to the Tableau+ Bundle, which requires Salesforce Einstein integration. For organizations not already using Salesforce, this adds complexity and expense [13]. Additionally, the system relies on well-structured time-series data and standardized dimensions, requiring upfront investment in data preparation [13].
Tableau's focus on standardized metrics reflects a broader trend in modern analytics: prioritizing efficiency and AI-driven insights in business intelligence.
ThoughtSpot vs Power BI vs Tableau: Feature Comparison
When comparing ThoughtSpot, Power BI, and Tableau, their strengths in natural language query (NLQ) capabilities stand out. Each platform offers a unique approach to AI-driven analytics, which can help organizations align their needs with the right tool.
ThoughtSpot earns a 4.6 out of 5 rating for NLQ accuracy, outpacing Power BI at 4.1 and Tableau at 4.0 [15]. Its high rating is largely due to its search-first design and features like "Spotter Coach", which uses a matching panel to map queries to data fields [16]. Pricing begins at $25 per user per month or $0.10 per query [15].
Power BI, rated 4.1/5 for NLQ, is shifting its focus from the legacy Q&A visual - scheduled for retirement in December 2026 - to its newer Copilot feature [3]. Microsoft describes this shift as follows:
"Q&A experiences are going away in December 2026. We recommend using Copilot for Power BI, which offers a more advanced and integrated way to query your data using natural language" [3].
Power BI uses color-coded underlines to indicate confidence levels: blue for matches, orange for ambiguous terms, and red for unrecognized queries [3]. Pricing starts at $14 per user per month for Pro and $24 per user per month for Premium, with Copilot requiring additional Fabric capacity starting at $9,000+ per year [15].
Tableau, with a 4.0/5 NLQ rating, emphasizes a metrics-first approach through its Pulse feature rather than raw data exploration [15]. It employs a "Data Index" to manage field metadata and roles, though Enhanced Q&A is only available with the premium Tableau+ Bundle, which includes Salesforce Einstein integration [16][13].
Here’s a quick overview of their key differences:
Feature | ThoughtSpot | Power BI | Tableau |
|---|---|---|---|
NLQ Accuracy Rating | 4.6/5 | 4.1/5 | 4.0/5 |
Primary Approach | Search-driven/AI-native | Report-driven/AI-assisted | Metrics-driven/AI-assisted |
Data Connectivity | Live cloud query | Import or DirectQuery | Extracts or live query |
AI Integration | Native to core experience | Transitioning to Copilot (Q&A retiring) | Separate from core dashboards |
Starting Price | $25/user/month or $0.10/query | $14/user/month (Pro) | Requires Tableau+ Bundle |
Governance | Metadata-driven/Self-service | Einstein Trust Layer/RLS |
When it comes to visualization, Tableau leads with a 4.7 out of 5 score, followed by Power BI at 4.6, and ThoughtSpot at 4.4 [15]. For automated insights, ThoughtSpot edges ahead with a 4.4 rating, while Power BI and Tableau each score 4.2 [15]. All three platforms tie at 4.4 for ease of deployment [15]. According to research, 91% of BI users report that these tools significantly enhance decision-making, especially in financial reporting [17].
This comparison highlights how each platform’s NLQ capabilities align with modern analytics needs, offering a foundation for exploring their specific use cases in competitive markets.
Use Cases and Platform Recommendations for 2026
Let’s match each platform’s strengths to specific industry needs, based on the earlier feature comparisons.
Best Options for Fintech and E-Commerce Teams
Power BI is a strong choice for organizations already using Microsoft 365. Its seamless integration with Microsoft’s ecosystem ensures compatibility with existing security and collaboration workflows. However, keep in mind that by December 2026, transitioning from Q&A to Copilot will be necessary, so planning ahead is crucial [3].
ThoughtSpot stands out for teams that need real-time data access. Its search-based interface is easy to use - just type a query like you would in a search engine. While initial setup requires some data modeling, its ability to perform live queries makes it a great fit for fintech teams monitoring transaction volumes or fraud patterns.
Tableau shines in creating visually compelling dashboards. Its Pulse feature focuses on predefined metrics, which is particularly useful for e-commerce teams tracking conversion rates or inventory levels. Tableau’s reputation for top-notch visualization makes it a go-to for teams prioritizing data storytelling.
How to Choose the Right Platform
When deciding, start by assessing your current data environment. If your organization already uses Microsoft 365, Power BI is a natural fit. Teams embedded in the Salesforce ecosystem might find Tableau more advantageous. For those relying on warehouse-native data analysis tools for Snowflake or BigQuery, ThoughtSpot offers a live query approach that could be invaluable.
Team size and technical expertise are also critical factors. ThoughtSpot’s search-first design requires minimal training, making it ideal for non-technical users who need quick insights. On the other hand, Power BI often requires intermediate knowledge of DAX for custom measures, while Tableau generally demands a higher learning curve to master dashboard creation.
With Gartner predicting that 25% of organizations will use chatbots as a primary service channel by 2027 [1], choosing one of the best conversational AI analytics tools could prepare your team for the rise of conversational analytics.
Conclusion
When selecting a platform, it’s essential to match it with your organization’s specific needs and priorities. ThoughtSpot stands out with its AI-native business intelligence tools with a search-first approach via Spotter, making it a great choice for teams that value quick, live data access with minimal reliance on analysts. Power BI offers excellent integration with Microsoft 365, but the shift from Q&A to Copilot by December 2026 [3] will require strategic planning. On the other hand, Tableau shines in creating advanced visualizations with its Pulse feature, though it comes with a steeper learning curve.
Industry experts emphasize the importance of aligning platform choice with organizational goals. Huzaifa Imtiaz from AlphaBold puts it succinctly:
"The decision is less about features and more about whether your organization prioritizes rapid ad-hoc discovery or structured, scalable reporting" [2].
Ease of use for non-technical users and cost efficiency are key factors in evaluating these platforms. ThoughtSpot’s search-based interface is intuitive and requires little training, Power BI involves moderate knowledge of DAX, and Tableau demands more extensive training. Pricing also varies: ThoughtSpot offers flexible options such as $0.10 per query or $25 per user per month [15].
Ultimately, the best choice depends on your team’s technical expertise, infrastructure, and priorities - whether those are real-time analysis, seamless ecosystem integration, or cutting-edge visualizations.
FAQs
How do ThoughtSpot, Power BI, and Tableau compare in using natural language queries for business intelligence?
The differences between ThoughtSpot, Power BI, and Tableau in handling natural language queries center on their AI features, user experience, and how they process user questions.
ThoughtSpot stands out with its search-driven, AI-powered approach. Users can type plain English questions, much like using a search engine, and get instant, actionable insights. This makes exploring data feel intuitive and straightforward.
Power BI offers its Q&A feature, which allows users to ask questions in natural language and receive visual answers. Its seamless integration with the Microsoft ecosystem makes it especially user-friendly for those already familiar with Microsoft tools.
Tableau, on the other hand, emphasizes advanced data visualizations. While it includes natural language capabilities, these features are designed to complement its strength in creating visually compelling dashboards and data storytelling.
Each platform targets specific needs: ThoughtSpot shines in natural language understanding, Power BI thrives in its Microsoft integration, and Tableau is ideal for users who prioritize rich, visualization-driven insights.
How does ThoughtSpot's pricing compare to Power BI and Tableau?
ThoughtSpot’s pricing model in 2026 is primarily built around consumption, meaning the cost is tied directly to how much the platform is used. For large enterprises, this can result in annual costs climbing to $137,000 or more. While this usage-based structure offers flexibility, it can make financial planning a bit trickier due to fluctuating expenses.
On the other hand, Power BI takes a simpler route with a per-user subscription model starting at $10 per user per month. This makes it easier for businesses to predict expenses. Tableau’s pricing begins at $70 per user per month, with additional enterprise pricing available upon request. For larger teams, this can represent a more substantial investment.
In essence, ThoughtSpot is ideal for enterprises with extensive data needs, while Power BI and Tableau provide more predictable pricing that might be a better fit for smaller or mid-sized organizations.
What is the best business intelligence tool for non-technical teams needing quick, real-time insights?
For teams without a technical background looking for quick, real-time insights, Querio is the go-to tool in 2026. Built with simplicity at its core, Querio allows users to ask questions in plain English and get instant, easy-to-understand visual answers. This means anyone - no matter their technical skills - can tap into data and make informed decisions.
Unlike tools like Power BI and Tableau, which often require more advanced technical knowledge to fully utilize, or ThoughtSpot, which may come with added costs or complexity, Querio stands out for its straightforward, user-friendly approach. Its real-time natural language querying ensures that data is always within reach, making it perfect for teams that value speed, simplicity, and efficiency.
Related Blog Posts