Business Intelligence
Metabase vs Tableau: Which BI Tool to Use?
Compare Metabase and Tableau by ease of use, visuals, integrations, and cost to pick the right BI tool for your team's size, skills, and budget.
When deciding between Metabase and Tableau, the right choice largely depends on your team's size, technical skills, and budget:
Metabase: Best for startups and small-to-medium-sized businesses (SMBs) needing simple, quick-to-deploy dashboards. It’s free and open-source or affordable with paid plans starting at $85/month for five users. It’s easy to set up and use, even for non-technical users. However, it offers limited customization and advanced analytics features.
Tableau: Designed for enterprises with complex data needs and dedicated analytics teams. It excels in advanced visualizations, data blending, and integration with tools like R and Python. Pricing starts at $75/user/month, making it a more expensive option with a steeper learning curve.
Quick Comparison
Feature | Metabase | Tableau |
|---|---|---|
Primary Strength | Simplicity, quick setup | Advanced analytics, visualizations |
Learning Curve | Short (hours to days) | Steep (weeks to months) |
Pricing (Entry) | Free (open-source) | $75/user/month |
Best For | Startups, SMBs | Large enterprises |
Visualization Options | Basic (15+ chart types) | Extensive (heat maps, Gantt charts, etc.) |
Advanced Features | Limited | Robust (supports R, Python) |
Choose Metabase if you need a budget-friendly, simple tool for quick insights. Opt for Tableau if you require powerful analytics and are ready to invest in a premium solution.
Metabase vs Tableau: Complete Feature and Pricing Comparison Chart
Metabase vs Tableau: Which is better for your team
How to Evaluate BI Tools
Selecting the right BI tool involves understanding your team's needs, the type of insights required, and how your data infrastructure is organized. Tools like Metabase and Tableau approach these challenges differently, so defining your evaluation criteria for BI tools is essential.
First, consider your team's technical skills and the complexity of your analytics requirements. A solution that fits a small startup may not scale for a large enterprise, and vice versa. Think about deployment speed, the need for customization, and how well the tool integrates with your existing data sources.
Metabase provides a free open-source version, while Tableau's Creator license costs around $75 per user per month, billed annually. Let's break down where each tool stands out.
Ease of Use and Learning Curve
Ease of use is one of the biggest differences between these tools. Metabase outperformed Tableau in user ratings, scoring 9.1/10 for Ease of Setup compared to Tableau's 8.2/10, and 8.9/10 for Ease of Admin versus Tableau's 8.2/10 [3]. Metabase can be deployed in under five minutes, while Tableau might take hours or even days.
Metabase’s Query Builder allows non-technical users to create visualizations without writing SQL, making it a good fit for teams like marketing, sales, or executives who need quick insights. Tableau, on the other hand, requires more upfront investment in learning. As Mile Živković from Embeddable explains:
"Tableau makes stunning visualizations and is easy to teach the basics... [but] mastering its full capability can take weeks or months" [4].
This distinction is crucial when weighing the need for fast insights versus more advanced analysis. Next, let’s look at how these tools handle data visualization.
Data Visualization and Customization
Tableau stands out for its advanced visualization options, offering features like heat maps, treemaps, bubble charts, histograms, Gantt charts, and more [4]. Its dashboards allow dynamic filtering between charts, custom tooltips with conditional logic, and complex calculated fields using its formula language [4].
In contrast, Metabase focuses on essential chart types - around 18 basic options - and includes simple dashboard filters like dropdowns for dates or categories that apply across visualizations [4]. This straightforward approach works well for standard reporting but lacks the detailed customization and conditional logic that enterprise-level analysts might need. According to G2, Tableau scored 9.1 in Advanced Analytics, compared to Metabase’s 8.6 [3]. These differences make Tableau better for intricate reporting needs, while Metabase is ideal for simpler use cases.
Integration and Data Connectivity
Both platforms connect to major data warehouses and relational databases, but their approaches differ. Tableau offers advanced data blending and modeling features, giving analysts precise control over combining multiple data sources. Metabase, on the other hand, prioritizes ease of setup with a streamlined connection process via its GUI or SQL editor [4].
The user base reflects these differences. 81% of Metabase users are in the micro and SMB segment, while Tableau's audience is more diverse, with 52% in micro/SMB and a stronger presence among enterprises [7]. Your choice should depend on your infrastructure and the technical capabilities of your team - Metabase is better for simpler setups, while Tableau excels in handling complex, multi-source environments. This comparison can help you decide which platform aligns best with your business needs.
Metabase vs Tableau: Side-by-Side Comparison
Looking at these two tools side by side highlights their key differences, particularly in pricing, complexity, and the types of users they cater to, including those seeking self-service analytics and embedded dashboards.
Metabase tends to attract 50.7% of its reviews from mid-market and small businesses, compared to 42.2% of Tableau's reviews coming from enterprise-level organizations [3]. This breakdown aligns with how each platform is structured and priced.
Comparison Table
Here’s a quick summary of how Metabase and Tableau stack up against each other:
Feature | Metabase | Tableau |
|---|---|---|
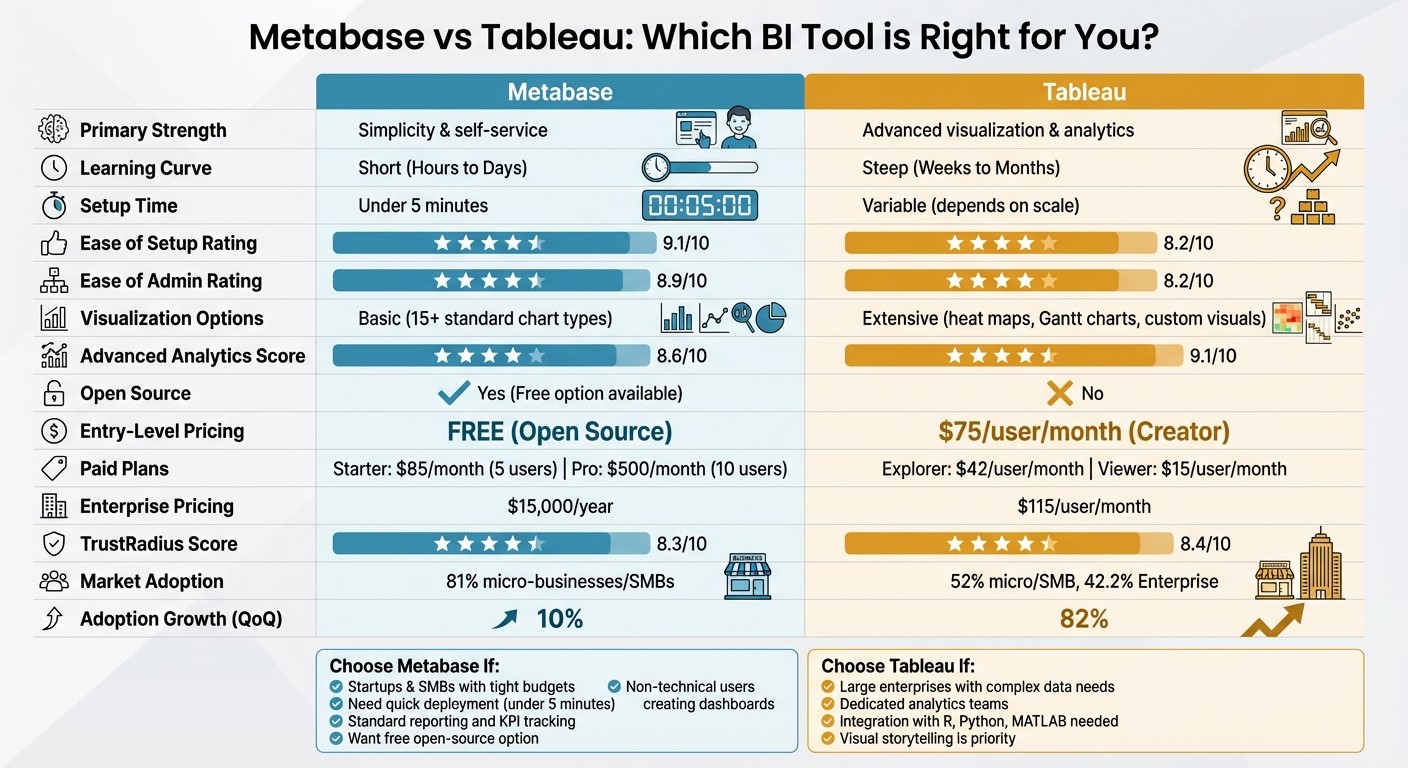
Primary Strength | Simplicity & self-service | Advanced visualization & analytics |
Learning Curve | Short (Hours to Days) | Steep (Weeks to Months) |
Setup Time | Under 5 minutes | Variable (depends on scale) |
Visualization | Basic (15+ standard chart types) [4] | Extensive (custom visuals, large library) [4] |
Advanced Analytics | Limited | Robust (supports R and Python) |
Open Source | Yes (Free option available) | No |
Pricing (Entry) | ||
Pricing (Paid Plans) | Starter: $85/month (5 users); Pro: $500/month (10 users) [6][4] | Explorer: ~$42/user/month; Viewer: ~$15/user/month [4] |
Enterprise Pricing | $15,000/year [6] | $115/user/month [6] |
Deployment | Cloud or Self-hosted | Cloud or Self-hosted |
Best For | Startups & SMBs | Large Enterprises |
Market Adoption | 81% micro-businesses/SMBs [7] | |
Adoption Growth (QoQ) | 10% [7] | 82% [7] |
Metabase stands out with its free open-source version, while Tableau’s entry-level pricing starts at $75 per user per month [6][3]. For a team of 10 users, Metabase’s Pro plan costs $500/month, which is more affordable compared to Tableau’s $750/month for Creator licenses [6][4].
When it comes to adoption growth, Tableau shows impressive momentum with an 82% quarter-over-quarter growth rate, far outpacing Metabase’s 10% [7]. Despite this, their TrustRadius scores are nearly identical, with Metabase at 8.3 out of 10 and Tableau at 8.4 out of 10 [6].
Up next, we’ll explore which scenarios are best suited for each platform.
When to Choose Metabase
Metabase is a great fit for teams working with tight budgets, smaller groups, or those who need a solution they can deploy quickly. If you're part of a startup, a small-to-medium-sized business, or a department within a larger organization, and you need straightforward dashboards without the complexities of enterprise-level tools, Metabase is designed to meet those needs perfectly.
One of its biggest draws is affordability. The free, open-source version is perfect for budget-conscious teams. It allows self-hosting with unlimited charts, dashboards, and connections to over 20 databases - all at no cost [3]. Even its paid plans are reasonably priced, with the Starter plan costing $85 per month for five users and the Pro plan priced at $500 per month for 10 users [6]. For comparison, Tableau’s pricing starts at around $75 per user per month [4].
Metabase also stands out for its ease of setup. With a setup score of 9.1/10 compared to Tableau’s 8.2 [3], it’s accessible even for non-technical users like product managers, marketers, and operations staff. These users can independently create dashboards without needing help from specialized BI teams [4][5].
This tool is particularly suited for tracking internal KPIs and handling standard reporting needs. Its clean, web-based interface is intentionally simple, focusing on delivering essential insights without unnecessary complexity. Additionally, for organizations with strict data privacy requirements, Metabase’s self-hosted option ensures all data stays within your own infrastructure [2].
Metabase shines when speed and simplicity are top priorities. It’s ideal for teams looking for direct answers to business questions without diving into advanced statistical modeling or creating custom visualizations. For those seeking to quickly address core business insights, Metabase offers the perfect balance of functionality and ease of use.
When to Choose Tableau
Tableau is a go-to solution for large enterprises that need robust analytics and have the resources to support it. Nearly half of Tableau's user base consists of large enterprises, with industries like financial services (14%), communications service providers (15%), and manufacturing (10%) relying on it for their intricate reporting needs [3][8].
What sets Tableau apart is its advanced visualization ideas. It offers a variety of specialized formats, such as heat maps, Gantt charts, treemaps, and even 3D charting. Plus, it integrates seamlessly with tools like R, Python, and MATLAB, making it a powerful option for predictive analytics and geospatial analysis [4][1]. Nikolay Valiotti, Founder of Valiotti Analytics, captures its essence perfectly:
"Tableau has long been the gold standard for visual storytelling with data" [5].
This versatility allows Tableau to handle complex analytical tasks that go beyond surface-level insights. However, these advanced features come with a price tag. Creator licenses start at $75 per user per month, while Explorer licenses range from $35 to $42, and Viewer licenses cost between $12 and $15. For larger organizations, core-based licensing can run into tens of thousands of dollars annually [3][4]. While its drag-and-drop interface simplifies basic chart creation, mastering its more advanced features - like calculated fields and intricate dashboards - requires significant time and training [4].
Tableau shines in scenarios where visual storytelling and analytical depth are non-negotiable. Whether you're blending Big Data, cloud services, or spreadsheets, Tableau handles it with ease [6]. It has earned recognition from Gartner and maintains strong reviews, with 4.4/5 stars on both G2 and Gartner Peer Insights [2][3].
This platform is best suited for organizations that prioritize analytical sophistication over ease of use, have dedicated BI teams or data analysts, and need enterprise-grade governance implementation and security. If your data challenges demand this level of complexity and you're prepared for the investment, Tableau is a strong choice.
Conclusion: Choosing the Right BI Tool
After weighing the options, it’s time to decide which BI tool aligns with your business needs.
Your choice will depend on factors like team size, technical expertise, and budget. Metabase is a solid pick for startups and small businesses looking for quick setup and minimal training. With 35.8% of its reviewers coming from companies with 50 or fewer employees [3], its free Open Source version and paid plans starting at $85/month make it an affordable option for cost-conscious organizations [1].
On the other hand, Tableau caters to enterprises handling complex data requirements. It offers advanced capabilities, but at a higher cost ($75 per user/month) and with a steeper learning curve [3][4].
Metabase is a great choice if you’re a small or medium-sized business with a tight budget, want to empower non-technical staff to create dashboards without coding without needing SQL, and need a tool that’s ready to go in minutes. Its ratings - 9.1/10 for "Ease of Setup" and 8.9/10 for "Ease of Admin" - highlight its user-friendly approach for teams with limited IT resources [3].
Tableau is ideal if you’re part of a larger organization dealing with complex datasets, have a dedicated data team for advanced analytics, and need powerful visualizations like heat maps and Gantt charts. Its 82% user recommendation rate on Gartner Peer Insights reflects the value it brings to businesses that can invest in its advanced features [2].
Ultimately, the right tool will depend on your priorities - whether that’s ease of use, visualization capabilities, or integration options. Both Metabase and Tableau shine in different situations, so pick the one that best matches your team’s resources and goals.
FAQs
Which tool is better for non-technical teams?
Metabase shines when it comes to non-technical teams, thanks to its straightforward design and intuitive interface. It allows users to explore data and build dashboards quickly, often requiring little to no training. On the other hand, Tableau, while packed with advanced features suited for enterprise-level tasks, can feel overwhelming for teams that just need simple, clear reporting. For those who lack technical expertise, Metabase stands out as a more approachable and easy-to-use option.
How do Metabase and Tableau compare for multi-source reporting?
Metabase makes multi-source reporting straightforward by letting users connect and query multiple databases within a single platform. This simplicity allows for easy dashboard creation. However, its visualization options and advanced integration capabilities fall short compared to some other tools. Tableau, on the other hand, shines when it comes to advanced visualizations and powerful data blending, making it a strong choice for handling complex multi-source reporting in enterprise environments. While Metabase prioritizes user convenience, Tableau caters to those seeking more in-depth analytics and sophisticated features.
What’s the real total cost for a small team vs an enterprise?
The cost of using Metabase can vary significantly depending on the size of your team and your specific needs. For smaller teams, the free open-source version is an attractive option. It keeps initial expenses low, with costs primarily tied to hosting and maintenance.
On the other hand, enterprises typically face much higher expenses. These include licensing fees, access to advanced features, and dedicated support. Annual costs for larger organizations can easily run into the thousands of dollars. The final price tag often depends on factors like the number of users, the variety of data sources, and the complexity of the deployment.
Related Blog Posts


