Business Intelligence
Ultimate Guide to Predictive Analytics in BI
Learn how predictive analytics transforms BI with techniques, implementation steps, tools, and best practices for forecasting churn, demand, and fraud.
Predictive analytics transforms business intelligence (BI) by moving from analyzing past events to forecasting future outcomes. It uses historical data, statistical models, and machine learning to predict trends, risks, and behaviors. This shift allows businesses to anticipate challenges and opportunities, improving decision-making and efficiency.
Key takeaways:
Predictive analytics answers "What’s next?" instead of just "What happened?"
Tools like Querio simplify predictions by using plain English queries to generate actionable insights.
Techniques include regression, classification, clustering, and advanced machine learning like neural networks.
Applications span customer churn prediction, demand forecasting, and fraud detection.
Success depends on clear goals, clean data, and continuous model refinement.
Predictive analytics is reshaping BI by embedding forecasts into workflows, enabling smarter, faster decisions.
What is Predictive Analytics? | Data Analytics | Community Webinar
How Predictive Analytics Changes BI
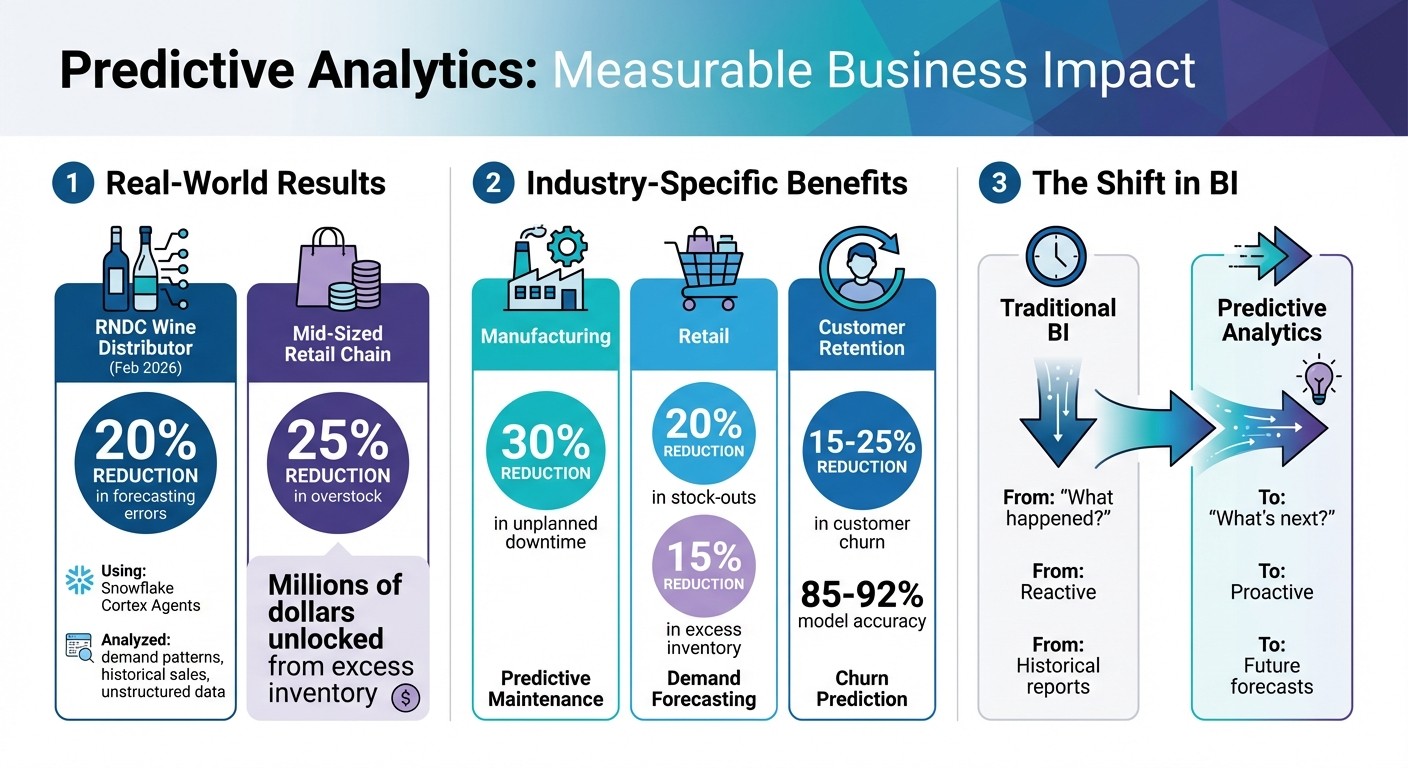
Predictive Analytics Impact: Key Statistics and Benefits Across Industries
From Past Reports to Future Predictions
Traditional business intelligence (BI) has always been about looking back - analyzing historical data to answer questions like "What happened?" Dashboards and reports provided insights into past events to help explain the present. But this approach stops short of answering the critical question: What’s next?
Predictive analytics takes BI to the next level. As Google Cloud explains:
"Predictive analytics is the process of using data to forecast future outcomes" [3].
By leveraging historical data, predictive models generate forecasts, calculate risk scores, and estimate probabilities. This allows businesses to shift from reacting to past events to proactively planning for the future. It’s a game-changer, giving companies the ability to spot trends and act before competitors even see them [3].
The way data is handled has also evolved. Traditional BI tools worked with smaller, structured datasets, often requiring manual curation. In contrast, modern predictive systems handle massive amounts of unstructured data - like text, images, or real-time streams from social media or IoT sensors. These systems use advanced techniques like deep learning to automate feature extraction, making it possible to process terabytes of complex data efficiently [6]. Where older methods relied on simple statistical approaches like linear regression, today’s predictive models are far more sophisticated, enabling deeper insights.
This shift doesn’t just improve forecasting - it also delivers practical benefits for data teams.
Benefits for Data Teams
The impact of predictive analytics on real-world operations is striking. For example, in February 2026, the wine distributor RNDC reported cutting forecasting errors by 20% after using Snowflake Cortex Agents. These tools analyzed demand patterns, historical sales, and even unstructured data like sales rep notes [7]. Similarly, a mid-sized retail chain used predictive technology to optimize inventory during peak seasons, reducing overstock by 25% and unlocking millions of dollars previously tied up in excess inventory [7].
Beyond improving forecasts, predictive analytics drives operational efficiency. In manufacturing, predictive maintenance models can slash unplanned downtime by 30% [3]. In retail, demand forecasting reduces stock-outs by 20% and trims excess inventory by 15% [3]. These improvements translate into measurable savings and lower risks. As Kleene.ai puts it:
"The insight is there [in BI], but the action is still on you. Predictive analytics flips that model" [4].
Instead of simply presenting data for review, predictive models go a step further by recommending specific actions - or even automating them through controlled workflows.
Next, we’ll dive into the techniques powering these predictive models.
Common Techniques in Predictive Analytics
Predictive analytics relies on a mix of regression, classification, clustering, and machine learning to predict outcomes based on historical data. These techniques form the backbone of predictive models, which are essential for advancing business intelligence strategies.
Regression models focus on predicting numerical outcomes, such as estimating sales growth or customer lifetime value, by analyzing the relationships between key variables [2][13][14]. For instance, using past sales data, a regression model can forecast next quarter's revenue by considering factors like marketing budgets, seasonal trends, and economic conditions [8][11].
Classification models are designed to categorize data into distinct groups by identifying patterns in historical data. These models answer questions like "Will this customer leave?" or "Is this transaction fraudulent?" [9][10][13]. By evaluating variables, classification models split data into subsets, creating clear categories. For example, a credit card company might use classification to label transactions as either "legitimate" or "suspicious", enabling real-time fraud prevention [10].
Clustering and segmentation focus on grouping unlabeled data based on shared characteristics [9][12]. Unlike classification, clustering doesn't rely on predefined categories but instead uncovers patterns independently. This method is ideal for customer segmentation, where businesses identify similar customer groups for targeted marketing, or for detecting anomalies, such as unusual patterns that may signal issues [9][10][14].
Machine learning takes these methods further, offering deeper insights through advanced algorithms. For example, decision trees use a branching structure to explore possible outcomes, starting with a "root node" and splitting data based on specific questions [5][11]. Random forests enhance decision trees by combining multiple trees through a process called "bagging" (bootstrap aggregating), creating a stronger predictive model from several weaker ones [10][13]. Meanwhile, neural networks, inspired by the human brain, excel at identifying complex, non-linear patterns. These are particularly effective for tasks like speech recognition, image classification, and market forecasting [5][11]. Across industries, these machine learning techniques have significantly improved forecasting accuracy and operational efficiency.
How to Implement Predictive Analytics in BI
As business intelligence (BI) shifts from analyzing the past to predicting the future, implementation becomes a crucial step. Turning concepts into practical applications requires a clear plan. Since data preparation and ongoing management are the most time-intensive parts of a predictive analytics project, careful planning can save both time and resources [15]. A structured approach ensures predictive models lead to actionable insights for your business.
Defining Business Questions
Start by pinpointing 2–3 high-priority use cases that align with your business objectives. Instead of trying to predict everything, focus on specific, impactful outcomes - like lead scoring, churn prediction, or demand forecasting. Define success metrics from the outset, such as "cutting stock-out costs by 15%" [18][3]. Having clear goals keeps the project manageable and ensures measurable results. The secret lies in asking the right questions rather than building overly complex models.
Data Preparation and Model Training
This phase is all about making your data usable. It starts with cleaning - removing duplicates, fixing errors, and transforming data into formats suitable for analysis [16][3]. Feature engineering is key here, where you identify the variables that most influence your desired outcomes [16][17].
Next, split your data into training, validation, and testing sets. For time-series data, use chronological splits instead of random ones to maintain realistic results [3][19]. Always compare your model's performance to a simple "naive" baseline, such as last period's value, to gauge its effectiveness [3]. Once your model is trained, keep monitoring and fine-tuning it to maintain accuracy over time.
Monitoring and Refining Predictions
When your model is ready, integrate its predictions into your BI dashboards, alert systems, or decision-making workflows [3]. Regularly check for concept drift, which happens when historical patterns no longer apply due to changing business conditions. Retrain your models as needed to keep them relevant [3].
Track both statistical performance metrics, like Mean Absolute Error (MAE) and Root Mean Square Error (RMSE), and business impact metrics, such as improved conversion rates or lower customer acquisition costs [20][18][16]. Using modern analytics stacks with automated ELT pipelines to feed fresh, high-quality data into your models ensures they stay accurate over time [19]. Companies that consistently monitor and refine their models often see significant gains in forecasting accuracy. This ongoing process ensures predictive analytics continues to deliver a competitive edge.
Tools for Predictive Analytics in BI
Selecting the right tool for predictive analytics can make all the difference when it comes to turning forecasts into actionable insights. Whether you're working with code-heavy libraries or user-friendly platforms, your choice will depend on your team's expertise and the speed at which you need results.
Querio: AI-Powered Predictive Analytics
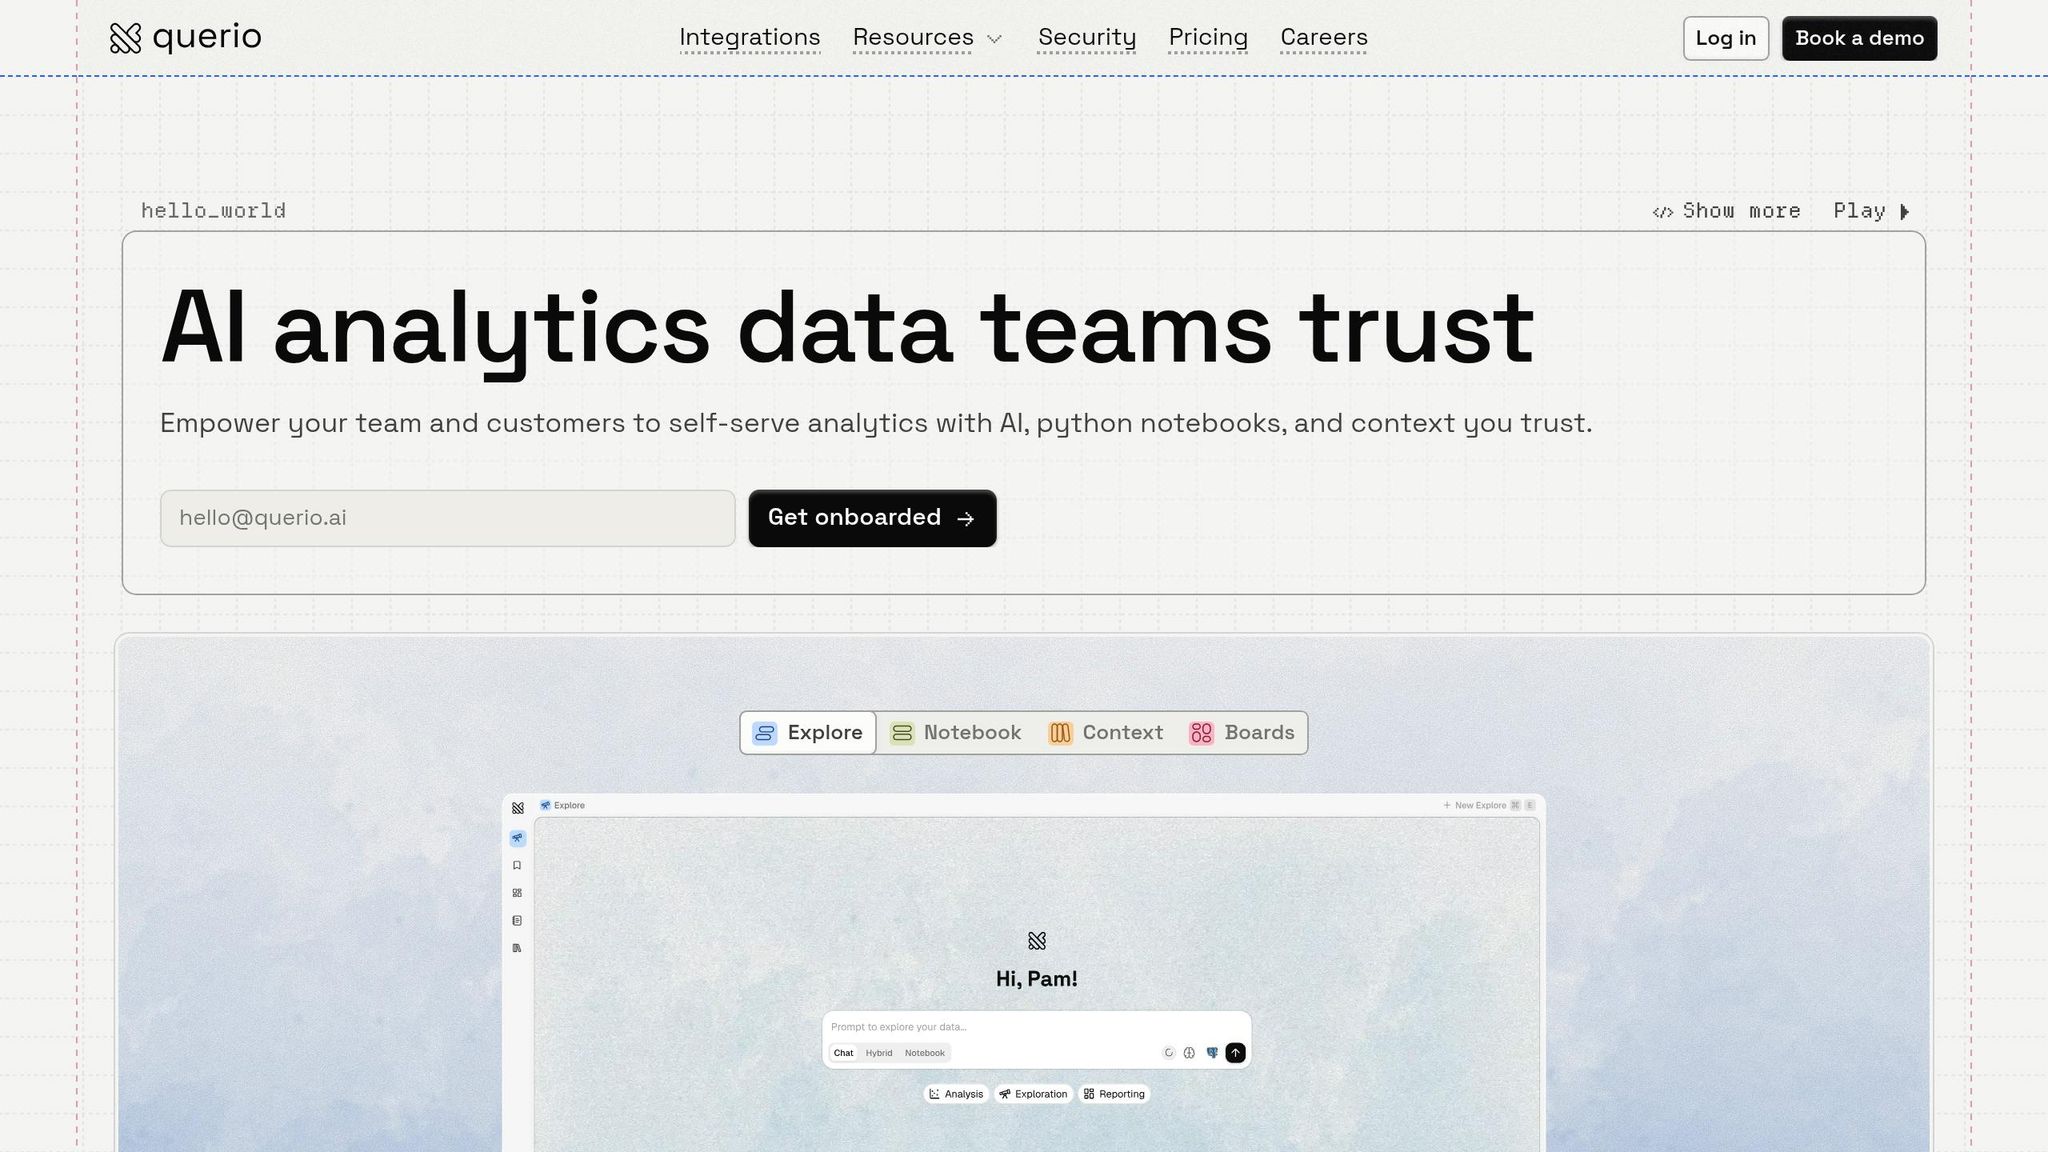
Querio offers a fresh take on predictive analytics by allowing teams to ask questions in plain English and automatically generating the SQL and Python code required for analysis. Instead of manually coding models, you can simply ask something like, "Forecast demand using past sales", and instantly get reusable SQL and Python code. This code connects directly to your data warehouse - whether it’s Snowflake, BigQuery, or Postgres - making the process seamless [1].
A standout feature of Querio is its shared context layer. This allows data teams to define metrics, joins, and business terms once, ensuring consistency across forecasts and dashboards. Plus, its built-in notebook environment supports testing, tweaking variables, and deploying models without needing to switch tools.
Unlike some black-box AI solutions, Querio emphasizes transparency. Every prediction is backed by inspectable SQL or Python code, giving teams full control to modify and refine it. This level of transparency is invaluable when making critical decisions about inventory, pricing, or customer retention. Additionally, Querio’s live, read-only connections to your warehouse eliminate risks like data duplication or compromising sensitive information.
While Querio simplifies predictive analytics with its intuitive and transparent design, other tools in the ecosystem take different approaches.
Other Common Tools
Python libraries like Scikit-learn are popular for building custom models for tasks like regression, classification, and clustering. However, these require significant manual coding, which can slow down the process of finding data analytics insights. Cloud platforms such as BigQuery ML allow model training directly on warehouse data using SQL, making them ideal for teams skilled in writing complex queries. That said, they lack the plain-English interface and shared context layer that Querio provides, which makes it easier for teams to quickly generate, inspect, and refine their code.
Best Practices for Implementation
Ensuring Data Quality and Governance
Accurate predictions start with clean, reliable data. Issues like duplicate entries, missing values, or inconsistent field definitions can derail forecasts. The smartest way to tackle this is by automating data hygiene. Shared pipelines that flag missing patterns or outliers daily can help keep your KPIs accurate and dependable[18].
Equally important is having strong governance layers in place. When different teams run their own predictive models, inconsistencies often creep in. For example, the definition of terms like "active customer" or "monthly revenue" might vary across teams. A shared context layer - such as Querio's - solves this by standardizing joins, metrics, and business terms. This ensures everyone is working with the same definitions, building trust in dashboards and reports.
Transparency also plays a big role. Unlike closed proprietary systems, platforms like Querio generate clear SQL and Python code that can be inspected and audited. This openness reduces risk and gives teams full control over refining their models.
To maintain analytical accuracy, it's not just about clean data - it’s also about balancing automation with human oversight.
Balancing Automation with Manual Oversight
Automation can speed up analysis, but it’s no substitute for human expertise. Domain experts are essential for catching nuances like seasonal trends or sudden market shifts that AI might miss.
One effective approach is to set up drift and anomaly monitoring dashboards. These tools compare model outputs to actual outcomes. For example, if a churn model suddenly flags 40% of customers as high-risk when the historical average is only 15%, that’s a red flag requiring immediate attention. Since models naturally degrade as consumer behavior evolves, retraining them quarterly - and updating more frequently for fast-changing data - is a smart move[21].
The goal is to strike the right balance: let automation handle repetitive tasks like data prep and feature creation, while experts step in to validate assumptions, fine-tune parameters, and interpret results in light of your business objectives.
Use Cases for Predictive Analytics in BI
Customer Churn Prediction
Predictive analytics enables SaaS and e-commerce businesses to spot customers who might leave - often 30 to 90 days before they churn. By analyzing behavioral patterns like reduced login frequency, unresolved support tickets, or a sudden decline in feature usage, companies can take preemptive action. AI-driven churn models, when built using engineered behavioral features instead of raw data, can achieve accuracy rates of 85% to 92% [24].
Key metrics to monitor include rate changes, such as a 40% drop in logins over a month, which often signal major behavioral shifts [24]. Segmenting at-risk customers into tiers - such as Critical (80–100% risk) and High (60–80% risk) - helps customer success teams focus on high-value accounts with personalized outreach. Meanwhile, automated workflows can handle lower-risk cases. Businesses adopting such strategies typically reduce churn by 15% to 25% [24].
Next, let’s see how predictive analytics enhances demand forecasting, another essential business function.
Demand Forecasting
Accurate demand forecasting helps companies avoid stock-outs and overstock issues. A great example is Siemens, which revamped its global forecasting in early 2026 by rolling out Outreach to over 4,000 sellers across 190 countries. This initiative streamlined opportunity management and pushed forecast submission rates above 70% [23].
"With Outreach we get increased transparency. Now we are getting much easier, deeper insights into the structure in a way we've never had before." - Thorsten Reichenberger, Head of Revenue Operations, Siemens [23]
To improve forecasting, establish a feedback loop that compares predictions with actual outcomes. Using SQL-forward data analysis tools can help teams model these outcomes and visualize discrepancies in real time. Regularly retrain models to adjust for concept drift as market conditions shift [22][3][7]. Start with clear, measurable goals - like reducing stock-out costs by 15% or optimizing inventory for a specific region - rather than vague objectives [3].
Fraud Detection
Predictive analytics also plays a vital role in combating fraud. Fintech and e-commerce platforms rely on it to detect fraudulent activities in real time, minimizing potential damage. By analyzing transaction patterns, identifying anomalies in user behavior, and leveraging historical fraud data, these systems can flag suspicious activity instantly. This marks a shift in BI from reactive to proactive decision-making, often powered by an AI BI engine that simplifies data access.
Fraud detection systems often embed prediction scores directly into operational workflows, triggering automated alerts when risk thresholds are crossed. This allows security teams to block fraudulent transactions swiftly while minimizing inconvenience for legitimate users. The challenge lies in balancing speed and accuracy - stopping fraud quickly without causing unnecessary friction for genuine customers.
Conclusion
Predictive analytics shifts business intelligence (BI) from simply looking at past events to actively shaping future decisions. Instead of just analyzing what happened, teams can now forecast potential issues like customer churn, fine-tune inventory management, and spot fraud before it escalates. This move from reactive reporting to forward-looking predictions marks a major evolution in how organizations use data.
For predictive analytics to deliver real value, three core elements are essential: clear objectives, reliable data, and continuous model improvement. Start with well-defined, measurable goals - whether it's cutting customer churn rates or avoiding inventory shortages. Establish feedback loops to compare predictions with actual outcomes, and regularly update models to reflect changing market dynamics.
However, challenges around governance and trust can't be ignored. Automated decisions - like flagging fraudulent transactions or launching a customer retention campaign - require transparency. If teams can’t understand how predictions are made, confidence in these systems erodes.
As discussed earlier, Querio addresses these hurdles by providing inspectable SQL and Python for every predictive query. Teams can ask questions in plain English, receive live predictions they can review, and audit the generated code. Querio’s shared context layer ensures consistent metrics, joins, and business definitions across dashboards and analytics, keeping predictions accurate and well-governed as they scale.
Whether it’s forecasting demand, reducing churn, or preventing fraud, the ultimate aim is to turn data into actionable insights using AI. Predictive analytics isn’t just about building models - it’s about embedding these predictions into everyday workflows to drive meaningful results and long-term growth.
FAQs
What data do I need to start predictive analytics in BI?
To kick off predictive analytics in Business Intelligence (BI), start with reliable historical data that highlights patterns and trends. This could include metrics like sales figures, customer behavior, or operational performance. The data should be clean, well-organized, and housed in a centralized location, such as a data warehouse. Tools like Querio make it easy to connect directly to your data warehouse, allowing you to build models and run analyses using SQL and Python.
How can I tell if my predictive model is reliable?
To gauge how reliable your predictive model is, test its performance using a separate dataset that wasn’t part of the training process. This step helps confirm whether the model can handle new, unseen data effectively. Keep checking how its predictions stack up against actual outcomes and periodically refresh the model with updated data to maintain relevance.
Use evaluation metrics like precision, recall, or the F1 score to measure its accuracy. But don't stop there - pay close attention to the quality of your data and the specific business context. These factors are critical for delivering results you can trust.
How can I embed predictions into dashboards and workflows in Querio?
To add predictions in Querio, leverage its AI-driven embedded analytics to seamlessly incorporate real-time insights into dashboards or workflows. By connecting Querio to your live data warehouse, you can set up predictive models and embed them into platforms like CRMs or project management tools. This integration allows users to view up-to-date forecasts and actionable insights directly within their workflows, making it easier to make quick, informed decisions without switching between tools.
Related Blog Posts


