Business Intelligence
How AI Enhances Data Visualization and Dashboards
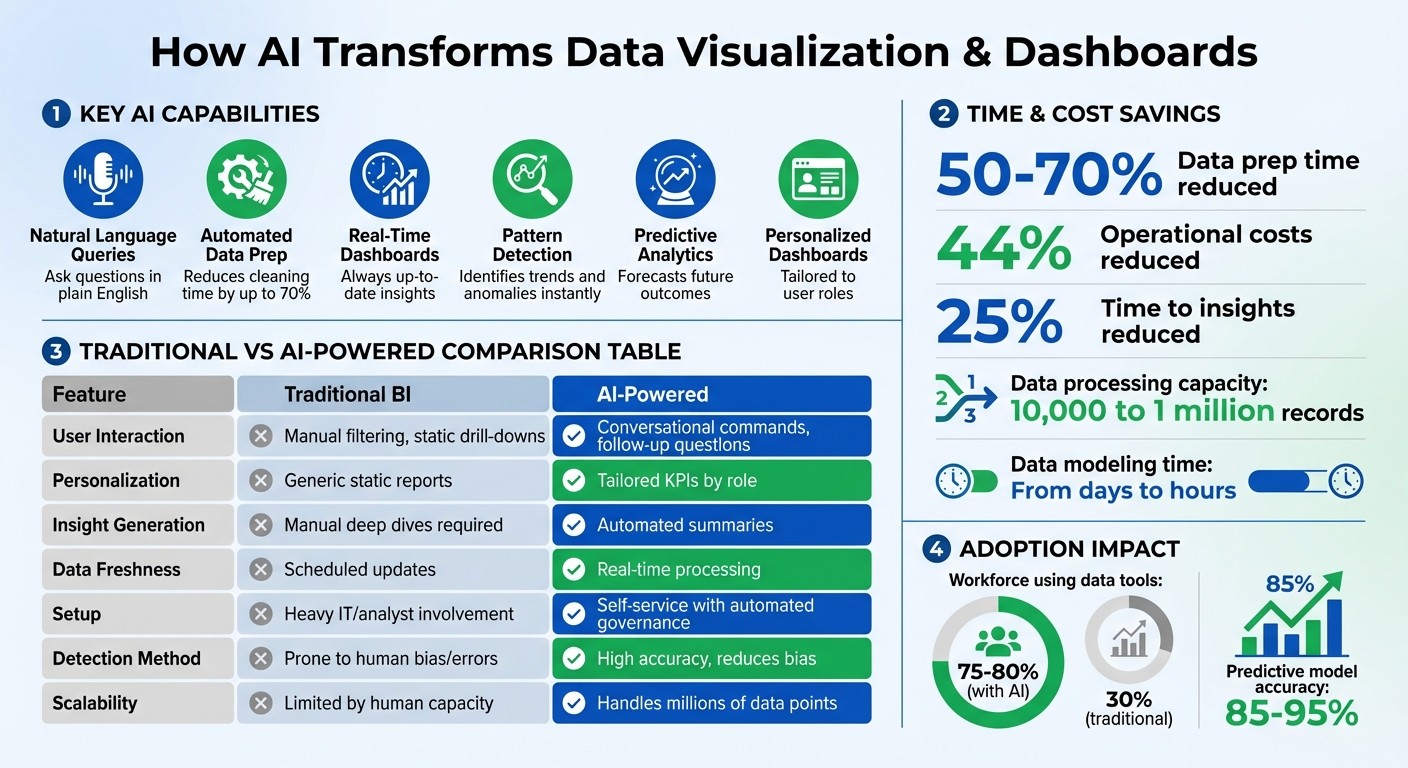
How AI automates data prep, powers natural-language queries, real-time dashboards, anomaly detection, forecasting, and personalized, governed analytics.
AI is transforming data visualization by automating manual tasks, enabling real-time insights, and making analytics accessible to everyone. Instead of spending hours preparing data or updating reports, AI tools now handle these processes, letting teams focus on decision-making. Here’s how AI is changing the game:
Natural language data querying tools: Ask questions in plain English and get instant, accurate visualizations - no technical skills needed.
Automated Data Prep: AI reduces data cleaning time by up to 70%, speeding up workflows and minimizing errors.
Real-Time Dashboards: AI-powered systems connect to live data streams, ensuring your insights are always up-to-date.
Pattern Detection: AI identifies trends and anomalies in real time, helping businesses act quickly on insights.
Predictive Analytics: AI forecasts future outcomes, aiding in proactive decision-making.
Personalized Dashboards: Tailored insights based on user roles and preferences make data tools easier to use.
AI-powered tools like Querio integrate seamlessly with data warehouses, generating reliable insights while maintaining security and consistency. With features like natural language processing, anomaly detection, and predictive modeling, AI is turning static dashboards into dynamic, decision-driving tools.
Traditional vs AI-Powered Dashboards: Key Differences and Benefits
Create Dashboards in Seconds With AI (It's Mind-Blowing 🤩)
AI Automation in Data Preparation and Cleaning
Data preparation has long been a bottleneck in analytics. Analysts spend countless hours cleaning datasets, fixing inconsistencies, and building transformation pipelines. Now, AI is stepping in to take over these tasks - handling everything from filling in missing values to generating complex SQL transformations. This shift allows teams to spend less time on tedious prep work and more time uncovering business insights.
Streamlining Data Workflows with AI
AI assistants, like Gemini in BigQuery, are changing the game by automating routine data tasks. These tools can analyze datasets and suggest tailored transformations, such as typecasting, string manipulation (using functions like CONCAT and REPLACE), datetime parsing, and deduplication. All analysts need to do is describe their goal in plain English, and the AI generates the necessary code on the spot.
AI-powered tools can process anywhere from 10,000 to 1 million records [4], cutting the time needed for data modeling from days to just hours [3][4]. Beyond speeding up workflows, these systems handle complex cleaning tasks that previously required significant manual effort. For example, AI can automatically deduplicate records based on specific keys, filter rows using natural language conditions, and redirect rows that fail validation rules to error tables. This ensures that flawed data doesn’t make its way into dashboards [4][5].
For teams managing data across platforms like Snowflake and BigQuery, this level of automation translates to fewer errors and faster insights - a win-win for businesses aiming to make data-driven decisions.
Maintaining Data Consistency and Accuracy
While automation can save time, it’s only as good as the accuracy of its results. That’s where tools like Querio’s semantic layer come in. This layer bridges the gap between raw data and business logic, storing metrics, dimensions, and relationships in a consistent format across dashboards [3][6]. Updates made at the semantic layer level sync instantly across tools, ensuring uniformity [3].
"Semantic layers serve as the bridge between raw data and meaningful insights, helping ensure that both AI and BI systems interpret information consistently and accurately." – Snowflake Engineering Blog [3]
One of the biggest challenges in traditional business intelligence is conflicting definitions. For instance, different teams might calculate "Total Revenue" or "Active Customers" in entirely different ways, leading to mistrust in analytics. By embedding organizational context directly into the data layer, Querio ensures everyone - from analysts to executives - sees the same numbers, calculated the same way, every time [3]. This consistency builds trust and makes AI-powered analytics a dependable tool for decision-making.
Dynamic Visualization with Natural Language Processing
Natural language processing (NLP) is reshaping how we interact with data, turning complex datasets into visuals in real time. By eliminating technical hurdles, NLP enables business users to explore data simply by asking questions in plain English. No more waiting for manual report updates - teams can now access instant visual insights, speeding up decision-making.
From Questions to Visuals: AI in Action
Querio's AI agents make this magic happen by converting conversational questions into executable SQL or Python code. For instance, a sales manager might type, "show me revenue by region for Q4", and instantly see a bar chart. Users can refine these queries with follow-ups like "filter by the Northeast region" or "switch to a line graph", creating an ongoing, interactive data exploration experience [7][9][10].
The system doesn’t stop at visuals - it handles on-the-fly calculations too. Whether it's year-over-year growth, custom ratios, or segment comparisons, the AI performs the computations instantly. Every response includes the logic behind it, building user trust and confidence in the results [9].
This smooth transition from query to visualization opens up data exploration to users beyond technical teams.
Making Analytics Accessible for Non-Technical Users
NLP-powered dashboards are breaking down barriers to analytics, with companies reporting that 75%–80% of their workforce now actively uses data for insights [13].
To make the most of these tools, it’s crucial to optimize how data is structured. Use unique, descriptive column names that align with your business terminology [9]. Mapping synonyms (like linking "revenue" to "top line") improves the AI's ability to interpret queries [9]. Additionally, features like "clear chat" help reset the system when switching topics, avoiding confusion from prior interactions [8]. These small adjustments ensure self-service analytics remain both accessible and reliable.
AI for Pattern Recognition and Anomaly Detection
AI algorithms are transforming how we monitor and interpret data by scanning dashboards for trends, correlations, and anomalies that manual reviews often miss. Instead of relying on periodic reports or manual checks, AI offers real-time monitoring, flagging unusual activity the moment it happens. This allows teams to act on opportunities or address issues within hours, not weeks. It’s a significant step forward, expanding AI’s role from simply preparing data to actively analyzing it with modern BI features.
How AI Detects Patterns in Real Time
AI processes thousands of data points simultaneously, uncovering complex relationships across multiple dimensions. For instance, if revenue in a specific region drops unexpectedly or customer churn spikes, allowing you to analyze what drove churn without manual SQL queries, AI can immediately detect these deviations from historical norms and highlight them on your dashboard. This constant analysis ensures even the smallest shifts are caught - shifts that might otherwise go unnoticed.
Improving Accuracy with Governed AI Detection
After identifying patterns in real time, AI refines its insights using governed detection methods. Querio’s anomaly detection system emphasizes transparency and accountability. Every anomaly flagged by the system includes a versioned explanation, helping data teams understand its significance. These teams can then review, adjust, or update detection rules to ensure alerts address real business concerns rather than random statistical noise. This governance approach minimizes false positives and ensures flagged issues are worth investigating. Predictive maintenance models using similar methods typically achieve an accuracy rate of 85–95% for failure predictions [15].
Comparison Table: Manual Detection vs. AI-Powered Detection
Feature | Manual Detection Methods | AI-Powered Detection |
|---|---|---|
Accuracy | Prone to human bias and manual errors [14] | High accuracy; reduces analytical bias [14] |
Scalability | Limited by human capacity; struggles with large datasets [14] | Handles millions of data points seamlessly [15] |
The move from manual to AI-powered detection isn’t just about speed - it’s about uncovering patterns and anomalies that would otherwise remain hidden in complex, high-volume datasets. With hundreds of metrics spread across various business units, AI ensures a level of awareness that manual methods simply can’t match, all while keeping your team from being overwhelmed.
Predictive Analytics and Forecasting Dashboards
Predictive analytics turns dashboards into tools for making proactive decisions. Instead of solely relying on historical data to spot trends, AI models analyze current patterns to project future outcomes. This can range from forecasting quarterly revenue and predicting inventory demands to identifying customers at risk of churn.
Using AI for Forward-Looking Insights
Querio's notebook creates live-data predictive models that evolve through user-guided data threads. Essentially, it allows the model to adjust past code for new scenarios, keeping the forecasting process flexible and relevant to changing contexts [7]. What makes this approach stand out is its transparency - every prediction is tied directly to specific data inputs and assumptions, making it easier to understand and trust.
"Model owners need to invest in prepping their data for AI to ensure Copilot understands the unique business context... Without this prep, Copilot can struggle to interpret data correctly" – Microsoft [8]
To ensure accurate and context-aware forecasts, Querio enhances its linguistic schema by incorporating synonyms and descriptive labels. This helps the AI interpret business-specific terminology more effectively. For example, understanding that "Q4" represents your busiest time of year or that "churn risk" highlights particular customer behaviors leads to sharper, more relevant predictions. This thoughtful approach not only improves forecast accuracy but also ensures that the results are clear and grounded in your specific business context [9].
Avoiding Black-Box Outputs
Transparency is key when it comes to AI-driven forecasts, and Querio prioritizes this by making every prediction inspectable and explainable. Unlike many AI tools that deliver numbers without showing their work, Querio provides full visibility into the logic, data sources, and assumptions behind its forecasts. This level of clarity is crucial, especially when presenting projections to executives or making budget decisions based on AI insights. Being able to explain and defend the numbers builds confidence in the decision-making process.
For better results, it's important to frame your analysis with specific questions, like "Compare budget execution rates across departments", rather than making broad or vague requests. This approach helps the AI deliver more precise and actionable guidance [1].
Personalized and Interactive AI Dashboards
Traditional dashboards often stick to a one-size-fits-all approach, presenting static reports that lack flexibility. AI-powered dashboards, however, take a different route by customizing insights for each user. They highlight the most relevant metrics based on individual roles, past interactions, and current priorities. This shift not only streamlines workflows but also enhances the accuracy of insights, aligning with AI's broader potential in data management.
AI-Driven Personalization Features
AI dashboards go beyond static visuals by tailoring content to specific user needs. For instance, Querio's dashboards adapt to user behavior, presenting role-specific key performance indicators (KPIs). A finance director might see budget metrics at the forefront, while a sales manager gets real-time updates on the sales pipeline.
This "headless BI" approach integrates data insights directly into everyday workflows, cutting down the effort needed to access information. Currently, about 70% of employees don't use data tools for decision-making, primarily because the process feels cumbersome [2]. By embedding analytics into familiar platforms, AI-driven dashboards remove these barriers, making data tools more accessible.
Philip Basaric, Product Manager for Data Products at Whip Media, shared his experience of consolidating multiple reporting systems into a unified AI/BI dashboard:
"AI/BI Dashboards have been an incredibly transformative product... The use of Dashboards for internal reporting has increased overall organizational transparency and enabled non-data teams to make data-informed decisions", he explained [11].
This transition from scattered, static reports to a unified, user-focused interface has empowered teams to independently access and act on insights, reducing reliance on analysts for every query.
Interactive Elements to Improve User Engagement
Personalization is just one part of the equation - interactivity takes it further. Querio dashboards let users engage directly with data through natural language processing in BI commands and dynamic filters. Users can refine insights by asking questions like, "Show me data for Texas only" or "Switch to a pie chart", and the dashboard responds instantly [16][1].
Querio's data threads add another layer of flexibility. These threads allow users to revisit, tweak, and rerun previous instructions to fine-tune visualizations. For example, if an initial chart doesn’t fully meet your needs, you can adjust parameters and regenerate it without starting from scratch. AI-generated insights can also be saved for ongoing monitoring, bridging the gap between exploratory analysis and routine reporting [16]. This seamless interaction complements the personalization features, creating a more intuitive and efficient experience.
Comparison Table: Key AI Personalization Features
Here’s how AI-powered dashboards stack up against traditional methods:
Feature | Traditional BI Dashboards | AI-Powered Dashboards |
|---|---|---|
User Interaction | Manual filtering and static drill-downs | Conversational commands and follow-up questions |
Personalization | Generic, static reports | Tailored KPIs based on user roles |
Insight Generation | Manual deep dives required | Automated data driver summaries |
Data Freshness | Scheduled updates | Real-time data processing |
Setup | Heavy IT/analyst involvement | Self-service with automated governance |
Best Practices for Implementing AI-Powered Dashboards
Getting AI-powered dashboards right isn't just about setting them up - it's about ensuring they deliver actionable insights and remain secure. A dashboard that gathers dust versus one that drives decisions often comes down to implementation and upkeep. While earlier sections highlighted how AI enhances analytics, its success also depends on following key practices for performance and security. Let’s dive into how to make these dashboards work effectively.
Optimizing AI-Driven Dashboards
Start by asking the right questions. Instead of vague prompts like "show me sales data", aim for specific queries such as, "Which region had the fastest profit growth this quarter?" This approach helps the AI focus on delivering precise, actionable insights [1].
Efficiency is another major factor. Using AI-native tools to automate data preparation can save time and reduce errors. For instance, Querio eliminates redundant data storage by querying directly from your warehouse through encrypted, read-only connections. This not only speeds up performance but also cuts storage costs while ensuring there's a single, reliable source of truth. Additionally, Querio's self-hosted options keep sensitive data securely in-house without compromising AI functionality. These optimizations ensure your dashboards are fast, secure, and ready to scale.
Maintaining Governance and Security
Governance and security aren't just nice-to-haves - they’re critical for enabling scalable, self-service analytics. Querio underscores this with SOC 2 Type II compliance and role-based access controls, ensuring users can only access the data they’re cleared to see.
A semantic or metrics layer adds another layer of consistency by standardizing metrics, joins, and business terms across teams. This avoids the headaches of inconsistent KPI calculations. Standard SSO integrations and fully inspectable code allow data teams to audit AI outputs, preserving trust and accountability. By automating governance processes, organizations can expand analytics access without losing control or accuracy.
Conclusion: The Power of AI in Data Visualization
AI is reshaping how businesses interpret and act on data. Traditional dashboards focus on what happened, but Querio's AI goes further - explaining why it happened and suggesting how to respond. With tools like Natural Language Generation, automated pattern detection, and predictive analytics, static reports evolve into dynamic, real-time decision-making aids.
Consider this: data preparation often consumes over 70% of an analytics project's time. AI can slash that effort by 50% to 70% [1]. Companies leveraging AI-driven workflows also report 44% lower operational costs and a 25% reduction in the time it takes to gather insights [12]. And with data generation expected to exceed 180 zettabytes annually by 2025, manual analysis simply isn’t feasible [17].
"AI is no longer a nice-to-have; it's a prerequisite for data-informed decision-making." - Ruby Williams [12]
These advancements do more than cut costs - they simplify analytics workflows. Querio integrates directly with your data warehouse, producing inspectable SQL and Python. Its shared context layer ensures consistent metrics, while SOC 2 Type II compliance and role-based access controls safeguard your data. From building dashboards to embedding analytics into customer-facing tools, Querio keeps your data reliable, accessible, and ready for action.
FAQs
How does AI make data preparation and cleaning faster and easier?
AI takes the hassle out of data preparation and cleaning by automating many of the repetitive and complicated tasks that usually require manual work. It can quickly spot and fix errors, detect unusual patterns, and transform raw data into analysis-ready formats. Tasks like pivoting datasets or creating calculated fields - once time-consuming - become faster and less prone to mistakes.
What’s more, AI leverages advanced tools like natural language processing (NLP). This allows users to describe their data requirements in plain English, and the system handles the rest, executing the necessary transformations automatically. Even those without technical expertise can benefit from this, resulting in cleaner, more accurate data. The outcome? Faster workflows and the flexibility to perform deeper, more tailored analysis for business objectives.
How does natural language processing (NLP) improve AI-powered dashboards?
Natural language processing (NLP) brings a whole new level of ease to AI-powered dashboards by allowing users to interact with data in plain, conversational English. Instead of navigating complex menus or requiring technical know-how, users can simply ask questions like, "What were last quarter's sales trends?" and get instant, visualized insights. Behind the scenes, NLP converts these natural language queries into structured data searches, removing the need for advanced technical skills.
But it doesn't stop there. NLP also drives automated insights and natural language generation, which can summarize trends, flag unusual patterns, and create simple, easy-to-digest reports. These features make dashboards more intuitive and practical, helping teams and organizations make decisions faster. By making data exploration straightforward and accessible, NLP ensures that anyone - no matter their technical expertise - can dive into analytics with confidence.
How does AI improve pattern recognition and detect anomalies in data analytics?
AI takes pattern recognition and anomaly detection to the next level by using advanced algorithms to analyze massive datasets. These systems can process real-time data, identifying trends, recurring patterns, and outliers with impressive speed. Whether it’s spotting unusual activity or deviations that could signal risks or opportunities, AI minimizes the need for manual analysis while boosting both accuracy and efficiency.
What makes AI especially powerful is its ability to learn from historical data. This allows it to pick up on subtle anomalies that traditional methods might miss. In fast-moving industries like finance, cybersecurity, or operations, this ability helps organizations respond more quickly to challenges. Tools like Querio take this a step further, letting users make natural language queries and access predictive analytics. The result? Raw data is transformed into actionable insights that drive smarter, data-informed decisions.
Related Blog Posts