Business Intelligence
How to Eval an AI Data Analyst: Framework + Open Benchmarks
Benchmark AI data analysts with 50–100 versioned business questions, scoring correctness, faithfulness, speed, cost, and follow-ups.

If I were buying or testing an AI data analyst, I’d judge it on five things: correct SQL results, use of approved data sources, response time, total cost, and follow-up accuracy. That means using 50–100 versioned business questions, scoring each task from 0 to 3, and setting clear pass bars like ≥90% overall accuracy, ≤5 seconds end-to-end latency, and stricter source fidelity rules for fields like healthcare and finance.
Here’s the short version:
- I would test SQL correctness against a golden set of expected answers
- I would check faithfulness to approved tables, joins, and metric definitions
- I would track end-to-end latency, not just SQL generation time
- I would measure cost per correct answer in $USD, including model and warehouse spend
- I would test 2- to 3-turn follow-ups to see if context holds
- I would run the benchmark in a live warehouse, not a CSV sandbox
- I would use the same benchmark for vendor review, prompt changes, and regression checks
A polished demo can hide the main risks. Public benchmark data on large enterprise schemas still shows top systems only in the high 50% to low 60% range on hard text-to-SQL tasks, which is why I’d rely on a fixed eval process instead of a sales call.
::: @figure 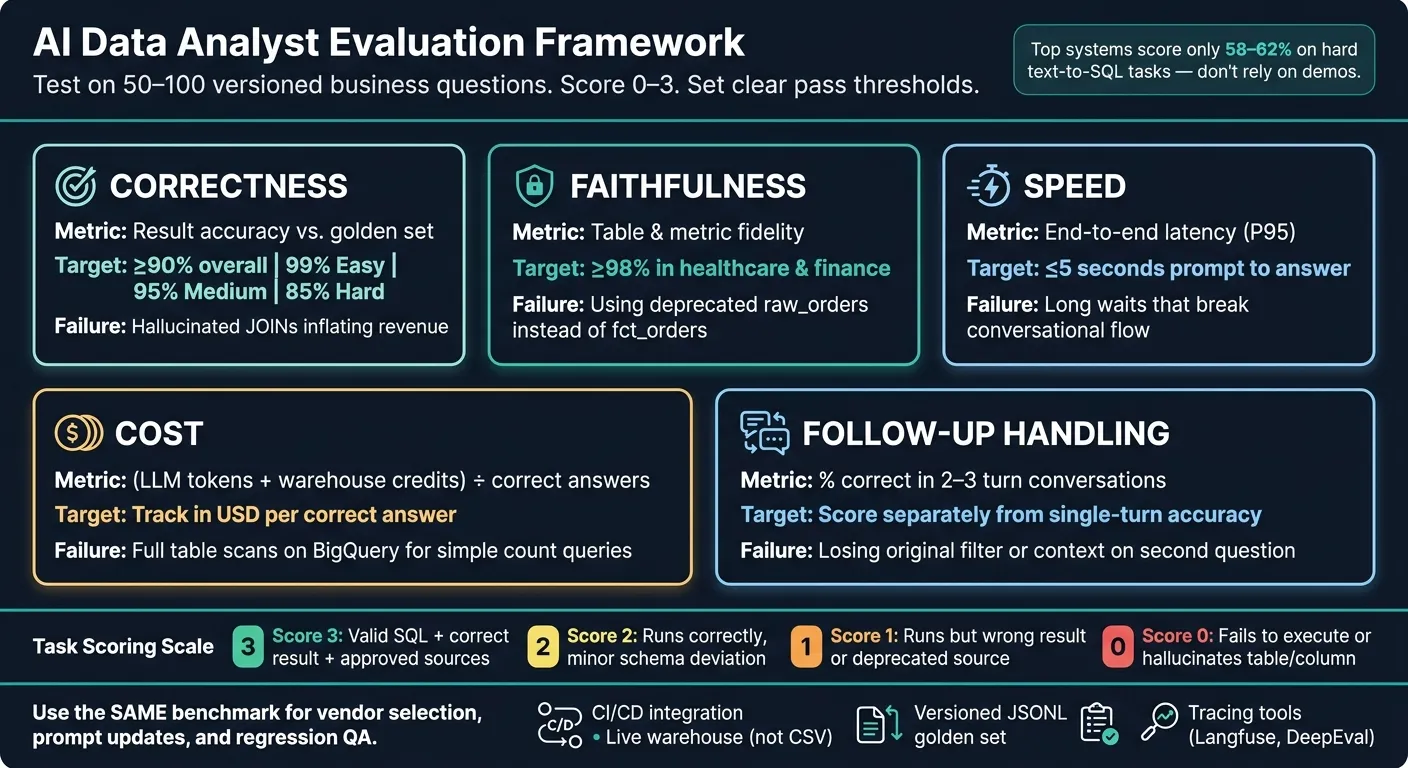 {AI Data Analyst Eval Framework: 5 Key Dimensions & Benchmarks}
:::
{AI Data Analyst Eval Framework: 5 Key Dimensions & Benchmarks}
:::
AI Evaluations Clearly Explained in 50 Minutes (Real Example) | Hamel Husain
::: @iframe https://www.youtube.com/embed/uiza7wp1KrE :::
Quick Comparison
| What I’d Measure | What I’d Check | Starting Target |
|---|---|---|
| Correctness | Output matches expected result without hallucinations | ≥90% overall |
| Faithfulness | Approved tables, joins, metrics | ≥98% in high-risk settings |
| Speed | Prompt to usable answer | ≤5 seconds |
| Cost | Model + warehouse cost per correct answer | Track in $USD |
| Follow-up handling | Correct answers across multi-turn prompts | Score separately |
In other words: I wouldn’t ask whether the tool looks smart. I’d ask whether it gets the right answer, automates SQL safely, and works fast enough, and at a cost my team can live with.
The 5 dimensions to measure
Focus on five dimensions: correctness, faithfulness, speed, cost, and follow-up handling. These are the failure points that show up in day-to-day warehouse work. The table below turns each one into a metric you can score the same way every time.
Correctness and faithfulness
Correctness means the SQL runs and the output matches the expected answer. Check it against a golden set of known-good results. Treat execution success as the first gate, then score result accuracy as the main outcome.
Faithfulness asks a different question: did the analyst use the right tables, joins, and approved metric definitions? A query can run perfectly and still pull from the wrong source. That’s why you should check whether it used approved tables, joins, and metric definitions from dbt or your semantic layer. As Valiotti Data puts it:
"Accuracy lives in your semantic layer and your evaluation set, and the tool sits on top of that." - Valiotti Data [3]
Speed, cost, and follow-up handling
Speed is the full time from prompt to usable answer, including SQL generation and warehouse execution. Track total end-to-end time and P95 latency.
Cost covers both LLM token usage and warehouse query spend. Measure total U.S. dollars per successful answer, not token count by itself.
Follow-up handling checks whether the system keeps context across follow-up questions. If a user asks for a metric and then says, "drill down by region", the analyst should keep the original filters and intent in place. Score this with correct responses across 2- to 3-turn conversations.
Eval dimensions and metrics: comparison table
Use the metrics below to score each dimension the same way every time.
| Dimension | Metric | How to Measure | Why It Matters | Common Failure Pattern |
|---|---|---|---|---|
| Correctness | Result accuracy | Compare AI output vs. a golden set of expected results | Prevents misleading numbers in reports | Hallucinating a JOIN that inflates revenue |
| Faithfulness | Table and metric fidelity | Check whether the analyst used approved tables, joins, and metric definitions from dbt or your semantic layer | Keeps answers aligned with certified definitions | Using a deprecated raw_orders table instead of fct_orders |
| Speed | End-to-end time / P95 latency | Time from prompt submission through SQL generation and warehouse execution | Keeps users in flow | Long waits that break conversational flow |
| Cost | Cost per correct answer | (LLM tokens + warehouse credits) ÷ correct answers, in USD | Helps control cloud and model spend at scale | Full table scans on BigQuery for simple count queries |
| Follow-up handling | Follow-up success rate | % of correct responses in 2- to 3-turn conversations | Supports real investigation workflows | Losing the original filter or context on the second question |
Use these dimensions to set production thresholds in the rubric below.
A scoring rubric for BI-style evals
Turn those five eval dimensions into a rubric based on the questions your team already asks every day. That’s how you move from demo talk to results you can compare and trust.
Build a golden set of real business questions
Start with 50–100 questions pulled from warehouse query logs or analytics platform logs. Use the exact phrasing your users type, along with domain terms like "MRR", "churn", and "CAC." That matters, because made-up prompts often miss the internal metric definitions and business logic hidden inside actual business questions.
For each question, pair it with a ground-truth SQL query and the expected result set. Store everything as versioned JSONL records with these fields: question, ground_truth_sql, and expected_result. This gives you a stable way to compare performance across model, prompt, or schema changes.
A domain expert should manually verify both the SQL and the expected result. When you can, run the eval against a mirror of your production schema in Snowflake, BigQuery, Redshift, or Postgres using safe, anonymized data.
Split the set into three difficulty tiers:
- Easy for single-table aggregations
- Medium for 2–3 table joins
- Hard for subqueries and CTEs
Include edge cases too, and set different targets for each tier. A practical starting point is 99% result correctness for Easy tasks, 95% for Medium tasks, and 85% for Hard tasks. [1]
Once the golden set is ready, score every run the same way.
Score each task on a clear scale
Score each task from 0–3 across syntax, execution, intent, and result. [1]
| Score | Meaning |
|---|---|
| 3 | SQL is valid, runs successfully, and returns the correct result using approved tables and metric definitions |
| 2 | SQL runs and is mostly correct, but has a minor schema or metric deviation |
| 1 | SQL runs but returns the wrong result or uses a deprecated source |
| 0 | SQL fails to execute or invents a table or column |
Keep the raw task scores. Don’t squash them into one combined score. Latency and cost should stay separate too, so an accurate system doesn’t get a free pass if it’s too slow or too expensive.
Set pass thresholds that reflect production use
For most B2B SaaS analytics teams, a solid starting gate is ≥90% overall, with tiered targets by difficulty as listed above. For live analyst use, total latency should stay at ≤5 seconds end to end. [1]
Healthcare and finance teams need tighter rules on faithfulness. In those settings, use a ≥98% table and column fidelity threshold, and score any query that touches an unapproved table or column as a 0, even if the final number looks correct. [1]
"A single incorrect query can poison an entire dashboard, mislead decision-makers, and erode trust in self-serve BI faster than you can deploy a fix." - D23 Team [1]
Review the full golden set on a regular basis, and treat every production miss as a regression test.
How to run repeatable benchmarks with open tools
Start with open benchmarks, then adapt them to your warehouse
After you set your thresholds, the next step is to turn them into a benchmark run you can repeat the same way every time. A rubric gives you a clear yardstick. From there, public text-to-SQL benchmarks are a good way to sanity-check joins, filters, time-series logic, and multi-step analysis.
Then bring that benchmark closer to home. Map it to your own dbt models and the actual questions your users ask. That’s where the test starts to reflect day-to-day use instead of a lab setup.
Automate execution, tracing, and regression tracking
Once the benchmark is versioned, wire it into CI/CD so every prompt change or model update kicks off a full eval run automatically. If result correctness drops below your threshold, the build should fail. Simple, direct, and hard to ignore.
Use tracing tools such as Langfuse, Phoenix, Opik, Promptfoo, and DeepEval to track versioned runs, latency, and pass/fail status. [1][2] For reproducibility, pin the model version and set temperature to 0. [1]
Keep the eval warehouse-native and inspectable
If you want results you can trust, run the same tasks in the warehouse, not in a file-based sandbox. Run evals against a live warehouse connection, not CSV exports and imports, so query plans, joins, and latency match production behavior. [1]
Also, inspect the generated SQL directly. That makes it much easier to see what actually went wrong. Was it a bad join? A wrong metric definition? A filter issue? Without that visibility, you’re guessing.
Querio's governed context layer ties generated SQL back to approved metric definitions, so you can trace failures back to metric definitions, joins, or filters.
How to act on eval results
Use the same benchmark for buying decisions and internal QA
Once your benchmark is set, use it as the same gate for selection, release, and regression checks. In plain English: don’t use one test to pick a vendor and another to judge internal quality. Use the same checklist for evaluating text-to-sql models for vendor selection, prompt updates, and QA. Run it every time you review a new tool, tune prompts, or check stability after a dbt model update or schema change [1].
This matters more than it may seem. If a schema change or dbt update breaks a query, the benchmark should catch it before users do. And when you fix a production bug, add that case to the golden set so it doesn’t slip back in later [1].
Once regressions show up, the next move is to find out where they happen. Report scores by difficulty tier so weak spots are easy to see. A tool can post strong top-line numbers and still fall short on the harder queries your analysts care about most [1].
It also helps to set separate SLAs for:
- correctness
- faithfulness
- latency
- cost
- follow-up success
Track each one on its own. That way, a system that is accurate but slow doesn’t slide through based on headline numbers alone [1].
What good results look like for data teams
If the system passes, you should see the impact in daily work, not just in a benchmark report. When the AI data analyst clears your thresholds on a steady basis, fewer ad hoc questions land on the data team, and more users get answers they can trust on their own.
Keep the SQL and reasoning inspectable so teams can review failures fast. The benchmark should show that the system can answer from governed data, at an acceptable speed and cost, and still handle follow-up questions.
FAQs
::: faq
How do I build a golden set fast?
Start with 50 to 100 real queries from application logs or your analytics platform, not made-up examples. Then group them by type, like aggregations, joins, and time-series, so the set lines up with the business questions people actually ask.
For each query, have a domain expert write the correct SQL and manually check the results. Store versioned sets of the question, ground-truth SQL, and expected results. Then add production failures over time so your eval set gets better as new issues show up.
Run these evals on a test database with representative, anonymized data. That way, you're testing against data that looks like production without exposing private user information. :::
::: faq
What should count as a failed answer?
A failed answer is any AI output that is wrong, unreliable, or misleading for what the user is trying to do.
This includes:
- Semantic errors: it answers a different question than the one the user asked
- Inaccurate results: the numbers or facts don’t match the ground truth
- Context failures: it makes a guess when it should ask for clarification
- Lack of faithfulness: it gives an answer that sounds right but isn’t
- Execution errors: the query or command doesn’t run the way it should :::
::: faq
How often should I rerun the benchmark?
Run your benchmarks again any time you update your prompt, change your database schema, or tweak your governed context layer. That habit helps you spot regressions early, especially in systems tied to live warehouses like Snowflake, BigQuery, or Postgres.
Public benchmarks are a good baseline. But you should also keep a small custom set of 30 to 50 canonical business questions. Use that set to check changing business logic and metrics over time. :::