Business Intelligence
Databricks AI/BI vs Omni: Platform BI or Standalone?
Compare Databricks AI/BI and Omni for governed reporting: setup, metrics, permissions, costs, and a 12‑month revenue test plan.

I’d start with where your data lives: Databricks AI/BI for Databricks-centered reporting, or Omni for a separate BI layer with connections to multiple warehouses. For teams at companies with 100–500 employees, I’d compare access controls, metric ownership, and total cost - not just license fees.
My checklist covers dashboards, natural-language queries, shared metric definitions, connections, permissions, and maintenance. I’d test both tools against the same 12 months of revenue data, checking MRR, logo churn, NRR, filters, and account-level declines against reference SQL. This article provides a test plan, not measured results or a lower-cost winner.
Quick Comparison
| Criteria | Databricks AI/BI | Omni |
|---|---|---|
| BI setup | Reporting inside Databricks | Separate BI layer |
| Reporting tools | Dashboards and Genie | Workbooks, spreadsheet-style analysis, and natural-language queries |
| Metric logic | Unity Catalog and Genie configuration | Git-versioned semantic layer |
| Connections | Databricks SQL warehouse access | Warehouse connectors; verify each required connection |
| Access controls | Unity Catalog and report permissions | Warehouse, connection, and BI permissions |
| Total cost | Check licensing, compute, AI usage, setup, and staff time | Check the same costs, including semantic-layer maintenance |
Before choosing, I’d test with restricted users, confirm where cross-warehouse data will be combined, and assign an owner to each metric. I also outline Querio’s read-only warehouse access, GitHub-synced context layer, and editable SQL/Python notebooks as another governed self-service workflow.
Databricks AI/BI and Omni: How They Work
Databricks AI/BI: Dashboards and Genie
Databricks AI/BI offers two paths: dashboards for reporting and Genie for natural-language analysis. Before rollout, check SQL warehouse access, Unity Catalog permissions, and whether Ask Genie is available in your workspace region.
Omni: Standalone BI and Semantic Modeling
Omni works as a standalone BI layer. Its shared semantic model supports dashboards, ad hoc analysis, and natural-language queries. Check metric reuse, relationships, connector support, and authentication. Test cross-warehouse joins separately.
Side-by-Side Feature Comparison
Use this table to check both tools before running the same reporting test in each.
| Evaluation area | Databricks AI/BI | Omni |
|---|---|---|
| Product model | Integrated Lakehouse BI | Standalone BI layer |
| Dashboards | Authoring, filters, sharing controls | Authoring, exploration, sharing controls |
| Natural-language analytics | Genie configuration, Ask Genie region support | Natural-language capabilities |
| Semantic modeling | Metric consistency across dashboards and Genie | Metric and relationship reuse across dashboards, exploration, and natural-language queries |
| Connectivity | SQL warehouse access, supported data sources | Databricks, Snowflake, and BigQuery connector support; authentication |
| Governance | Unity Catalog permissions, report access | Connection credentials, user permissions, shared-content access |
| Architecture fit | Keep reporting inside Databricks | Use a standalone BI layer |
The revenue test below makes these differences easier to see.
How Omni syncs with Databricks metrics views (two-way integration)
::: @iframe https://www.youtube.com/embed/26BulGqpHoI :::
Reporting Test: One Revenue Task in Both Tools
::: @figure 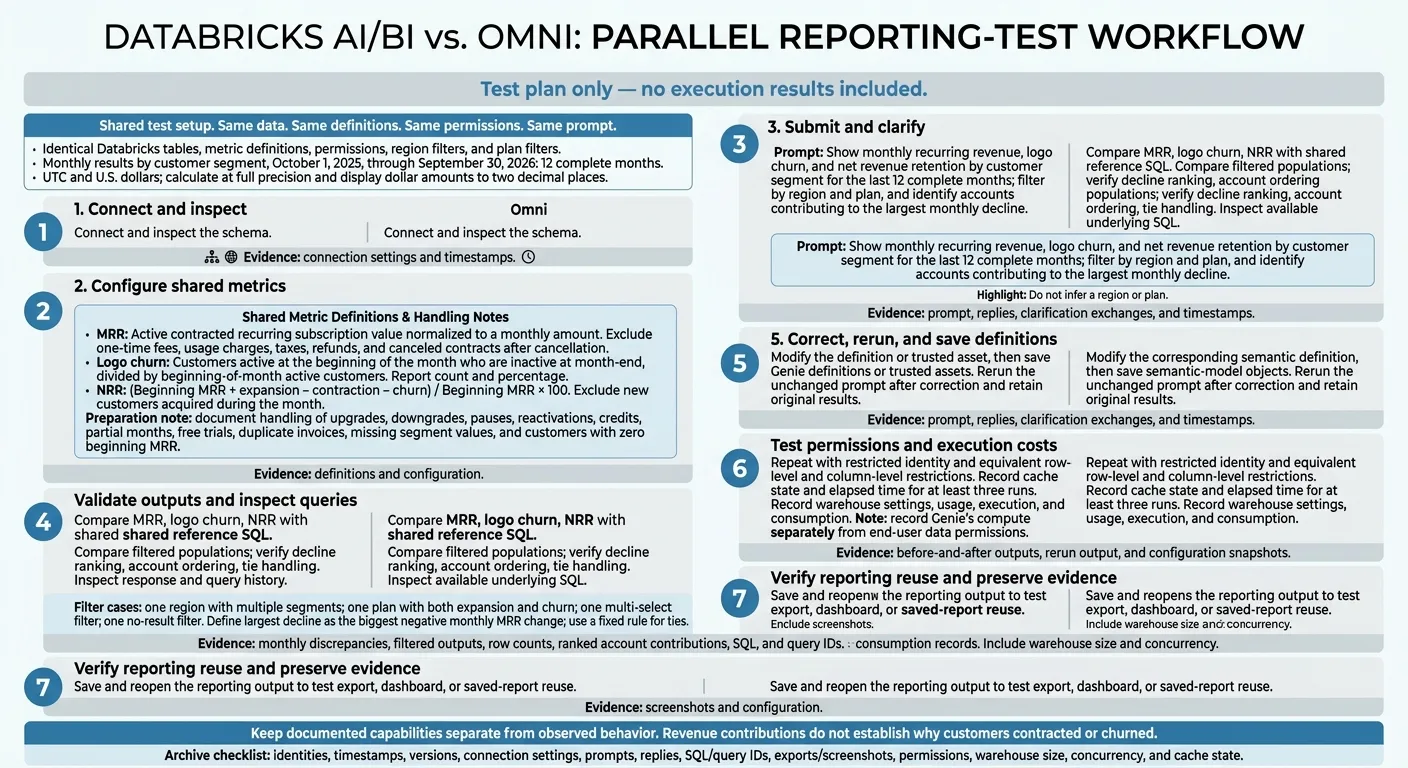 {Databricks AI/BI vs Omni: Revenue Reporting Test}
:::
{Databricks AI/BI vs Omni: Revenue Reporting Test}
:::
Run the same governed revenue question in both tools. Check how each handles metric consistency, filters, and supporting evidence.
Test Dataset, Metrics, and Prompt
Use identical Databricks tables, metric definitions, permissions, region filters, and plan filters in both tools. Report monthly results by customer segment from October 1, 2025, through September 30, 2026, using UTC and U.S. dollars.
- MRR: Active contracted recurring subscription value normalized to a monthly amount. Exclude one-time fees, usage charges, taxes, refunds, and canceled contracts after cancellation.
- Logo churn: Customers active at the beginning of the month who are inactive at month-end, divided by beginning-of-month active customers. Report both the count and percentage.
- NRR:
(Beginning MRR + expansion − contraction − churn) / Beginning MRR × 100. Exclude new customers acquired during the month.
Before testing, document how you’ll handle upgrades, downgrades, pauses, reactivations, credits, partial months, free trials, duplicate invoices, missing segment values, and customers with zero beginning MRR. Calculate at full precision, then display dollar amounts to two decimal places.
Use this exact prompt:
Show monthly recurring revenue, logo churn, and net revenue retention by customer segment for the last 12 complete months; filter by region and plan, and identify accounts contributing to the largest monthly decline.
Log every clarification question. Do not infer a region or plan. Test one region with multiple segments, one plan with both expansion and churn, one multi-select filter, and one no-result filter.
Define the largest decline as the biggest negative monthly MRR change. Rank contributing accounts using a fixed rule for ties. Revenue contributions do not establish why customers contracted or churned.
The records below let you compare consistency, traceability, and filter behavior across platform-integrated and standalone BI.
Test Results and Supporting Records
No execution results are included here. The table defines the exact test, not its outcome.
| Test step | Databricks AI/BI | Omni | Evidence to retain |
|---|---|---|---|
| Dataset connection and schema discovery | Connect and inspect the schema | Connect and inspect the schema | Connection settings and timestamps |
| Metric-definition setup or semantic-model configuration | Configure Genie metric definitions or trusted assets | Configure corresponding semantic definitions | Definitions and configuration |
| Prompt submission | Submit the unchanged prompt | Submit the unchanged prompt | Prompt, replies, and timestamps |
| Clarification questions and ambiguity handling | Record follow-up questions | Record follow-up questions | Clarification exchanges and final interpretations |
| Correctness of MRR, logo churn, and NRR | Compare with reference SQL | Compare with the same reference | Monthly discrepancies |
| Correctness of segment, region, and plan filters | Compare populations for single-select, multi-select, and no-result cases | Compare the same populations | Filtered outputs and row counts |
| Identification of accounts contributing to the largest decline | Verify month ranking, account ordering, and tie handling | Verify the same ranking, ordering, and tie handling | Ranked account contributions |
| SQL or generated-query visibility | Inspect response and query history | Inspect available underlying SQL | SQL and query IDs |
| Manual correction of an incorrect result | Modify the definition or trusted asset | Modify the corresponding semantic definition | Before-and-after outputs |
| Re-running the corrected request | Rerun the unchanged prompt after correction | Rerun the unchanged prompt after correction | Rerun output |
| Reusable metric definitions or model objects | Save Genie definitions or trusted assets | Save semantic-model objects | Configuration snapshots |
| Row-level and column-level permission enforcement | Repeat with a restricted identity | Repeat with equivalent restrictions | Permission snapshots |
| Query duration and result-refresh behavior | Record cache state and elapsed time | Record cache state and elapsed time | At least three runs |
| Warehouse, Databricks SQL, or other compute consumption | Record warehouse settings and usage | Record connection, warehouse, and usage | Execution and consumption records |
| Export, dashboard, or saved-report reuse | Save and reopen the reporting output | Save and reopen the reporting output | Screenshots and configuration |
Save identities, timestamps, versions, connection settings, prompts, replies, SQL/query IDs, exports/screenshots, permissions, warehouse size, concurrency, and cache state. Keep documented capabilities separate from observed behavior.
Databricks query history can expose warehouse SQL, and dashboard caching can affect refresh timing.[6][7] Record Genie’s compute credentials separately from end-user data permissions.[3][4]
After correcting any definition mismatch, rerun the unchanged prompt in both tools and retain the original results. Once you’ve checked the outputs, compare the governance work and costs behind each workflow.
Governance and Total Cost
After validating the reporting test, pin down who owns the metric logic and what it costs to maintain that governance.
Metric Definitions and Access Controls
Assign one owner to each revenue metric. Databricks AI/BI puts metric ownership in Unity Catalog; Omni puts it in the semantic layer. The choice comes down to where ownership sits: inside Databricks or in a separate BI layer.
| Governance area | Databricks AI/BI | Omni |
|---|---|---|
| Ownership | Named owners for Unity Catalog metric definitions | Named owners for shared semantic definitions |
| Change review | Verify approved changes reach dashboards and natural-language answers | Verify approved changes reach dashboards and natural-language answers |
| Row-level access | Warehouse permissions and BI access settings | Warehouse permissions and BI access settings |
| Audit records | Confirm audit records link BI activity to warehouse execution and access changes | Confirm audit records link BI activity to warehouse execution and access changes |
| Duplicate logic | Check for duplicate metric logic in dbt and Unity Catalog | Check for duplicate metric logic in dbt and the semantic layer |
Keep one definition per metric, document where it lives, and require review before publishing changes. For sensitive data, test with restricted users on every release to verify that row-level controls block access they shouldn’t have.
Databricks-centered teams can keep ownership within their existing platform. Teams working across Snowflake, BigQuery, Redshift, or Postgres should assess the work needed to govern a shared Omni semantic layer.
With ownership and access settled, compare the total cost of maintaining that setup.
Licensing, Compute, and Admin Costs
Total cost includes software, warehouse compute, AI usage, deployment, and staff time. Ask each vendor how you can cap query spend and attribute usage.
| Cost component | Databricks AI/BI | Omni |
|---|---|---|
| BI licensing | Required plan and entitlements | Current terms and user categories |
| Warehouse compute | Compute and infrastructure charges | Compute and infrastructure charges |
| AI usage | Billing basis, allowances, limits | Billing basis, allowances, limits |
| Deployment | Setup effort and platform changes | Setup effort and platform changes |
| Administration | Definition maintenance, access reviews, query-spend controls, and support | Semantic-layer maintenance, access reviews, query-spend controls, and support |
Fewer licenses don’t automatically mean lower total cost. Databricks-centered teams should budget only for incremental work. Multi-platform teams should also account for duplicate metric logic and support across warehouses. That cost split often determines whether to keep BI inside the warehouse platform or run it as a separate BI layer.
Conclusion: Choose the BI Setup That Fits Your Team
Databricks AI/BI fits Databricks-centered teams. Omni fits teams that need a standalone BI layer across multiple warehouses. The test does not establish a winner, and the cost section does not establish which option is cheaper.
Decision Checklist for Data Teams
Once you’ve reviewed governance and cost, decide where your BI should live.
| Team requirement | Fit | What to validate |
|---|---|---|
| Full Unity Catalog adoption | Databricks AI/BI | Test dashboard and Genie access with a restricted user |
| Multiple warehouse connections | Omni | Check required connectors and where cross-warehouse data will be combined |
| Dedicated BI workflows | Omni | Confirm analysts have time for upfront modeling |
| Strict compute budgets | Databricks AI/BI | Check warehouse sizing, query limits, and cache behavior |
Before committing, document where you’ll combine data from sources such as Snowflake and BigQuery using warehouse-native data analysis tools.
Querio's Governed Self-Serve Workflow
Whichever BI setup you choose, assign ownership of the governed self-serve workflow. Querio connects to live warehouse data through read-only access. It keeps metrics and joins in a governed context layer synced to GitHub, while letting users inspect and edit SQL/Python in reactive notebooks for access-controlled self-service.
FAQs
::: faq
How do we prevent metric drift across BI tools?
Define business logic, metric calculations, and table relationships in one central semantic or context layer [1][2][3]. Share these versioned definitions across chat, dashboards, and notebooks. That way, metric updates flow consistently across tools without rebuilding the same logic in several places [1][2].
This keeps extract-driven workflows and scattered definitions from producing inconsistent results [1][4]. If you use dbt, connect the layer to your existing models to keep transformation and BI logic in sync [4][5]. :::
::: faq
How can we test AI answers for data leaks?
Choose platforms that let you inspect and edit the SQL or Python behind every AI response. Review the code to see which tables and columns it queries. Check that it follows row- and column-level permissions in the warehouse or semantic layer.
Compare answers against known results or certified metrics. Test model updates in a sandbox or branch before moving them to production. Confirm that every AI-generated query is logged so you can audit access, spot logic errors, and check for data exposure that violates access permissions. :::
::: faq
How do we estimate BI costs before rollout?
Budget for both platform fees and warehouse compute costs. Warehouse-native tools query live data, so user interactions add variable compute charges on top of subscription fees [1][2].
Review your current query volume to estimate compute needs for ad hoc analysis and scheduled dashboard updates [1]. Check how each tool charges: per seat, by monthly tier, or through a custom enterprise quote [1][2][3]. Favor tools that let you inspect the SQL, so you can optimize inefficient queries and keep warehouse costs in check [1][4]. :::