Business Intelligence
Business Intelligence in the AI Era: A Complete Guide (2026)
AI-powered BI with warehouse-native data, a governed semantic layer, inspectable SQL/Python, live queries, and anomaly alerts.

BI in 2026 is simple to describe: your warehouse stays at the center, and AI sits on top of governed metrics and semantic layers. If you run Snowflake, BigQuery, Redshift, or Postgres with dbt, the job is no longer just building dashboards. It is making sure people can ask plain-English questions, get the same KPI every time, inspect the SQL, and see whether the answer came from defined logic or model inference.
Here’s the short version:
- Old BI was request-based: analyst writes SQL, user waits, follow-up starts the cycle again.
- Current BI is warehouse-native: dashboards, notebooks, and natural-language queries all sit on the same metric layer.
- AI helps most with SQL/Python generation, change summaries, and anomaly alerts.
- Trust comes from governance: one KPI definition, live warehouse queries, visible lineage, and labels for sourced vs. inferred answers.
- Best fit teams are often 100–500-person B2B SaaS companies that want self-serve reporting without metric drift.
A few facts from the article stand out. By 2026, teams expect BI tools to support natural-language access, live warehouse querying, and agent-ready outputs. And for day-to-day work, that means less analyst rework, fewer metric disputes, and more self-serve use across finance, GTM, and support.
If I boil the full guide down to one idea, it’s this: good BI now depends less on pretty dashboards and more on whether the logic is shared, visible, and tied to live data.
| Area | What matters now |
|---|---|
| Data source | Live access to Snowflake, BigQuery, Redshift, or Postgres |
| Metric logic | One semantic layer for joins, KPIs, and business rules |
| User access | Dashboards, notebooks, and plain-English questions |
| AI role | SQL/Python generation, summaries, anomaly flags |
| Trust check | Can I inspect the query and trace the metric? |
So if you’re judging a BI setup in 2026, I’d keep the test plain: Can non-technical teams get answers on their own, and can analysts verify every answer without guesswork? That is the standard this guide is pointing to.
The modern BI stack in 2026
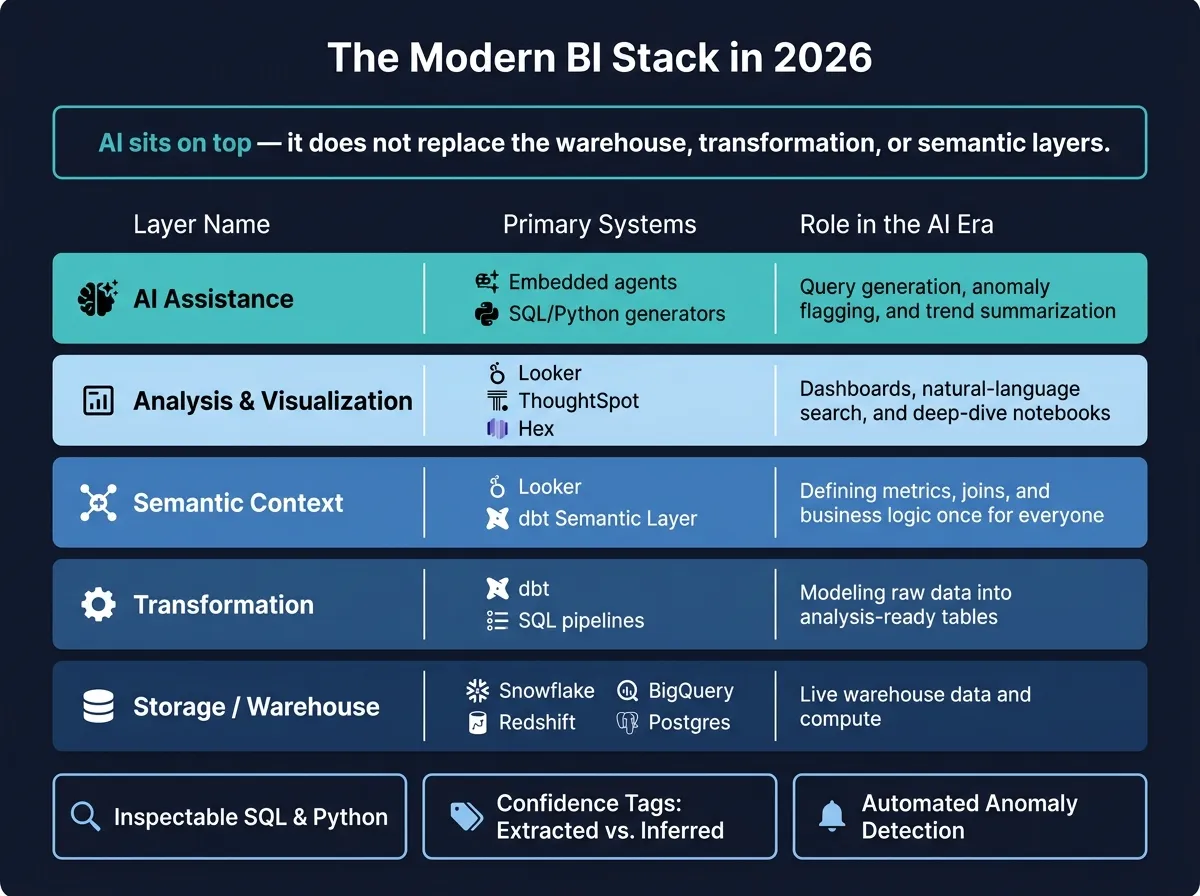
The stack is mostly the same. AI now sits on top of it.
That’s the big shift. AI doesn’t replace the warehouse, transformation layer, semantic context, or analysis tools. It works with them. For SaaS teams, this stack is what turns governed warehouse data into answers people can act on.
| Layer | Primary Systems | Role in the AI Era |
|---|---|---|
| Storage / Warehouse | Snowflake, BigQuery, Redshift, Postgres | Live warehouse data and compute |
| Transformation | dbt, SQL pipelines | Modeling raw data into analysis-ready tables |
| Semantic Context | Looker, dbt Semantic Layer | Defining metrics, joins, and business logic once for everyone |
| Analysis & Visualization | Looker, ThoughtSpot, Hex | Dashboards, natural-language search, and deep-dive notebooks |
| AI Assistance | Embedded agents, SQL/Python generators | Query generation, anomaly flagging, and trend summarization |
Warehouse, transformation, and semantic context
Everything starts in the warehouse. Snowflake, BigQuery, Redshift, and Postgres store live data and handle compute. From there, dbt turns raw data into clean tables that analysts - and AI tools - can use without a lot of cleanup.
Then comes the semantic layer for SaaS. This is where teams define joins, metrics, and business logic in one place. So instead of every dashboard and every AI prompt using slightly different rules, everyone works from the same playbook. Once those definitions live in one place, the next step is simple: how do people get to them?
Dashboards, notebooks, and natural-language analysis
Most teams - finance, analytics, and GTM - need three ways to work with data.
Dashboards in Looker cover recurring KPIs that people check every Monday morning. They’re for the stuff you want at a glance.
Notebook environments like Hex are better for deeper work. An analyst can mix SQL, Python, and written explanation to dig into a trend or build a model.
Natural-language querying in ThoughtSpot gives non-technical users a much easier path. A GTM lead or finance manager can ask a plain-English question and get a chart back in seconds.
In 2026, these modes should connect directly. A person should be able to ask a question in plain English, inspect the SQL behind it, and then keep going in a notebook if the question gets more involved. That handoff matters. It’s where AI agents can add speed without messing up governance.
Where AI agents actually help
AI agents in BI help most when they stay in their lane and respect the semantic layer.
The clearest use cases are pretty practical:
- Generating or cleaning up SQL and Python
- Summarizing what changed in a metric week over week
- Flagging anomalies before a human spots them
What makes this work is inspectability. That’s the line that separates AI BI people use from AI BI people ignore: black box vs. inspectable logic.
Agents should show the SQL they ran. They should let users edit it. And they should label what came from source data versus what was inferred.
Core capabilities every AI-driven BI platform needs
Once the warehouse, semantic layer, and analysis tools are in place, the next step is simple: can people trust the platform in day-to-day work?
In production, AI BI comes down to three things: governed metrics, logic people can inspect, and monitoring that runs on its own.
Governed metrics and reliable natural-language answers
Natural-language querying only works when the AI uses approved business logic instead of raw tables and schema names. If a finance manager asks, "What was our net revenue retention last quarter?", the platform should know exactly how NRR is defined, which tables to join, and which filters to use.
When NLQ is poorly governed, answers drift. Two people can ask the same question and get different numbers because the AI read the schema a different way each time. That’s a mess.
A good test is to ask the platform how it got to an answer. Which tables did it use? Which metric definitions did it apply? If it can’t show that path, treat that as a red flag. Platforms that separate answers based on approved definitions from answers inferred by the model give data teams a much clearer read on what they can trust.
That same governed context should also carry into code generation and monitoring.
Inspectable SQL, Python, and live warehouse access
Unreadable SQL is a liability. Analysts need to check what the AI ran, spot edge cases, and reuse the logic somewhere else.
CSV exports and extracts create lag and version drift. If Snowflake, BigQuery, or Redshift is the source of truth, the BI platform should query it directly every time. Querio connects to the warehouse with encrypted, read-only credentials and generates real SQL and Python for every answer, so nothing is hidden and nothing gets duplicated.
Here’s the simplest test: run the generated SQL in the warehouse. If an analyst can paste it into their query editor and get the same result, the platform is doing what it should.
Automated insights, anomaly detection, and decision support
The same governance rules should power monitoring and alerts too. Analysts can’t watch every metric all the time. Automated monitoring fills that gap by flagging when conversion drops without warning, when support volume jumps, or when a cohort’s churn rate moves outside its normal range.
Useful anomaly detection should account for launches, seasonality, and other known events. Otherwise, teams get buried in noise. When alerts connect back to the governed semantic layer, teams can act right away instead of stopping to check whether the number itself is wrong.
| Capability | Why It Matters | What to Check |
|---|---|---|
| Governed semantic layer | Keeps metric definitions consistent across NLQ, dashboards, and notebooks | Can the data team version and update definitions in one place? |
| Inspectable SQL/Python | Lets analysts verify, debug, and reuse generated logic | Is the generated code editable and executable outside the platform? |
| Live warehouse connection | Avoids stale data, CSV exports, and duplicated logic | Does it query Snowflake, BigQuery, or Redshift directly? |
| Confidence tagging | Separates facts from AI-inferred relationships | Does the platform label what came from defined logic versus what was inferred? |
| Anomaly detection | Flags KPI shifts before people notice them | Does it tie alerts back to governed metrics and explain why they fired? |
How teams use AI BI in daily work
Once metrics and business logic are governed, AI BI makes day-to-day analysis much faster for analytics, finance, operations, and GTM teams. You see it most clearly in variance analysis, anomaly response, and self-serve GTM reporting.
Analytics and finance: metric consistency and faster variance analysis
When ARR, gross margin, or funnel conversion is defined in a governed semantic layer, dashboards, notebooks, and natural-language questions all pull from the same approved logic. That matters because no one wants three versions of the same metric floating around the company.
For finance teams, the payoff often shows up in variance analysis. An analyst can ask why gross margin changed, then trace the answer back to the metric definition and the warehouse query behind it. Confidence tags help too. They show whether the answer came from defined logic or model inference. [1]
Operations and GTM: anomaly detection and self-serve performance analysis
The same setup works outside finance.
Operations teams need to catch changes as soon as they start affecting fulfillment, support, or onboarding metrics. Automated monitoring on governed metrics can flag those shifts fast, and the alert should make two things clear: which metric changed, and whether the signal came from defined logic or inference. [1]
GTM teams get a lot from self-serve access without having to rewrite core metrics. If a sales manager asks about average sales cycle, pipeline, win rate, or stage conversion, they should get the same answer in a dashboard or through a natural-language query. Why? Because the definitions live in the semantic layer, not inside each one-off query.
That cuts routine data requests without giving up consistency. And with live connections to Snowflake, BigQuery, Redshift, or Postgres, the data stays current.
These day-to-day workflows are where platforms prove themselves: governed metrics, editable logic, and live warehouse access.
How to evaluate and adopt an AI-driven BI platform
Evaluation criteria that matter in 2026
Once BI becomes part of daily reporting, variance analysis, and alerts, the big test is simple: can the platform keep trust intact as usage grows?
A common mistake is judging BI tools by how slick the demo looks instead of looking at the system behind the answers. That part matters more. The platform needs to keep metrics steady, separate defined logic from inference, and show the SQL or Python behind each answer.
| Capability | 2026 Standard | Why It Matters |
|---|---|---|
| Data connection | Live warehouse-native connections to Snowflake, BigQuery, Redshift, or Postgres | Keeps answers current without extracts |
| Logic layer | Governed semantic context layer | Consistent metric definitions across users |
| Trust mechanism | Confidence tags: Extracted vs. Inferred [1] | Makes clear whether the answer came from defined logic or AI inference |
| Inspectable logic | Editable SQL and Python | Analysts can verify and refine generated work |
| Relationship tracing | Path tracing across warehouse entities | Test whether it can trace how warehouse entities connect, such as User to BillingRecord |
With those requirements in mind, the right platform is the one that keeps governed self-serve usable for non-technical teams.
When Querio fits best for governed self-serve analytics
Querio fits data leaders and analysts at 100–500-employee B2B SaaS companies that run a real warehouse with dbt and need governed self-serve analytics on live warehouse data without giving up metric control.
Here’s why that matters. Querio combines live warehouse connections, inspectable and editable SQL and Python, and a governed semantic context layer. So teams can ask the same question in a dashboard, a natural-language query, or a reactive notebook and get the same answer. The metric logic lives in one place, which cuts down on confusion and back-and-forth.
Conclusion: What good BI should deliver in 2026
Modern BI doesn’t replace analysts. It helps their work reach more of the company without turning every answer into a debate.
The platforms worth adopting in 2026 are warehouse-native, governed, and inspectable. That means warehouse data, a semantic layer, natural-language access, and inspectable outputs working together as one system.
The teams that get the most from AI BI are the ones where finance, operations, and GTM can ask a question and trust the answer because the logic is defined once and applied everywhere. That leads to faster answers, fewer metric disputes, and stronger self-serve adoption.
FAQs
What makes BI AI-ready in 2026?
In 2026, BI is AI-ready when it blends natural-language interaction with strong governance, warehouse-native connectivity, and code you can inspect.
That means it does more than serve up dashboards. It uses a semantic layer so metrics like MRR or churn stay consistent across the business. It shows the SQL or Python behind each answer, so people can check how the result was produced. And it connects live, in read-only mode, to warehouses like Snowflake, BigQuery, or Redshift instead of leaning on CSV exports or stale batch data.
Why is a semantic layer so important for self-serve analytics?
A semantic layer matters for self-serve analytics because it turns business terms into raw data logic and keeps metrics consistent across the company.
In plain English: it maps terms like revenue or active customers to clear definitions in the data. That way, teams don't end up calculating the same metric in different ways and arguing over whose number is right.
It also helps AI produce better answers. Why? Because the semantic layer gives AI the context it needs to interpret data more accurately and return insights that make sense.
The result is simple: teams can dig into data on their own, but still work inside a trusted framework with consistent definitions.
How can teams trust AI-generated answers in BI?
Teams trust AI-generated BI answers when the system is transparent, governed, and tied to live data. The goal is simple: swap black-box outputs for answers people can check for themselves.
That usually comes down to a few things:
- Inspectable SQL or Python so teams can review the logic, edit it, and run it again
- A governed semantic layer that keeps metrics like MRR or churn consistent
- Live warehouse connections and user feedback to catch errors and improve definitions over time
If people can see how an answer was built, trust goes up. If the logic lines up with shared metric definitions, confusion drops. And if the system pulls from current warehouse data instead of stale exports, teams have a much better shot at acting on the answer with confidence.