Business Intelligence
What Are BI Tools? Types, Examples, and How AI Is Changing Them
BI tool choice—dashboard, self-service, or AI—comes down to a governed warehouse and inspectable logic.

BI tools turn warehouse data into answers your team can use. If I had to boil this article down to the parts that matter most, it’s this: there are 3 main BI tool types - dashboard/reporting tools, self-service analytics tools, and AI-driven BI tools - and the right pick depends on your team’s workflow, metric control, and warehouse setup.
Here’s the short version:
- Dashboard tools fit stable KPI tracking and set reports
- Self-service tools fit ad hoc analysis, but can lead to metric drift
- AI-driven BI can shorten analysis work, but only if the logic is visible and the metric layer is controlled
- All 3 depend on a clean warehouse layer in tools like Snowflake, BigQuery, Redshift, or Postgres
- For AI use, I’d look hard at readable SQL, source visibility, permissions, and SOC 2 Type II
A simple way to think about it: BI tools sit between your warehouse and the people asking questions. If that layer is messy, your dashboards, reports, and AI answers will be messy too.
Quick comparison:
| BI type | Best for | Main risk | Best when |
|---|---|---|---|
| Dashboards & reporting | KPI tracking, exec reporting | Too rigid for new questions | Metrics are steady |
| Self-service analytics | Team-led analysis | Metric drift | Data models are clean |
| AI-driven BI | Natural-language Q&A, anomaly flags, multi-step analysis | Hard-to-check answers | SQL, steps, and sources are visible |
What changed in 2026 is simple: AI is now part of BI, not a side feature. But chat alone is not enough. If I can’t inspect the query, metric logic, and source behind the answer, I wouldn’t trust the output.
The Main Types of BI Tools
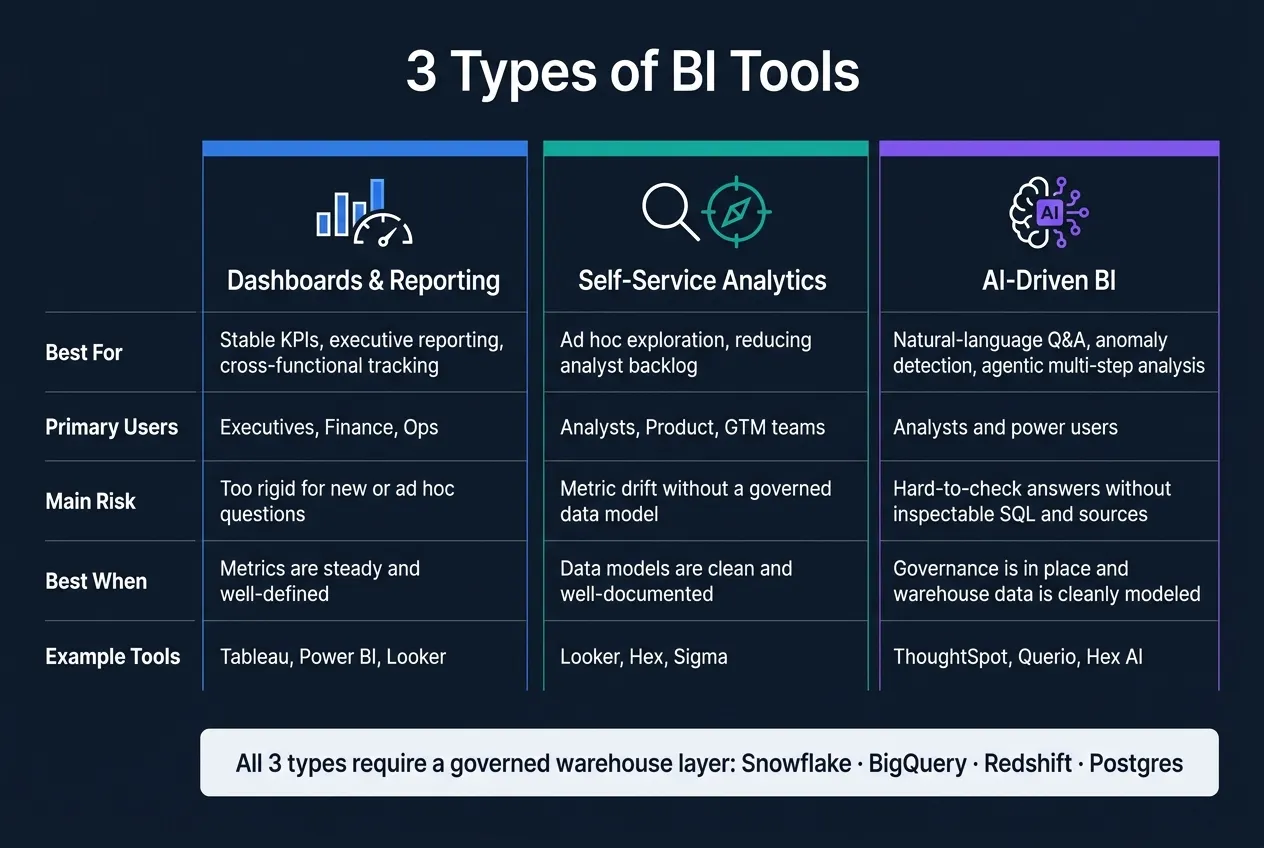
Most BI tools fall into three practical buckets: dashboards and reporting tools, self-service analytics platforms, and AI-driven BI systems. Each one handles a different job, fits a different kind of team, and brings its own tradeoffs.
One thing stays the same across all three: they still depend on a governed warehouse layer underneath. In plain English, the BI layer sits on top of warehouse-modeled data in Snowflake, BigQuery, Redshift, or Postgres. From there, the job is simple to describe but harder to get right: match the tool type to your team size, workflow, and governance needs.
Dashboards and Reporting Tools
These are the default choice for most data teams. Tools like Tableau, Power BI, and Looker are often used to build curated dashboards, schedule reports, and track KPIs in a consistent, governed way.
That setup works well for common business needs. Executives get scorecards. Finance gets monthly reports. Product gets the views it needs.
There’s a big upside here: when a metric is defined once and used in a shared dashboard, there’s less confusion about what “ARR” or “churn rate” means across the company. Everyone is working from the same source instead of arguing over numbers in separate spreadsheets.
The downside? These tools can feel rigid. They fit teams with stable reporting needs, but ad hoc analysis tends to slow down when every new question needs an analyst-built view.
Self-Service Analytics and Visualization Tools
Self-service tools are built for exploration. They let analysts and business users create their own views and dig into data without waiting for a new dashboard every single time.
That can save a lot of back-and-forth. It also cuts down on repeat analyst requests. But there’s a catch: self-service can lead to metric drift. That happens when the same metric gets calculated in different ways across teams because people are building charts from shared datasets without a governed model.
So while these tools open things up, they also need guardrails. They work best when the underlying data model is clean, well-documented, and enforced. Without that, self-service can turn into a free-for-all pretty fast.
AI-driven BI is trying to ease that tradeoff by automating more of the exploration layer.
AI-Driven BI Systems
AI-driven BI systems use natural-language queries, automated insights, anomaly detection, and agentic analysis to cut manual work. Examples include ThoughtSpot and Hex-style AI-native BI workflows.
What separates serious AI-driven BI from novelty isn’t the chat interface. It’s governed logic and transparent outputs. If the output is grounded, teams can check it. If the analysis is agentic, it only matters when the logic stays inspectable.
That’s the part that changes how teams judge BI tools. They’re not just asking, “Can this answer a question?” They’re asking, “Can we trust how it got there?”
| Category | Best For | Main Tradeoff |
|---|---|---|
| Dashboards & Reporting | Stable KPIs, executive reporting | Rigid; ad hoc questions need analyst time |
| Self-Service Analytics | Ad hoc exploration | Metric drift without a governed data model |
| AI-Driven BI | Automated insights, self-serve | Reliability depends on governed logic |
How to Compare BI Tool Categories for Your Business Needs
Once you know the main BI categories, the next step is to match them to your team’s workflow and governance maturity. Pick BI tools based on how your team works and how mature your data setup is, not on a long feature checklist. The best category comes down to what your team needs to do right now.
Matching BI Categories to Team Size and Workflow
Dashboards and reporting tools work well for teams that need steady visibility into KPIs. They’re a good fit when people mainly want the same numbers, tracked the same way, across functions.
As product, GTM, and finance teams start asking follow-up questions, self-service analytics starts to make more sense. That’s usually the point where data teams need to give people room to dig in without losing control over how metrics are defined.
AI-driven BI tends to fit best when governance is already in place and the warehouse data is modeled clearly. If the data layer is messy, AI can make that mess harder to spot, not easier.
Use the table below to compare each category by who uses it and where it fits best.
| BI Category | Primary Users | Best-Fit Use Case |
|---|---|---|
| Dashboards & Reporting | Executives, finance, ops | Stable KPIs and cross-functional tracking |
| Self-Service Analytics | Analysts, product, GTM | Ad hoc exploration and reducing analyst backlog |
| AI-Driven BI | Analysts and power users | Automated insights and agentic workflows |
What to Look for When Evaluating a BI Tool
A polished demo can look great. But a few criteria do a much better job of showing whether a BI tool will actually work for your team over time.
Live warehouse connectivity is non-negotiable. If a tool depends on CSV exports or manual syncs from Snowflake, BigQuery, Redshift, or Postgres, freshness problems show up fast. You want a direct warehouse connection.
Semantic or metric governance matters more than many teams expect at the start. If one team defines “active users” one way and another team defines it another way, no chart can fix that. Look for tools that let you define metrics once and use them the same way across the business.
Inspectable queries and steps are a must for AI-driven tools. If a tool gives you an answer but can’t show the query behind it - or the steps it used to get there - you have no clean way to verify the result when it counts.
For AI-driven BI, governance controls matter even more. Data leaders should verify SOC 2 Type II certification, zero data retention options for sensitive queries, and whether admins can control how much context the system keeps from past sessions. They should also check whether the tool can show the sources behind an AI-generated insight. [1][2]
Permissions and role-based access matter because self-serve only works when people can dig into data safely, without seeing restricted information or publishing metrics that haven’t been validated.
Those controls matter even more when AI starts answering questions directly.
How AI Is Changing BI Tools
Once you pick a BI category, AI changes both what that category can do and what it has to prove. It speeds up answers, automates routine analysis, and puts a lot more pressure on trust.
Natural-Language Queries, Automated Insights, and Anomaly Detection
People can now ask questions in plain English and get structured answers back fast, without waiting on someone to build a new report. But the bigger shift is this: AI doesn't just respond anymore. It also pushes insights on its own, surfacing anomalies and summaries without being asked.[2]
That sounds great on paper. In practice, these signals only help when they come from well-modeled data. AI-driven BI on top of clean, modeled warehouse data in Snowflake, BigQuery, Redshift, or Postgres can produce answers that product, finance, and GTM teams can actually use. Put the same layer on messy or poorly modeled data, and it doesn't fix the problem. It spreads the confusion faster.
Why Inspectable SQL, Python, and Semantic Governance Matter More with AI
As AI takes on more of the analysis, the logic underneath it has to stay visible. That's non-negotiable.
Inspectable SQL and Python are the base for trust in AI-driven BI. If a tool writes a query against your warehouse, you should be able to read it, edit it, and check it against your semantic layer. If you can't, then the number has no audit trail.
Semantic governance matters just as much. Say "active users" means one thing to product and something else to sales. An AI system that pulls from both definitions can give you an answer that sounds certain but is still wrong. That's the trap. The semantic layer needs to be the source of truth for business logic, so a governed metric layer keeps definitions aligned and makes AI answers easier to defend.
What Agentic Analysis Changes for Analysts and Business Users
The next step is multi-step analysis that can follow a lead instead of stopping at a single answer.
Agentic BI goes past one-question responses by chaining sub-questions into a structured summary.[1] For small data teams, that can remove a lot of drag. Repetitive stakeholder questions get handled without pulling in an analyst every time, and the output gives people something to react to instead of a blank page.
The main thing to watch is whether that agentic output is traceable. Systems that show the queries, steps, and sources behind a multi-step analysis give analysts a way to verify the work and build on it. Without that traceability, analysts are stuck with two bad options: trust a black box or redo the work themselves.
Conclusion: Choosing the Right BI Tool and Where Querio Fits
BI tools turn warehouse data into decisions. The best fit depends on how your team works, how tightly you need control, and how far along you are. At the end of the day, the real question is simple: does the tool fit your warehouse, your users, and your rules for data governance?
Warehouse-native BI is starting to feel like the default choice. It keeps data and definitions in one place, which cuts down on confusion. AI is also making BI more conversational and more proactive. But there’s a catch: those answers still need governed logic behind them. Across every category, the thing that matters most is whether the tool keeps metrics consistent and easy to audit. The best systems let you trace every result back to a metric definition, a readable query, and logic you can inspect.
Why Warehouse-Native, Governed BI Is Becoming the Default
As teams grow, one test matters more than anything else: can a single metric definition power dashboards, self-serve analysis, and AI output?
Direct warehouse access helps a lot here. It keeps analysis current and avoids the drift that often comes with extracts. When queries run straight against Snowflake, BigQuery, Amazon Redshift, or Postgres, the answers reflect what’s actually in the warehouse.
A lot of teams now use a mix of tools. They pair an AI analyst for ad hoc questions with a small set of curated dashboards for executive reporting. That’s the standard Querio is built for. For 100–500-employee B2B SaaS teams, that means governed self-serve analysis on top of the warehouse they already trust.
Querio connects directly to your warehouse with read-only access. It uses a governed semantic layer for joins, metrics, and business definitions. Then it returns inspectable SQL and Python in reactive notebooks.
FAQs
How do I know which BI tool type fits my team?
Choose based on whether your team needs stability or flexibility.
Traditional BI platforms work best for executive dashboards, compliance, and steady reporting. They make sense when standardized metrics and audit trails matter most.
AI-native tools like Querio are a better fit for ad hoc, exploratory questions. They help teams self-serve with live warehouse data, natural-language querying, and inspectable SQL/Python.
Most high-performing teams use both, tied to the same semantic layer so metrics stay consistent.
What causes metric drift in self-service BI?
Metric drift in self-service BI shows up when teams don't have a unified, governed semantic layer that keeps business logic the same across reporting tools.
When teams define metrics like revenue, churn, or customer acquisition cost in separate dashboards, BI tools, or spreadsheets - instead of using one shared source of truth - they end up with different answers to the same question. And once that happens, trust in analytics starts to slip.
How can I trust AI-generated BI answers?
Trust AI-generated BI answers by putting transparency, governance, and verification first.
Start with tools that show the SQL or Python behind every answer. Better yet, that code should be easy to inspect and edit. That gives data teams a clear way to check the logic instead of taking the output at face value.
It also helps to use a governed semantic layer so metric definitions stay consistent across the business. If “revenue,” “active users,” or “churn” mean different things in different places, AI answers can go off the rails fast.
A phased rollout is the safer path. First, compare AI outputs against dashboards your team already trusts. Once the answers line up on known reports, you can expand use across the team with a lot more confidence.