Business Intelligence
16 Best Data Analysis Tools: Features & How to Choose
Compare 16 leading data analysis tools—features, AI capabilities, pricing, and practical tips to choose the right tool for your team.
Choosing the right data analysis tool can transform how you process and act on information. Whether you're a small business or an enterprise, this guide covers 16 tools, their features, and how to pick the best one for your needs. Here's the short version:
Querio: AI-powered analytics with natural language queries and inspectable SQL/Python code.
Power BI: Affordable with AI features like Copilot for automated reporting.
Tableau: Known for visualizations, but higher pricing.
Domo: Real-time insights and automation for business decisions.
ThoughtSpot: One of the leading natural language data querying tools for quick data queries.
Databricks: Unified platform for data and AI with scalable performance.
DataRobot: Automates the machine learning lifecycle for enterprises.
Sisense: Embeds analytics directly into applications.
Polymer: Quick dashboards for small businesses without technical expertise.
Excel Copilot: AI assistance in Excel for simpler reporting and formulas.
Qlik: Focused on data quality and governance for AI workflows.
Alteryx: Automates workflows and integrates with various data sources.
Apache Spark: High-speed processing for large-scale datasets.
Python with Pandas: Flexible and free, but requires coding skills.
R with ggplot2/dplyr: Great for statistical analysis and visualizations.
Google BigQuery: Serverless cloud data warehouse for massive datasets.
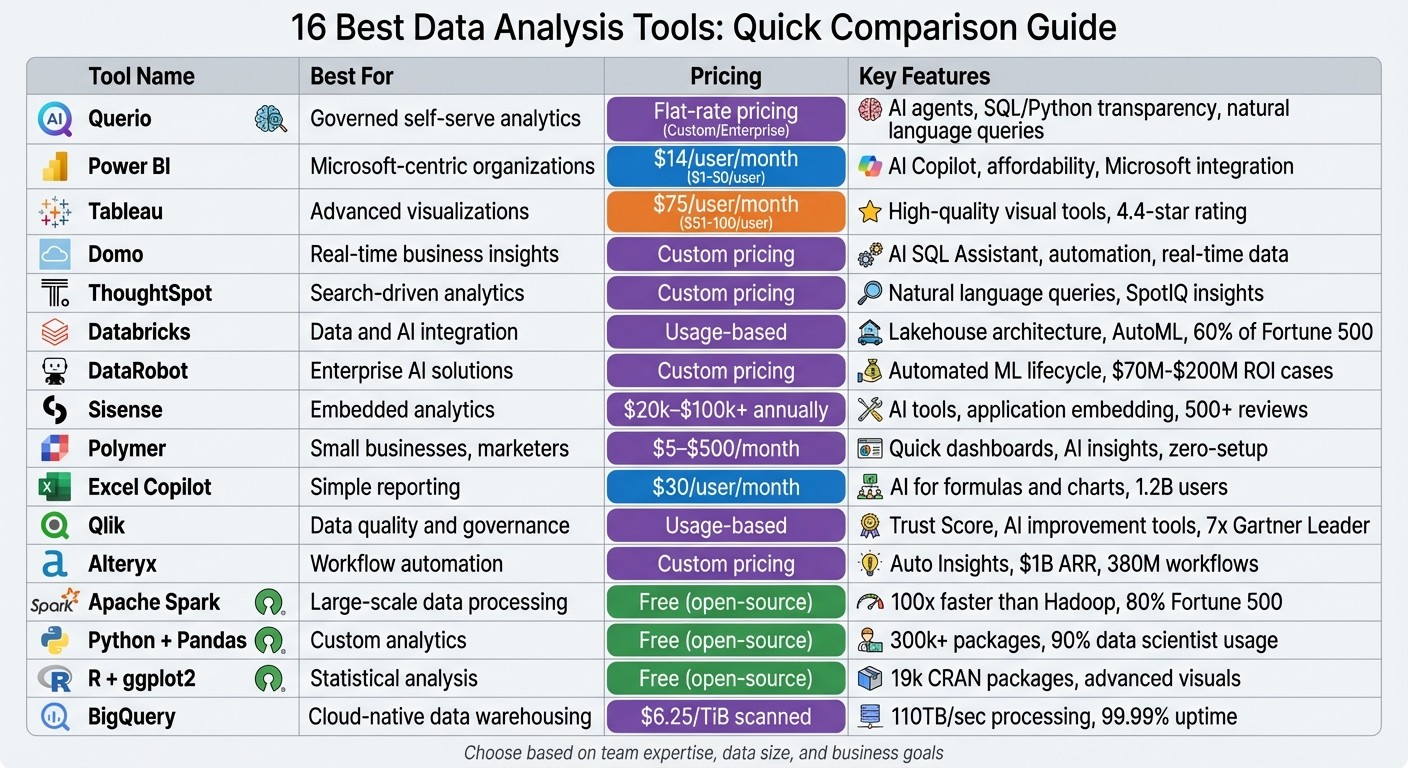
Quick Comparison
Tool | Best For | Pricing (Approx.) | Key Features |
|---|---|---|---|
Querio | Governed self-serve analytics | Flat-rate pricing | AI agents, SQL/Python transparency |
Power BI | Microsoft-centric organizations | $14/user/month | AI Copilot, affordability |
Tableau | Advanced visualizations | $75/user/month | High-quality visual tools |
Domo | Real-time business insights | Custom pricing | AI SQL Assistant, automation |
ThoughtSpot | Search-driven analytics | Custom pricing | Natural language queries |
Databricks | Data and AI integration | Usage-based | Lakehouse architecture, AutoML |
DataRobot | Enterprise AI solutions | Custom pricing | Automated ML lifecycle |
Sisense | Embedded analytics | $20k–$100k+ annually | AI tools, application embedding |
Polymer | Small businesses, marketers | $5–$500/month | Quick dashboards, AI insights |
Excel Copilot | Simple reporting | $30/user/month | AI for formulas and charts |
Qlik | Data quality and governance | Usage-based | Trust Score, AI improvement tools |
Alteryx | Workflow automation | Custom pricing | Auto Insights, workflow tools |
Apache Spark | Large-scale data processing | Free (open-source) | High-speed distributed computing |
Python + Pandas | Custom analytics | Free (open-source) | Flexible, integrates with AI tools |
R + ggplot2 | Statistical analysis | Free (open-source) | Advanced visuals, tidyverse tools |
BigQuery | Cloud-native data warehousing | $6.25/TiB scanned | Serverless, AI integration |
Key Takeaway: Match your choice to your team's expertise, data size, and business goals. Start with a trial to ensure compatibility with your workflows.
Comparison of 16 Best Data Analysis Tools: Features, Pricing, and Best Use Cases
The Best Data Analytics Tools for 2025: What to Learn Now
1. Querio
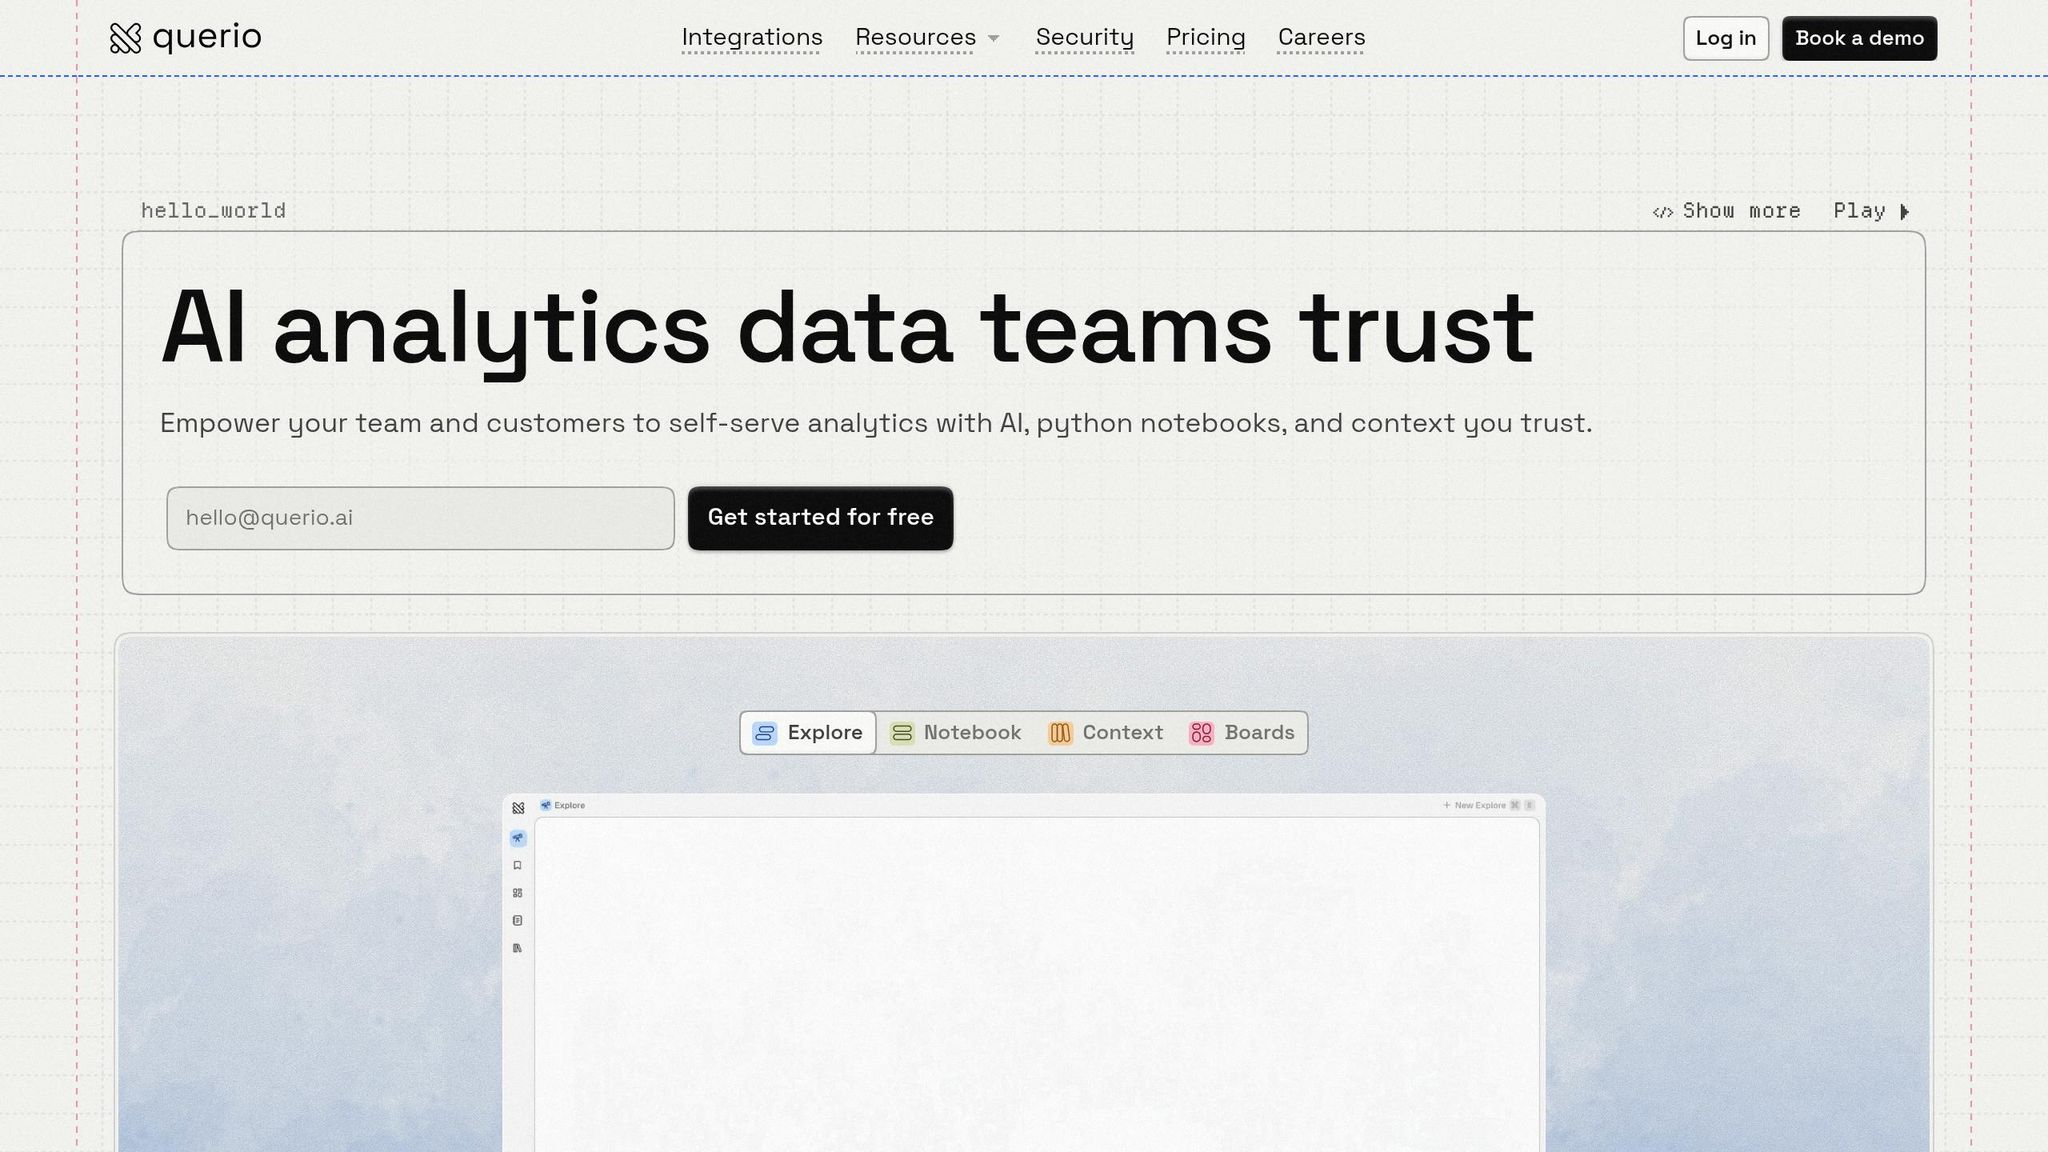
Querio is an AI-powered analytics workspace designed to connect directly to your existing data warehouse. It translates plain English questions into executable SQL and Python code, offering a transparent view of the code behind every result. This transparency ensures teams can trust their analysis while maintaining full control over data governance.
Querio stands out with its focus on automation, seamless integration, scalability, and security.
AI and Automation Features
Querio simplifies data analysis with its natural language querying engine, which handles follow-up queries effortlessly. For example, you can ask, "What were sales in Q1?" and then refine it with "What about North America?" without needing to repeat the original context. Its AI Python Agents enable detailed statistical analysis through conversational inputs, while tools like the Smart Analyzer and AI Chart Builder provide real-time insights and visualizations. Additionally, the semantic layer automation allows data teams to define business logic, metrics, and joins once, ensuring consistent application across all queries.
Data Source Integration
Querio connects to major data warehouses and relational databases through live, read-only connections. Supported platforms include Snowflake, Google BigQuery, Amazon Redshift, ClickHouse, PostgreSQL, MySQL, MariaDB, and Microsoft SQL Server. By running queries directly against your warehouse, it ensures you're always working with the most up-to-date data. This warehouse-native approach eliminates the need for fragile extract-and-load workflows often seen with traditional BI tools.
Scalability and Performance
With a flat-rate pricing model that supports unlimited users, Querio makes budgeting straightforward, even as your team expands. It guarantees a 99.9% uptime SLA and scales effortlessly with your warehouse's compute power. Whether you're running quick, ad-hoc queries or tackling complex multi-table analyses, Querio is built to handle it all.
Governance and Security
Querio prioritizes security and compliance, being SOC 2 Type II certified. It offers role-based access controls and integrates with standard SSO solutions for enterprise-level security. Its shared context layer ensures a single source of truth for metrics and business definitions, promoting consistency across dashboards, embedded analytics tools, and AI-generated answers. Every query produces inspectable, auditable code, which is especially valuable for industries requiring strict transparency and regulatory compliance. This combination of features ensures decisions made with Querio are always reliable and precise.
2. Microsoft Power BI
Microsoft Power BI is a powerful business intelligence platform that now incorporates advanced AI capabilities. It connects seamlessly to a variety of file types, databases, cloud services, and online platforms. Like other top-tier analytics tools, Power BI keeps evolving, adding features that simplify and enhance decision-making processes.
AI and Automation Features
Power BI's AI tools are redefining how teams interact with data, making analytics more accessible and actionable. Its AI-powered Copilot can generate reports from natural language prompts, create DAX formulas, and summarize data effortlessly. The standalone Copilot (currently in preview as of March 2026) allows users to search across all reports and semantic models they have access to, instead of being limited to a single open report. Other standout features like Key Influencers, Decomposition Tree, and Smart Narrative visuals help uncover metric drivers, perform root cause analysis, and provide instant data summaries that adjust based on filters.
Additionally, Power BI includes AutoML within Dataflows, enabling users to create binary prediction, classification, and regression models without needing programming expertise.
In 2024, Lumen reported saving nearly 10,000 manual hours through automation powered by Microsoft. Jerod Ridge, Director of Data Engineering, shared: "In the last year alone, we've eliminated almost 10,000 manual hours through Microsoft-powered automation. That's time we now spend creating business value."
Data Source Integration
Power BI supports three main connection modes to manage data effectively:
Import: Loads data into a cache for faster processing.
DirectQuery: Queries data sources in real time.
Direct Lake: Combines the speed of Import mode with the real-time freshness of DirectQuery, optimized for OneLake.
A new feature called Translytical Task Flows, available as of March 2026, lets users update records or add annotations directly within reports connected to Fabric SQL databases, warehouses, and lakehouses. These integration capabilities bring data from multiple vendors into one cohesive analytics environment.
Scalability and Performance
Power BI's flexibility makes it suitable for both individual users and large organizations. It offers Pro and Premium tiers, with the Premium option supporting larger data models and more frequent refreshes. In June 2025, Microsoft was ranked highest for "Ability to Execute" in the Gartner Magic Quadrant for Analytics and Business Intelligence Platforms.
Strathan Campbell, Channel Environment Technology Lead at One NZ, highlighted the platform's efficiency in 2025: "We went from a concept to a delivered product in just two weeks" using Power BI Premium's fast deployment capabilities.
Governance and Security
Power BI ensures robust governance and security, giving administrators control over AI features at the tenant level. All interactions with Copilot are logged for compliance, and data is processed within the geographic region of the Power BI tenant to meet GDPR and HIPAA standards. Features like role-based access controls and SSO integration provide enterprise-grade security. Administrators can also use the "Approved for Copilot" setting to prioritize specific semantic models in search results, ensuring users access the most relevant and reliable data.
These governance and security measures uphold data integrity and ensure that businesses can make well-informed decisions with confidence.
3. Tableau
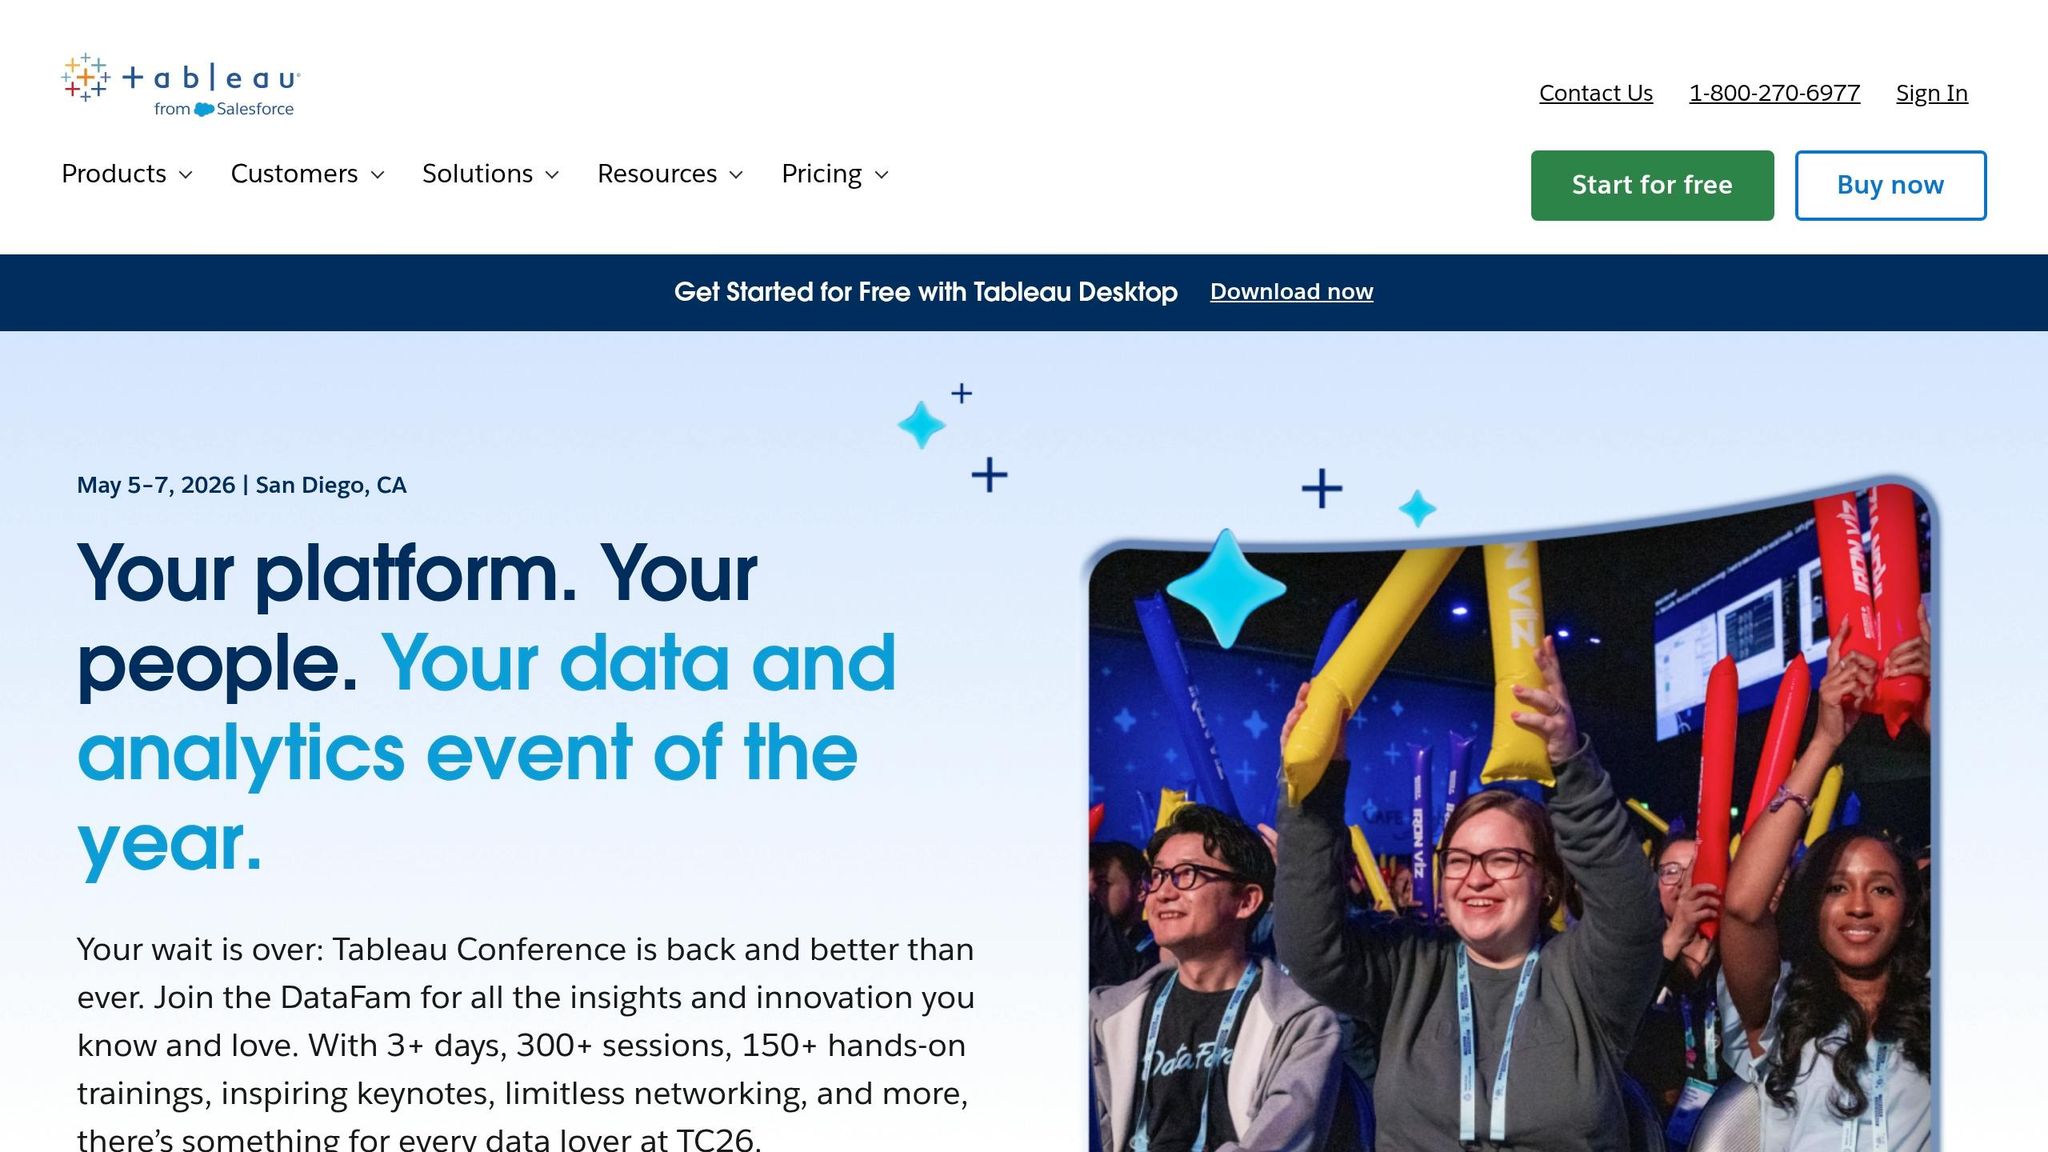
Tableau stands out as one of the best AI self-service analytics platforms, now equipped with AI-driven analytics. It connects seamlessly to various data sources and offers flexible deployment options, whether through cloud-hosted solutions or on-premise setups. The platform continues to evolve, making data analysis approachable for users with varying levels of expertise.
AI and Automation Features
Tableau's AI tools simplify and enhance how AI insight generation works. The Concierge feature pinpoints root causes and suggests visualizations, while the Inspector monitors KPIs, alerting users to trend shifts or threshold breaches [6]. A beta feature, Data Pro, can automatically create semantic models from workspaces, cutting down on manual setup time for analysts [5].
Another beta tool, Data Interpreter, streamlines Excel file preparation by automatically managing merged headers and empty columns [5]. On mobile, the Analyze with AI tool allows users to ask custom questions, while Tableau Prep and Dashboard Summaries (Beta) make data cleaning and metric explanations more efficient [5].
Data Source Integration
Tableau excels in integrating data from diverse sources, offering deployment options tailored to organizational needs. Users can opt for Tableau Cloud for a fully hosted experience, Tableau Server for self-hosted solutions, or desktop applications for offline work. The Looker Connector enhances functionality by providing access to governed data in Google Looker without requiring manual exports, ensuring consistent application of business rules [5]. Additionally, Tableau handles large-scale datasets with ease, supporting enterprise deployments that process hundreds of millions of rows [7]. This comprehensive integration framework ensures secure and consistent data management.
Governance and Security
Tableau places a strong emphasis on governance and security. The Einstein Trust Layer ensures that generative AI features operate within strict guardrails, safeguarding data privacy. The Metrics Layer centralizes KPI definitions, promoting consistency across the organization. For added security, External Key Management (EKM) allows Tableau Cloud users to encrypt data extracts using their own AWS encryption keys [5]. The platform also supports Single Sign-On (SSO) integration and offers REST APIs for managing users and publishing content. These features underline Tableau's dedication to providing secure, actionable insights that drive informed decision-making.
4. Domo
Domo is a cloud-based business intelligence platform designed to deliver real-time data insights and automation powered by AI. It transforms how businesses interact with data, enabling quicker and more informed decision-making. This section highlights Domo's unique approach to providing real-time analytics.
AI and Automation Features
Domo's AI-driven tools simplify data analysis. For example, the AI SQL Assistant translates plain language into accurate queries, while the Beast Mode Assistant helps users create calculated fields with straightforward prompts. These features eliminate the need for SQL expertise and reduce the time spent on manual formula creation.
Domo also offers tools like Agent Catalyst and workflow automation, which shift organizations from reactive reporting to proactive decision-making. A standout feature, FileSets, enables AI agents to process unstructured data - such as images, documents, or transcripts - and turn it into actionable insights. For instance, Cozy Earth, a bedding company, achieved a 12% revenue boost and saved $250,000 annually on shipping costs by leveraging Domo’s real-time data capabilities. Tanner Lamb, CFO of Cozy Earth, shared:
"Domo is the single thing that helps us make proper decisions day to day… We're very fortunate to have a tool we can look at every day to get the data we need to make decisions."[8]
Data Source Integration
Domo excels in integrating with various data systems. With over 1,000 pre-built ETL connectors, it allows businesses to connect with a wide range of data sources. Its Magic ETL feature provides a drag-and-drop interface, making data transformation straightforward - even for those without SQL knowledge. This extensive connector library ensures businesses can consolidate data from multiple platforms into a single, unified analytics environment.
Governance and Security
Domo prioritizes data security and governance. Features like Bring Your Own Key (BYOK) encryption give organizations control over their encryption keys. Additionally, the platform offers granular row-and-column-level permissions, ensuring users can only access data relevant to their roles. Tools like DomoGPT maintain strict data privacy while delivering AI-powered functionalities[8].
5. ThoughtSpot
ThoughtSpot is a search-first analytics platform designed to support quick, data-driven decisions. By allowing users to perform natural language queries, it makes analytics more accessible. The platform queries cloud data warehouses in real time without duplicating data, helping to simplify infrastructure and keep analytics costs manageable.
AI and Automation Features
One of ThoughtSpot's standout features is SpotIQ, an AI-driven tool that continuously monitors data for patterns, highlights anomalies, and alerts users to insights they might otherwise overlook. As InsightSeeker from Capterra shared:
"SpotIQ is the standout feature for us. It automatically surfaces insights and anomalies that we would have missed manually. It's like having an extra analyst on the team." [10]
The platform's search-first interface is another game-changer. Users can type questions in plain English and instantly receive visualizations, which speeds up decision-making and eliminates the need for complex SQL knowledge. This proactive approach to insights is paired with a strong data integration framework, making it a powerful tool for business users.
Data Source Integration
ThoughtSpot employs a "zero-copy" live query system, connecting directly to cloud data warehouses like Snowflake, Databricks, and Amazon Redshift. This setup ensures data stays in its original location, avoiding duplication and reducing storage expenses. The platform also integrates with popular SaaS tools like Salesforce, HubSpot, Zendesk, Shopify, and Microsoft Dynamics 365 through dedicated connectors [9]. Additionally, it works well with data transformation tools such as dbt and Fivetran, ensuring smooth integration into modern workflows [10].
Governance and Security
ThoughtSpot prioritizes security and compliance, holding certifications like SOC 1, SOC 2, SOC 3, ISO 27001, HIPAA, GDPR, and CCPA. It uses row-level security (RLS) and other access controls to restrict data access based on user roles, ensuring employees only see information relevant to their jobs. Other security measures include advanced encryption, data isolation, and support for multi-tenant organizations. For authentication, the platform supports SSO via SAML, OAuth, and OIDC, as well as VPN and VPC deployment options. Despite its robust security measures, ThoughtSpot delivers lightning-fast query response times, even when working with billions of rows, combining performance with protection [10].
6. Databricks
Databricks is a unified platform designed for data and AI, built on an open "Lakehouse" architecture. It's trusted by 60% of Fortune 500 companies and more than 20,000 customers worldwide [12].
AI and Automation Features
Databricks offers tools to simplify and accelerate AI and business intelligence tasks. AI/BI Genie allows users to ask plain-language questions and instantly create dashboards with over 20 chart types [13][16]. Mosaic AI helps build production-ready agents using proprietary data, while AutoML automates the process of model tuning and selection [14][16].
Companies like Anker Innovations have seen impressive results after adopting Databricks. By moving their BI stack to the platform, they sped up query performance by 94% and cut their time to insight from 30 minutes to just 2 minutes [15]. Similarly, The AA used Databricks' conversational analytics within Microsoft Teams, reducing their teams' time to insights by about 70% [15].
Data Source Integration
Databricks simplifies data integration with various features. Lakeflow automates the ingestion, transformation, and orchestration of both batch and streaming data [12]. Auto Loader supports incremental data loading from cloud storage services like Amazon S3 and Azure Data Lake, complete with schema inference [18]. Additionally, Partner Connect makes it easy to integrate third-party tools with Databricks clusters and SQL warehouses [17].
Scalability and Performance
Databricks is built for high performance and scale. The Photon Engine, a vectorized query engine, delivers significant speed improvements - 40% faster for exploratory tasks and 20% faster for BI workloads [19]. Liquid Clustering dynamically adjusts data layouts, while AI Functions provide up to 85x speed boosts, and spatial SQL runs 17x faster [19].
The platform's serverless architecture ensures instant compute availability with minimal startup delays. It also automates infrastructure management and scaling. Predictive Optimization uses AI to handle tasks like file compaction based on query patterns, removing the need for manual intervention. Additionally, default Zstandard compression for Unity Catalog Managed Tables can save up to 40% on storage costs [19]. All these enhancements integrate seamlessly with Databricks' governance features.
Governance and Security
Databricks' Unity Catalog provides fine-grained access control and lineage tracking for data, machine learning models, and files across multiple clouds. It uses AI to enforce consistent business definitions, ensuring data governance is both robust and efficient [11][12]. The platform's pay-as-you-go pricing model bases costs on compute usage, offering flexibility for businesses [11][14].
7. DataRobot
DataRobot is an enterprise AI platform designed to automate the entire machine learning lifecycle, from preparing data to deploying and monitoring models. It has consistently been recognized as a leader in the Gartner Magic Quadrant for DSML Platforms and has earned the title of "Customers' Choice" from Gartner [21].
AI and Automation Features
DataRobot simplifies traditionally time-consuming data science tasks through features like data healing, automated deduplication, and synthetic data generation. These tools address challenges such as missing values and unbalanced datasets. The platform assesses a wide range of model variations, including time series approaches like lag adjustments, differencing, and cold start forecasting, to find the best-fit solution. Additionally, its Agent Workforce Platform enables enterprises to create and deploy AI agents using customizable blueprints and prebuilt integrations.
"We've automated the stuff that data scientists didn't really like doing so they can focus on what really drives change. AI/ML has been critical in terms of the efficiency we've achieved by allowing us to scale massively." – Aravind Jagannathan, Chief Data Officer, Freddie Mac [20]
Real-world success stories highlight the platform's impact. For instance, a top 5 global bank achieved a $70 million ROI by applying DataRobot to over 40 AI use cases, ranging from capital markets to wealth management [21]. Similarly, a global energy company reported a $200 million ROI from more than 600 AI use cases, including well performance analysis and stuck pipe detection [21].
Data Source Integration
DataRobot supports integration with various data platforms, offering flexibility and efficiency. Venkatesh Sekar, Enterprise Architect at NetAPP, shared how the platform unified data from Snowflake, SQL, and S3, enabling faster and more streamlined forecasting [21]. Whether deployed on-premise, in virtual private clouds, or as a SaaS solution, DataRobot ensures smooth integration, making it adaptable for complex and demanding environments.
Scalability and Performance
Developed in collaboration with NVIDIA and validated by the NVIDIA Enterprise AI Factory, DataRobot is built to handle the demands of production-grade AI. Its monitoring and orchestration capabilities help teams balance accuracy, latency, and cost, ensuring high performance even in challenging scenarios.
"DataRobot helps us deploy AI solutions to market in half the time we used to do it before and easily manage the entire AI journey." – Tom Thomas, Vice President of Data Strategy, Analytics & Business Intelligence, FordDirect [22]
Governance and Security
DataRobot emphasizes centralized governance, offering tools to manage predictive models, generative AI, and autonomous agents. It ensures compliance with global regulations like the EU AI Act, NIST AI RMF, NYC Law No. 144, and California Law AB-2013. The platform also provides real-time defenses against risks such as PII leakage, prompt injection, toxicity, bias, and hallucinations. It captures audit-ready evidence throughout the AI lifecycle and offers one-click documentation for compliance reporting. Before deployment, organizations can test models using synthetic or custom datasets to uncover vulnerabilities. DataRobot also offers a "Try for free" option for its Predictive AI and AI Platform suites, while enterprise pricing is tailored to individual needs.
8. Sisense
Sisense blends business intelligence with AI-driven tools to deliver insights directly within applications. With over 500 five-star reviews for its embedded analytics capabilities [23], the platform also supports more than 400 data connectors [24].
AI and Automation Features
Sisense's Intelligence Suite organizes its AI tools into three categories: Generative, Analytical, and Natural Language Query. Here's what each offers:
Generative AI: Includes an AI Assistant for building dashboards and visualizations through conversational prompts, and AI Narratives that create plain-language summaries of charts to highlight trends.
Analytical AI: Features automated forecasting powered by machine learning and "Explanations" that uncover the root causes behind data changes.
Natural Language Query: Allows users to interact with data using simple, conversational queries through the "Simply Ask" feature.
The platform also supports the Model Context Protocol (MCP), enabling external AI tools like ChatGPT or Claude to securely access governed Sisense data models for advanced analytical workflows.
"The exciting thing about Sisense Intelligence is the ease of use. It is already easy to create widgets and dashboards. It could shorten that lead time further and empower regular users. True self-service." - Hamza Jap Tjong, Head of Data & AI, Gerimedica [25]
"With Sisense's AI capabilities, we are able to easily translate complex data, streamline interpretation (identifying gaps and trends in the data), and identify key impacts with speed that is changing the way we can react... during clinical trials." - Tanya du Plessis, Chief Data Strategist, Bioforum [23][25]
These AI tools integrate seamlessly into Sisense’s broader analytics ecosystem.
Data Source Integration
Sisense automates data modeling, storage, and querying, making it easier to transform raw data into actionable insights. The platform's Compose SDK allows developers to embed AI-powered analytics into existing applications using reusable components.
USA Swimming: Delivered insights 20× faster to 400,000 users [27].
Funraise: Saved 40 work hours per week while increasing fundraising by 7× and improving donor retention by 12% [27].
"We went from custom application development to the ability to rapidly change something on the dashboard and then publish it again in real-time within the production environment - without compromising security." - Devin Vyain, Senior Solutions Architect, Barrios [23]
Governance and Security
Sisense offers a centralized data hub with a semantic layer that ensures consistent and governed data exploration. Key security features include Single Sign-On (SSO) and the ability for developers to publish real-time updates without compromising safety [23][28]. Sisense also holds SOC 2 Type II, ISO 27001, and ISO 27701 certifications [24].
Pricing varies from $20,000 to over $100,000, depending on business needs. Deployment options include cloud, on-premises, and hybrid models [26].
9. Polymer
Polymer stands out in the world of data analysis tools by offering a straightforward way for teams to gain insights quickly without a steep learning curve. This platform transforms spreadsheets and other data sources into interactive dashboards almost instantly, making it an excellent choice for marketing teams, agencies, and small businesses that need quick, actionable insights without relying on technical expertise.
AI and Automation Features
Polymer's AI-driven tools make data analysis approachable. The Auto-Insights feature scans uploaded datasets to uncover trends, patterns, and anomalies right away. Meanwhile, the PolyAI Chat allows users to ask plain-English questions like "What was the top region?" and receive instant, visual answers[31]. Another helpful feature is its ability to generate one-click text summaries for charts, simplifying complex visualizations for non-technical users[30].
"The moment you upload a dataset, Polymer analyzes it and builds an auto-structured dashboard. This is a game-changer for marketers who usually have to ping the data team." - DataOps_Pro, Product Hunt[31]
Users have reported significant time savings with Polymer. One marketing agency noted it reduced their client reporting time by threefold[29], while another user highlighted a 40% reduction in time spent on manual Excel tasks[33].
Data Source Integration
Polymer makes data integration seamless with a variety of native connectors. It supports over 20 data sources, including Shopify, Google Analytics 4, Facebook Ads, Google Ads, Jira, Linear, Airtable, and Zendesk. For more advanced needs, the platform offers API-based integrations with tools like Snowflake and Google BigQuery[31]. Users can also upload data manually in formats like CSV, XLS, and JSON[32].
The syncing capabilities depend on the pricing plan. For example, the Basic plan ($5/month) requires manual updates, while Enterprise plans (starting at $500/month) offer real-time syncing and full REST API access[31].
Scalability and Performance
Polymer is designed to handle small to mid-sized datasets efficiently. It performs well with datasets containing up to 20,000 rows but may experience slower performance with datasets exceeding 100,000 rows[31]. Within these limits, businesses have reported notable improvements. For instance, one CRM tool saw a 23% increase in client retention rates, and a workforce management tool reported a 36% boost in average client lifetime value after using Polymer's analytics features[29].
Governance and Security
Polymer ensures secure data access through role-based permissions, offering Creator, Editor, and Read-only roles[32]. For Enterprise users, permissions can also be automated via API, enhancing security and efficiency[31]. Additionally, the platform supports white-labeling, allowing businesses to personalize dashboards with their own fonts, colors, and logos for a professional, branded look[29].
With a consensus rating of 8.35/10 based on 50 verified reviews as of March 2026, Polymer has earned praise for its "zero-setup" visualization capabilities. However, users note that careful data preparation is essential for optimal results[31].
10. Excel Copilot
Excel Copilot brings AI-powered assistance to Excel, the world's most widely used data analysis tool, serving over 1.2 billion users globally. It simplifies daily tasks for office workers, who typically spend more than an hour in Excel each day, and offers significant time savings for finance, operations, and analytics professionals who dedicate 12–15 hours weekly to spreadsheets [1][34].
AI and Automation Features
With natural language interaction, Excel Copilot allows users to ask questions in plain English, instantly generating visualizations and summaries - no formulas required [34][1]. When formulas are necessary, Copilot translates conversational queries into advanced Excel syntax like XLOOKUP, SUMIF, or nested IF statements, and even provides step-by-step explanations [34]. This feature targets a common frustration: time-consuming manual data entry and formula debugging, which can account for up to 10% of work hours and involve over 1,000 copy-paste actions per week [34].
The tool also automates the creation of PivotTables and charts, eliminating the need for manual updates and refreshing [34]. Its insight identification feature flags trends and outliers directly in the Excel sidebar, enabling users to focus more on decision-making instead of getting bogged down in spreadsheet mechanics [34][35]. For large datasets nearing Excel's 1-million-row limit, pairing Copilot with Power Pivot ensures smoother performance [1].
In addition to simplifying formulas and charts, Copilot expands Excel's capabilities with improved data connectivity and integration.
Data Source Integration
Copilot supports a variety of data sources, including web data, files stored in SharePoint or OneDrive (Word, Excel, PowerPoint, and PDF formats), and internal organizational data like emails and meeting notes. To function properly, data must be formatted as an Excel Table or a compatible range. The tool also integrates Python within Excel, enabling advanced calculations and visualizations. Microsoft recently replaced "App Skills" with "Agent Mode" for workbook manipulation and introduced "Analyst" for more in-depth data analysis as of February 2026.
These integration features enhance Copilot's ability to handle diverse data workloads.
Scalability and Performance
Excel Copilot works best with moderate-sized datasets, staying within Excel's inherent row constraints. It performs well with tasks like formula generation and PivotTable creation but may struggle with highly complex analytics [37]. Additionally, it cannot access data from other Microsoft products like Power BI models, which limits its use for large-scale enterprise analytics involving billions of rows. For such needs, specialized BI platforms are better suited [1][37].
Governance and Security
As part of the Microsoft 365 ecosystem, Excel Copilot offers enterprise-level security, including organizational permissions and "Restricted Search" settings for internal data [35][36]. Pricing typically includes a Microsoft 365 subscription ($10–$20 per user, per month) along with a Copilot add-on license, bringing the total to about $30 per user monthly [1][37]. While the standalone desktop version of Excel costs around $160 as a one-time purchase, most Copilot features are only available through the subscription model [1].
11. Qlik
Qlik is a platform focused on data quality and analytics, tailored for the demands of the AI era. It operates on the principle that reliable AI outputs are only possible with dependable data. The company has been recognized as a Leader in the 2026 Gartner Magic Quadrant for Augmented Data Quality Solutions for the seventh consecutive time, underlining its expertise in this area[38].
AI and Automation Features
One of Qlik's standout tools is the Trust Score, which evaluates data quality and lineage to determine if it’s ready for AI use. This feature helps prevent unreliable AI outputs caused by poor-quality data. This is especially important as Gartner predicts that by 2027, 70% of organizations will implement modern data quality solutions to support their AI strategies[38].
The platform also incorporates Retrieval-Augmented Generation (RAG), which shifts the focus from reactive fixes to continuous AI improvement. As Matt Hayes, General Manager of Qlik's Data Business Unit, put it:
"We're entering an era where AI does more than recommend, it initiates and acts, often across systems and workflows"[38].
Qlik’s metadata-driven approach adds transparency to complex AI workflows, making it easier to track data lineage and troubleshoot issues.
Scalability and Performance
Qlik offers a usage-based cloud pricing model, which adjusts costs based on actual data volumes. Additionally, its FinOps visibility tools keep teams informed about resource usage and associated costs, making expense management straightforward as operations scale.
Governance and Security
By focusing on data quality and lineage, Qlik ensures that its platform meets governance requirements for AI at scale. Features like continuous monitoring of data trust levels and detailed metadata tracking help maintain compliance and ensure that AI models are built on reliable, domain-specific data.
12. Alteryx
Alteryx One brings together data preparation, AI automation, and business intelligence into a single platform. By 2025, the company achieved over $1 billion in annual recurring revenue, with customers completing more than 380 million automated workflows - up from 260 million in 2023 [40].
AI and Automation Features
Alteryx addresses the growing needs of business intelligence for startups with best AI business intelligence tools and automation capabilities that simplify complex data tasks. The platform's Annie AI Agent acts as a conversational assistant, providing real-time support for analytics queries. Magic Reports transform raw data into clear visual stories, highlighting trends and anomalies, while Auto Insights Playbooks identify valuable use cases from existing data and generate reports in minutes.
For instance:
Bank of America revolutionized its regulatory testing process, reducing development time from 1,700 hours to just 1 hour - a 99.94% time savings.
Nielsen automated 2,000 previously manual processes.
McLaren Racing leverages real-time analysis of billions of data points to optimize car design and race strategies [39].
Data Source Integration
Alteryx supports seamless integration with a wide range of data sources, offering over 100 native connectors to cloud platforms like Snowflake, Databricks, Amazon S3, and Google BigQuery, as well as SaaS tools like Salesforce, Adobe Analytics, and ServiceNow. Its Data Connection Manager centralizes credential management, while In-Database processing enhances speed by performing analytics directly within data warehouses. The platform accommodates structured databases, semi-structured formats (e.g., JSON, XML), and big data formats like Avro and Parquet [41]. These features enable teams to extract actionable insights efficiently.
Governance and Security
In addition to its automation and integration capabilities, Alteryx prioritizes secure and well-governed workflows. Its workflows create a governed logic layer, ensuring that AI outputs are transparent and reproducible. CEO Andy MacMillan emphasized the importance of this:
"AI requires a governed and repeatable logic layer. Without that foundation, organizations don't just move faster - they scale risk faster than productivity" [40].
The platform includes features like role-based access controls, version control, detailed run-level logs, and automated policy enforcement through SSO/SCIM. It also integrates with tools like Collibra and Atlan to maintain data lineage and business context [39].
13. Apache Spark
Apache Spark stands out as a powerful tool for handling massive datasets with impressive speed and flexibility. This open-source distributed computing framework, released under Apache License 2.0, has become a staple in big data analytics. In fact, 80% of Fortune 500 companies utilize Spark for their data processing needs [42].
Scalability and Performance
Spark's ability to process data in-memory allows it to operate up to 100 times faster than Hadoop MapReduce [4]. At the core of its efficiency are Resilient Distributed Datasets (RDDs), which ensure fault tolerance by tracking the lineage of operations. If a node fails, Spark can reconstruct the lost data by replaying the steps that created it [43].
The framework's Adaptive Query Execution (AQE) further boosts performance by dynamically optimizing execution plans. By leveraging Directed Acyclic Graph (DAG) principles, AQE reduces unnecessary data movement across clusters, speeding up TPC-DS queries by as much as 8x without manual intervention [42][43].
Beyond its speed and resilience, Spark is a key player in powering advanced AI workflows.
AI and Automation Features
Spark comes equipped with MLlib, a library for traditional machine learning algorithms like Random Forest and Gradient Boosted Trees. For distributed deep learning tasks, tools like the TorchDistributor API and predict_batch_udf API simplify the process of training and running models - such as PyTorch and Hugging Face transformers - across clusters without requiring complex configurations [42][44].
With the release of Spark 4.0, a new DataFrame.plot() API was introduced, enabling exploratory visualizations directly on distributed datasets without the need for downsampling or local data collection. This version also brought 20% to 50% faster performance for machine learning and ETL tasks, thanks to various optimizations. Additionally, the RocksDB state store significantly reduces JVM heap usage - by 40% - for streaming jobs, improving stability [44].
Spark’s AI and automation capabilities are further strengthened by its seamless integration with diverse data sources.
Data Source Integration
Spark connects effortlessly with systems like HDFS, Amazon S3, Apache Cassandra, Apache Hive, Apache Kafka, and numerous JDBC-compliant databases [43][4]. It supports multiple programming languages, including Python, SQL, Scala, Java, and R [42]. The Spark Connect architecture, introduced in version 3.4, enhances flexibility by enabling lightweight clients - just 1.5 MB for Python - to remotely interact with Spark clusters without running a full Spark driver locally [44].
Governance and Security
Security is a priority for Spark, which supports Kerberos authentication for secure interactions with Hadoop services and employs SSL/TLS encryption for RPC connections [45]. Access Control Lists (ACLs) manage permissions for the Web UI, distinguishing between viewing and modifying capabilities. For enterprise deployments, features like Role-Based Access Control (RBAC) and audit logs help meet compliance standards such as HIPAA and FedRAMP [46]. However, these security features require proper configuration for production use [45].
14. Python with Pandas
Python paired with Pandas has become a cornerstone of data science workflows. Its strength lies in acting as the "glue" that connects data collection with machine learning workflows [48]. As James Bednar, Director of Custom Solutions at Anaconda, explains:
"Python succeeds at DS, ML, and AI workflows because it also supports all the tasks that are not DS, ML, or AI" [48].
With over 300,000 packages in the Python ecosystem, it’s no surprise that Python is the preferred choice for building custom analytics solutions [1].
Data Source Integration
Pandas makes importing data a breeze. It natively supports formats like CSV, Excel, JSON, SQL databases, and Parquet files, enabling users to easily load diverse datasets into in-memory DataFrames [7][1]. Its seamless integration with SQL databases further enhances its utility. This versatility is a key reason why, according to a 2022 Kaggle survey, over 90% of data scientists reported using Python, compared to less than 30% for R [48].
Scalability and Performance
Pandas is optimized to handle millions of rows efficiently thanks to its use of C and Fortran under the hood. However, its in-memory design means that its performance is tied to the amount of available RAM [47][48]. For datasets larger than 10 million rows or when memory becomes a constraint, teams often switch to tools like Polars for multi-core processing or Apache Spark for distributed computing [47]. For instance, tests with a dataset of 12.9 million car sales records highlighted the limits of in-memory processing, emphasizing the need for scalable alternatives in such cases [50]. This performance capability also complements Python's compatibility with cutting-edge AI libraries.
AI and Automation Features
Python is the leading language for AI, and Pandas integrates seamlessly with libraries like Scikit-learn, TensorFlow, and PyTorch for predictive analytics [1]. Modern tools have also evolved to inspect data schemas and auto-generate Pandas code for complex operations, transforming basic copilots into full-fledged workflow assistants [1]. This capability allows users to automate repetitive data cleaning tasks and streamline report generation. In production settings, Pandas shines by integrating effortlessly with backend systems and cloud platforms, supporting smooth and efficient data workflows [48].
Governance and Security
The Pandas project is managed under the 501(c)3 NumFOCUS Foundation, ensuring neutral and transparent governance [51]. For enterprise use, tools like Pandera and Pydantic help enforce data schemas, keeping production pipelines stable even when data inconsistencies arise [49]. Additionally, Conda is often used to lock package versions, ensuring reproducibility and maintaining secure dependencies [49].
15. R with ggplot2/dplyr
R's tidyverse ecosystem, led by ggplot2 and dplyr, is a powerhouse for creating high-quality visualizations and performing advanced statistical analysis. With access to over 19,000 CRAN packages, it has an editor's rating of 4.7/5 [1][52].
Data Source Integration
R offers seamless connectivity to a wide range of data sources through its specialized packages. For relationships in relational databases like MySQL, PostgreSQL, and SQLite, the DBI package ensures smooth management with secure encrypted authentication [56]. Cloud-based tools are also covered - googlesheets4 works with Google Sheets, while httr and rvest handle API connections and web scraping [55].
Handling large datasets is another strength. When data surpasses available RAM, dplyr utilizes dbplyr to convert code into SQL for remote databases. Alternatively, the arrow package integrates with Apache Arrow for handling massive datasets [54][55]. For even larger-scale processing, sparklyr facilitates data manipulation on Apache Spark using familiar dplyr syntax [54][56].
These features make R a versatile and scalable choice for complex data tasks.
Scalability and Performance
While R traditionally operates in-memory, its tools are designed to scale effectively. The data.table package, for example, processes millions of rows with parallelized, memory-efficient operations [56]. For enterprise-level needs, duckplyr supports zero-copy data translation, significantly enhancing performance for datasets that exceed local memory [54]. A 2025 update to lazy evaluation in ggplot2 now allows it to render only visible components, making it capable of handling massive geospatial datasets efficiently [57].
"GGplot2 completely changed how I visualize data. The simplicity and power of geoms make it my go-to tool for research graphics." - Dr. Ayesha Khan, Data Scientist [52]
AI and Automation Features
R also excels in machine learning and automation. Packages like caret provide a unified framework for modeling, while randomForest and xgboost are popular for gradient boosting [56]. AI tools now allow users to generate ggplot2 and dplyr code directly from plain language instructions [57]. Additionally, tools like R Markdown and knitr make reproducible research easy by combining code, narrative, and results into dynamic reports in formats like PDF, HTML, or Word [56].
Governance and Security
Both ggplot2 and dplyr are open-source tools under the MIT license, ensuring transparency and community-driven development [53][52]. For enterprise use, Posit (formerly RStudio) offers secure environments for deploying and sharing workflows, with RStudio Server Pro priced at around $10,000+ per year [1]. The DBI package further strengthens security by enabling safe database integration in production environments [56].
16. Google BigQuery
Google BigQuery is a serverless cloud data warehouse capable of processing over 110 terabytes of data per second on Google's infrastructure [63]. Its architecture separates storage from compute, allowing both to scale independently and automatically [61][63]. This design enables teams to query massive datasets - terabytes in seconds and petabytes in minutes - while maintaining a 99.99% uptime SLA [60].
Data Source Integration
BigQuery connects seamlessly to a variety of data sources. These include Google Cloud services like Cloud Storage and Spanner, SaaS platforms such as Salesforce and Google Analytics 4, and external cloud providers through BigQuery Omni, which supports AWS S3 and Azure Blob Storage [61][63]. The BigQuery Data Transfer Service simplifies moving bulk data from SaaS apps, while Datastream enables real-time Change Data Capture (CDC) from databases including Oracle and MySQL [60][64]. Federated queries let users analyze data in external sources without copying it, and the free BigQuery Migration Service helps migrate from legacy warehouses like Netezza, Redshift, and Teradata [60][61].
In 2025, a financial services company transitioned 15 TB of data from Oracle to BigQuery in just four months. By running parallel systems for six weeks and training 25 analysts, they achieved 85% faster query performance and cut costs by 60% compared to their prior Oracle setup [63].
This extensive connectivity is key to BigQuery's scalability and efficiency.
Scalability and Performance
BigQuery's columnar storage format optimizes queries by scanning only the columns required, minimizing I/O [63]. The built-in BI Engine delivers sub-second response times for interactive dashboards [61][63]. Features like partitioning and clustering can reduce the amount of data scanned by 40–80%, directly lowering costs. For on-demand pricing, rates start at $6.25 per TiB scanned, with the first 1 TiB free each month [60][63]. In TPC-DS benchmarks, BigQuery achieved a 20.2-second geometric mean query time on 10TB datasets [63].
AI and Automation Features
BigQuery integrates Gemini AI, which can generate SQL and Python code from natural language prompts, with acceptance rates exceeding 60% [59]. Between July 2024 and April 2025, usage of this AI-powered code assistance surged by 350% [59]. Additionally, BigQuery ML allows users to build machine learning models - such as linear regression, k-means clustering, and time-series forecasting - using simple SQL commands [60][61]. AI agents within the platform handle tasks like pipeline automation, end-to-end ML workflows, and conversational analytics [58][60].
"BigQuery and Vertex AI bring all our data and AI together into a single platform. This has transformed how we take action on customer feedback from a lengthy manual process, to a simple natural language query in seconds, allowing us to get to customer insights in minutes instead of months." - TJ Allard, Lead Data Scientist, Mattel [59][60]
These AI tools enhance BigQuery's capabilities, making it a powerful tool for data-driven decision-making.
Governance and Security
BigQuery is built with robust security and governance features. It uses AES-256 encryption for data at rest and offers fine-grained access control through IAM and VPC Service Controls [63]. The platform incorporates Dataplex Universal Catalog, which automates data profiling, tracks lineage, and provides a business glossary to ensure data quality and compliance [59][61]. For reliability, BigQuery supports managed failover and near-real-time data replication to secondary regions [59][62]. By 2024, customer data stored in BigQuery grew by nearly 30%, reaching multiple exabytes [59].
Strengths and Weaknesses
When evaluating business intelligence (BI) and data analytics tools, it's clear that each platform comes with its own mix of ease of use, technical complexity, and pricing. For instance, Microsoft Power BI stands out for its affordability at $14 per user/month [67], making it a solid choice for teams already embedded in the Microsoft ecosystem. However, mastering its DAX formula language can be a steep learning curve. On the other hand, Tableau is known for delivering top-tier visualizations (earning a 4.4-star rating on Gartner Peer Insights [67]), but its $75 per user/month price tag might make it less feasible for larger teams.
Open-source tools like Python and Apache Spark bring unmatched flexibility without licensing fees. Python, used by 86% of developers for data analysis in 2026, offers incredible versatility, while Apache Spark, trusted by 80% of Fortune 500 companies for large-scale data processing, excels in handling massive datasets [67]. However, both demand significant technical expertise to unlock their full potential.
AI capabilities vary significantly across platforms. Some tools offer AI copilots to assist with tasks like generating formulas, while others provide end-to-end automation for entire workflows [37]. Traditional BI tools often rely on a sequential publish-and-review process, which can hinder real-time collaboration [65].
Governance and transparency have become essential features. Many leading platforms now emphasize "inspectable" code, such as SQL or Python, allowing users to review and validate AI-generated insights. This approach not only fosters trust but also speeds up decision-making by ensuring insights are both reliable and auditable [66].
Here’s a quick comparison of the strengths, weaknesses, and best use cases for each tool:
Tool | Primary Strength | Key Weakness | Best For |
|---|---|---|---|
Querio | AI agents with inspectable SQL/Python | Newer platform with a growing ecosystem | Teams needing governed self-serve analytics |
Power BI | Cost-effective; integrates with Microsoft | Steep DAX learning curve | Microsoft-centric organizations |
Tableau | High-quality visualizations | High per-user licensing cost | Users with advanced visualization needs |
Python | Limitless flexibility; free to use | Requires advanced coding skills | Data science teams |
Apache Spark | Processes data up to 100x faster than Hadoop | Complex setup and maintenance | Large-scale data processing |
Google BigQuery | Serverless scalability | Costs rise with larger data scans | Cloud-native data warehousing |
Excel Copilot | Familiar interface with AI assistance | Prone to manual errors at scale | Simple reporting and ad-hoc analysis |
Conclusion
Picking the right data analysis tool boils down to three main considerations: your team’s technical expertise, the size and complexity of your data, and the governance requirements of your organization. These aspects not only influence the tool's functionality but also its adoption and long-term reliability. For smaller teams with straightforward reporting needs, familiar and budget-friendly tools are often the best choice. Mid-sized companies aiming to empower business users might lean toward search-driven platforms like ThoughtSpot, while large enterprises managing massive datasets can benefit from the scalability of solutions like Databricks or Google BigQuery.
It’s crucial to define your primary business question before choosing a tool. As Veda Bawo, Director of Data Governance at Raymond James, emphasizes, “quality data is essential - without it, even the best tools fall short” [2]. The most successful implementations are driven by specific use cases rather than a checklist of features.
Before committing, consider running a 2–4 week pilot using your actual datasets. Vendor demos often fail to show how a tool handles messy, real-world data or integrates with your existing workflows. A trial period helps ensure the tool meets both your operational needs and strategic goals, especially if AI capabilities are part of your plan.
Speaking of AI, platforms with advanced features like autonomous data cleaning, anomaly detection, and process adjustments can be game-changers. However, the real value lies in whether the AI generates inspectable outputs, such as SQL or Python code, that your team can review and trust [3].
Lastly, take a close look at the vendor’s roadmap. The analytics space is evolving rapidly, with conversational interfaces and multimodal processing becoming key trends. Choosing a platform with a proven commitment to these advancements ensures your investment stays relevant as technology progresses [3]. Ultimately, aligning your tool with your data strategy can lead to faster, more informed decision-making.
FAQs
What should I test in a 2–4 week analytics tool pilot?
During a 2–4 week pilot, focus on testing these critical areas:
Data Integration: Confirm that the tool connects seamlessly with your existing data sources.
Ease of Use: Evaluate whether the interface is straightforward, especially for users without technical expertise.
AI Features: Examine capabilities like automation, predictive analytics, and natural language querying to see how well they perform.
Performance: Test for speed, scalability, and the ability to manage large datasets efficiently.
Collaboration: Ensure the tool supports team-sharing and smooth workflow integration.
These steps will help determine if the tool aligns with both your technical requirements and business goals.
How can I tell if an AI insight is trustworthy and auditable?
To determine if AI insights can be trusted and verified, look for clear documentation, evidence of compliance with ethical standards, and transparency in how decisions are made. A reliable AI system should include an audit trail that details its development, validation, and governance procedures. It's also critical to confirm that the outputs are consistent, thoroughly reviewed, and meet legal and ethical requirements. This ensures the system operates with accountability and can explain its processes clearly.
When should I move from spreadsheets to a data warehouse?
When your data outgrows what spreadsheets can handle, it’s time to consider moving to a data warehouse. Spreadsheets are fine for smaller tasks, but as your data increases in volume or complexity, they become harder to manage and more prone to mistakes. A data warehouse provides a centralized space for storage, faster query performance, and more advanced analytics. If you’re dealing with sluggish reports, inconsistent data, or challenges in integrating multiple sources, upgrading to a data warehouse can offer the reliability and efficiency you need for the long haul.
Related Blog Posts


