Business Intelligence
Augmented Analytics vs Predictive Analytics: What's the Difference?
Augmented analytics gives quick, self‑serve explanations; predictive analytics provides forecasts, scores, and risk estimates.

If you need answers about what changed, use augmented analytics. If you need a view of what may happen next, use predictive analytics. That’s the core split.
I’d sum it up like this:
- Augmented analytics helps me ask questions in plain English, spot odd metric shifts, often through AI-powered anomaly detection, and get explanations from live warehouse data.
- Predictive analytics helps me forecast ARR, score churn risk, and rank accounts or leads by likely outcome.
- One is about analysis now. The other is about forecasts and scoring for later decisions.
- Most BI teams need both at different stages. I’d usually start with augmented analytics first, then add predictive work after data definitions and history are stable.
A simple way to think about it:
- If I want to know why MRR dropped 12% last month, that’s augmented analytics.
- If I want to know which accounts have a 70%+ churn risk, that’s predictive analytics.
- If I want self-serve answers from Snowflake, BigQuery, Redshift, or Postgres without writing SQL every time, that points to augmented analytics.
- If I want models trained on past data with labeled outcomes, feature tables, and validation, that points to predictive analytics.
The short answer: augmented analytics speeds up business analysis, while predictive analytics estimates future results.
Quick Comparison
| Criteria | Augmented Analytics | Predictive Analytics |
|---|---|---|
| Main job | Explain current or past changes | Estimate future outcomes |
| Common questions | Why did signups drop? What caused an MRR shift? | Who might churn? What will next quarter’s ARR look like? |
| Main methods | Natural-language querying, AI explanations, anomaly alerts | Forecasting, classification, regression, scoring |
| Main users | Analysts, RevOps, product, CS, growth, finance | Data scientists, analytics engineers, analysts |
| Data needs | Clean warehouse data and shared metric definitions | Historical labeled data, feature engineering, model checks |
| Output | Charts, explanations, anomaly flags | Forecasts, churn scores, risk scores, propensity scores |
| Best starting point | Teams stuck on ad hoc questions | Teams making forecast- or risk-based decisions |
For most SaaS teams, the path is simple: fix self-serve analysis first, then build prediction workflows on top of that base.
What Augmented Analytics Does in Business Intelligence
Augmented analytics speeds up BI by helping teams query live warehouse data, explain KPI changes, and flag anomalies. That makes it a strong layer for self-serve analysis before teams move into forecasting.
Core Capabilities: Search, Explanations, and Anomaly Detection
At its core, augmented analytics usually handles three jobs.
- Natural-language querying lets someone ask a question in plain English and get an answer from the warehouse without writing SQL.
- AI-generated explanations break down why a KPI moved.
- Automated anomaly detection monitors metrics like daily signups, failed payments, or trial-to-paid conversion rate and flags activity that falls outside its baseline.
That matters more than it may seem at first glance. A product manager can ask for the reason behind a dip in signups. A finance lead can dig into an MRR shift. Instead of waiting in line for an analyst, teams can often get to the first answer on their own.
Some systems also label outputs as extracted or inferred. That gives users a cleaner way to separate direct facts from model-based interpretation.
Best-Fit Use Cases for Growing SaaS Teams
This tends to matter most for SaaS teams where questions shift week to week and analyst time is tight. If a product leader wants to know why weekly active users dropped, or a finance team needs a fast read on an MRR change, augmented analytics can cut down the time between the question and the answer.
It’s most useful when the other option is waiting for an analyst to write ad hoc SQL. The payoff is simple: faster answers, with less back-and-forth.
Where Querio Fits
Querio is a warehouse-native workspace with live connections to Snowflake, BigQuery, Redshift, ClickHouse, MotherDuck, and PostgreSQL. Its governed semantic context layer keeps metric definitions like MRR, churn, and activation rate consistent across the warehouse and across dbt models, so teams work from the same numbers.
Querio also generates SQL and Python that users can inspect and edit. That’s a big deal for technical teams. They can open the logic, check it, and adjust it instead of taking the answer on faith.
At the same time, non-technical users still get governed self-serve access through interactive notebooks. They can explore and filter data without touching the underlying code.
In plain terms, Querio helps teams answer what happened. Predictive analytics deals with what is likely to happen next.
What Predictive Analytics Does in Business Intelligence
Where augmented analytics explains what happened, predictive analytics uses warehouse history to estimate what comes next. It draws on historical data, statistical models, and machine learning to forecast what is likely to happen next [2].
Core Use Cases: Forecasting, Churn, and Propensity Scoring
In B2B SaaS, predictive analytics usually helps teams make revenue and retention calls.
Sales forecasting uses past revenue and pipeline data to produce forward-looking estimates. That gives leaders a better handle on hiring plans, team capacity, and quota setting.
Churn prediction flags accounts that may be at risk before renewal. It does that by looking at signals such as product usage, support tickets, and renewal history.
Propensity scoring ranks accounts or leads by how likely they are to convert, renew, or expand. In plain English, it helps sales and customer success spend time where it’s most likely to pay off.
These use cases need labeled outcomes and clear feature definitions. Ad hoc analysis alone won’t get the job done.
Workflow and Data Requirements
Predictive analytics usually needs more structure than descriptive BI. Raw event and CRM data sit in a centralized warehouse such as Snowflake, BigQuery, Redshift, or Postgres. SQL and dbt then shape that data into model-ready features [1].
Teams also need clear definitions for features and targets, along with a validation process to check whether the model is learning real patterns. Before teams put predictions into use, they also verify source tables, dbt models, and target labels [1].
How Querio Supports Predictive Workflows
Querio doesn’t replace the modeling layer. Python and your data science tooling still handle that part. Where Querio helps is in the work around the model.
Analysts can test features directly against live warehouse data before model design. Because Querio gives them inspectable and editable SQL and Python, they can dig into candidate features without relying on old exports or stale data. That cuts down on the usual back-and-forth.
Once a model writes output scores back to the warehouse, Querio’s governed semantic layer keeps those prediction outputs consistent and easy to access. Non-technical users, like account managers or finance leads, can then look into churn risk, forecast, or propensity outputs through Querio’s governed self-serve interface without touching the underlying model code.
That means the people who need the output can start using it sooner, instead of waiting on someone else to translate it for them.
That workflow difference becomes clearer in the side-by-side comparison below.
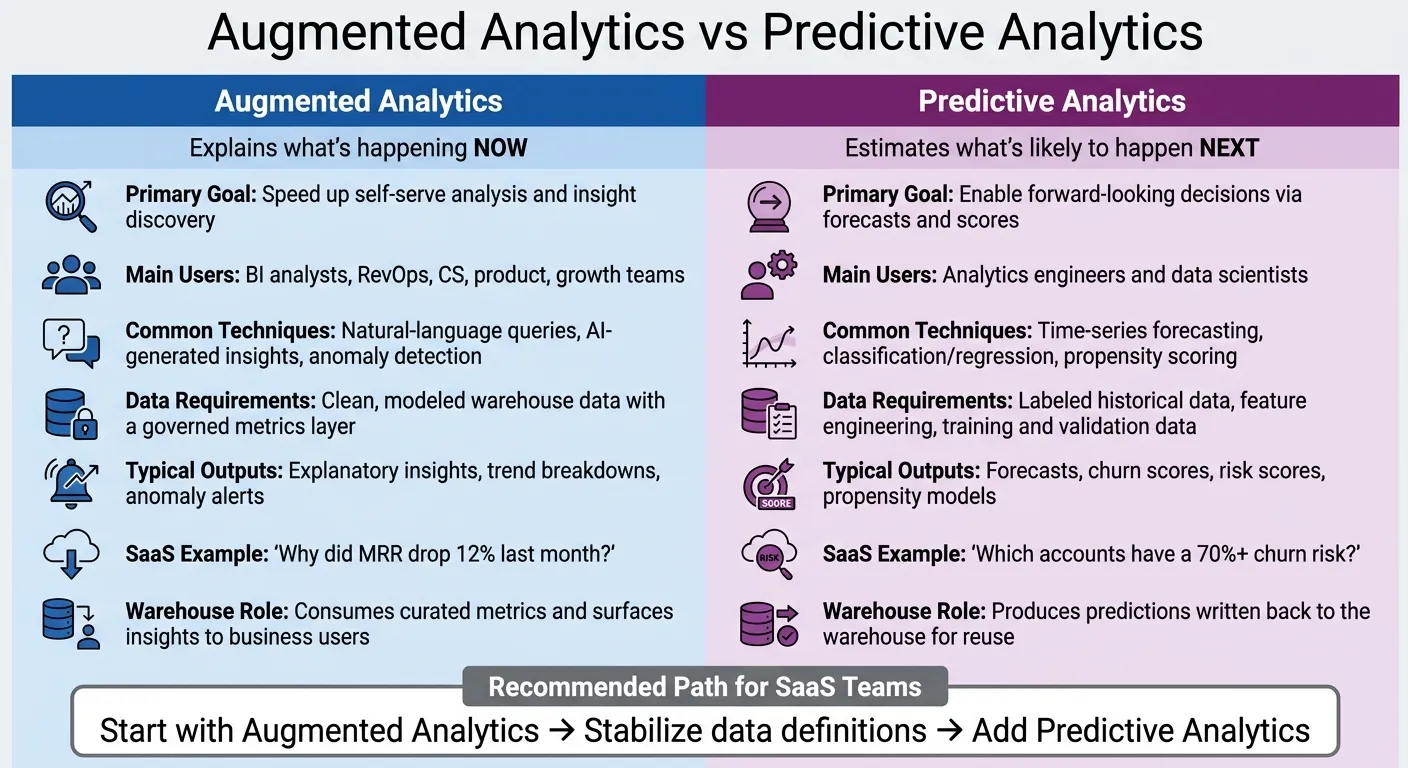
Augmented Analytics vs Predictive Analytics: Side-by-Side Comparison
Key Differences in Scope and Outcome
Based on the definitions above, augmented analytics explains what’s happening now; predictive analytics estimates what’s likely to happen next.
That split matters for BI teams. Augmented analytics is built for self-serve analysis across product, RevOps, CS, and growth teams, often without SQL. It helps answer questions like why MRR dipped or where usage anomalies are showing up.
Predictive analytics works differently. It’s more model-driven and usually relies on labeled historical data, feature engineering, plus model training and validation before teams can use it to guide decisions about ARR, churn, or pipeline.
Comparison Table: Goals, Users, Workflows, and Examples
| Dimension | Augmented Analytics | Predictive Analytics |
|---|---|---|
| Primary Goal | Speed up self-serve analysis and insight discovery | Enable forward-looking decisions via forecasts and scores |
| Main Users | BI analysts, RevOps, CS, product, growth teams | Analytics engineers and data scientists |
| Common Techniques | Natural-language queries, AI-generated insights, anomaly detection | Time-series forecasting, classification/regression, propensity scoring |
| Data Requirements | Clean, modeled warehouse data with a metrics layer vs. semantic layer | Labeled historical data, feature engineering, training and validation data |
| Typical Outputs | Explanatory insights, trend breakdowns, anomaly alerts | Forecasts, churn scores, risk scores, propensity models |
| SaaS Example | Explain an MRR swing or spot usage anomalies | Forecast next quarter's ARR or flag accounts at churn risk |
| Warehouse Role | Consumes curated metrics and surfaces insights to business users | Produces predictions that are written back to the warehouse for reuse |
Where They Overlap in a Modern Warehouse Stack
These two approaches often work side by side. A common setup is to train a churn model on dbt-built feature tables in Snowflake or BigQuery, then write the scores back to the warehouse. After that, augmented analytics tools can surface those scores, filter them by segment, and explain them next to standard KPIs.
Put simply, predictive analytics looks ahead. Augmented analytics helps teams make sense of those estimates and put them to work.
That overlap makes the choice pretty practical: use the right layer for the right job.
How to Choose the Right Approach for Your Team
Choose Augmented Analytics When Speed and Self-Serve Are the Priority
Once you look at the comparison side by side, the choice mostly comes down to where your team gets stuck.
If analysts spend most of their day answering ad hoc business questions, augmented analytics is usually the right place to start.
There’s one catch, though. Without a governed semantic layer, self-serve access can spread inconsistent definitions fast. One team’s “active customer” becomes another team’s “paying account,” and suddenly everyone is looking at different numbers.
Querio’s governed context layer helps avoid that mess. It standardizes joins and metric definitions once, then applies them the same way across questions in Snowflake or BigQuery.
Choose Predictive Analytics When the Goal Is Forward-Looking Decisions
Predictive analytics makes more sense when the goal is no longer just answering questions, but changing what the business does next.
That usually happens when a probability should shape a decision. For example:
- Should we assign a CSM to this account?
- Should we adjust Q3 headcount based on pipeline forecasts?
Predictive analytics also asks more from your data. It depends on clean historical data, consistent definitions, and a reliable way to surface model outputs where teams can actually use them.
Once scores are written back to Snowflake or Redshift, Querio lets analysts query them alongside KPIs with inspectable SQL.
Conclusion: The Practical Takeaway
Start with augmented analytics for self-serve analysis. Then add predictive analytics once your historical data and metric definitions are stable.
FAQs
Can augmented analytics use predictive model outputs?
Yes. Augmented analytics can use outputs from predictive models to surface deeper, more forward-looking insights.
Predictive analytics is built to forecast outcomes and spot patterns. Augmented analytics helps turn those outputs into something people can act on through automated dashboards, anomaly detection, and practical recommendations.
That means more complex results - like churn risk - become easier to understand and use in self-serve business decisions.
What data do we need before starting predictive analytics?
You need clean, consistent historical data and clearly defined business goals.
That means your data should be structured, cleaned up, and put in context so metrics like churn or revenue are measured the same way every time. Your data warehouse, such as Snowflake, BigQuery, or Redshift, also needs a solid model behind it to support the statistical methods used for forecasting and prediction.
Which should our BI team implement first?
Start with descriptive analytics. It shows what happened by turning historical data into dashboards, which gives your team a solid baseline.
Then add predictive analytics to forecast outcomes and spot risks using platforms like Snowflake, BigQuery, or Redshift. This order helps make sure your models are built on accurate, governed historical data instead of siloed or messy information.