Automate Data Analysis: A Playbook for Self-Serve AI
Ready to automate data analysis? This step-by-step playbook covers architecture, Python workflows, governance, and how to build a self-serve analytics engine.
https://www.youtube.com/watch?v=GYLjSnMD-DE
published
Outrank AI
automate data analysis, data automation, self-service analytics, python data analysis, ai data agent
fb5120bf-5e00-437c-b5f7-65944cd8c4aa

Teams often find that they don't have a data volume problem. They have a throughput problem.
The warehouse is full, event tracking is live, dashboards exist, and the business still waits in line for answers. Product wants funnel diagnostics. Finance wants variance explanations. Growth wants segmentation by campaign and cohort. The data team becomes a human API, rerunning the same logic in slightly different forms, answering the same question through a different slice every week.
That model breaks once the business expects continuous decisions instead of periodic reporting. If you're trying to automate data analysis, the key challenge isn't writing a few scheduled scripts. It's building an operating model where trusted analysis runs continuously, business users can explore safely, and analysts spend their time on semantics, quality, and decision support instead of queue management.
The architecture matters because the bottleneck usually isn't SQL skill. It's the gap between raw warehouse data and reusable analytical logic. If that sounds familiar, it helps to revisit how data warehouse architectures shape downstream analytics workflows.
Table of Contents
From Data Bottleneck to Analytics Engine
Manual analytics doesn't fail all at once. It degrades gradually. First, the backlog grows. Then high-signal work gets delayed by recurring requests. Eventually, the team stops doing proactive analysis because reactive work consumes the week.
That pattern exists because manual analysis doesn't scale linearly with business demand. IBM notes that an analyst may only handle about 5–15 active analyses at a time, while automated systems can monitor thousands of metrics across hundreds of segments simultaneously and flag anomalies in minutes to hours instead of days or weeks in manual workflows, turning reporting into a continuous control system (IBM on data automation).
The practical implication is bigger than productivity. It changes what the data team should build. Instead of serving as report producers, they need to own the control plane for analysis: semantic logic, reusable models, alerting, auditability, and safe self-service.
Teams don't outgrow manual reporting because they're inefficient. They outgrow it because the business starts asking for continuous interpretation.
An analytics engine has different design goals than a dashboard stack. It needs to detect change, explain change, and route insight to the right person with enough context to act. That means fewer one-off charts and more reusable analytical assets: parameterized notebooks, metric definitions, governed models, and monitored workflows.
When people say they want to automate data analysis, what they usually need is a shift from request-based analytics to system-based analytics. That's the inflection point where the data team stops being a service desk and starts acting like infrastructure.
Setting Goals and Success Metrics for Automation
Most automation projects stall because the goal is too vague. "Save analyst time" sounds reasonable, but it doesn't tell you what to automate first, what quality bar to enforce, or which users should consume the output.
A stronger starting point is the business question. Practitioner guidance on automated analysis emphasizes beginning with a defined business question, then centralizing data, standardizing formats, handling missing values explicitly, and validating the outcome so the workflow doesn't bake bias into the result (Saison Technology on automated analysis workflow design).
Start with one question that matters
Pick a workflow with four properties:
It recurs often
Weekly funnel reviews, daily KPI checks, campaign pacing, inventory exceptions, support backlog shifts.It already has a human owner
If nobody owns the business process, automation won't create accountability.It relies on stable inputs
If source data changes constantly or key definitions are still disputed, wait.It leads to an action
Good candidates trigger an investigation, a reroute, a fix, or a decision.
Here's a useful test:
Workflow type | Good automation candidate | Poor automation candidate |
|---|---|---|
KPI monitoring | Revenue dip by segment, signup conversion drop | Undefined "overall health" score |
Product analysis | Activation funnel by app version | Open-ended exploration with changing definitions |
Customer analysis | Repeat purchase cohort shifts | Executive narrative synthesis for board prep |
The mistake I see most often is starting with broad BI replacement. That's too much surface area. Start with a single, expensive habit. If the company already reviews one funnel every Monday, automate that path first.
Choose metrics that reflect behavior change
Track success at three levels.
Operational success means the workflow runs reliably. Are inputs arriving, checks completing, and outputs delivered on schedule?
Analytical success means the logic produces usable answers. Are people accepting the result without redoing the work manually?
Business success means the output changes decisions. Did the workflow shorten investigation time, improve response speed, or increase the number of issues caught early?
Practical rule: If an automated workflow still requires an analyst to manually verify every run before anyone trusts it, you haven't automated analysis. You've automated draft generation.
Use qualitative success criteria if you don't have a baseline yet. Examples include fewer repeated Slack requests, faster handoff from anomaly detection to diagnosis, and more decisions supported by recurring analysis rather than ad hoc queries.
It's also worth defining where automation stops. Problem framing, metric design, and ambiguous interpretation usually stay human-led. That's not a limitation. It's good architecture. The teams that get value fastest don't automate judgment. They automate the repetitive path up to the point where judgment matters.
Designing the End-to-End Automation Architecture
The stack needs to support repeatability before it supports intelligence. If the data foundation is unstable, every AI layer on top becomes a faster way to generate mistrust.
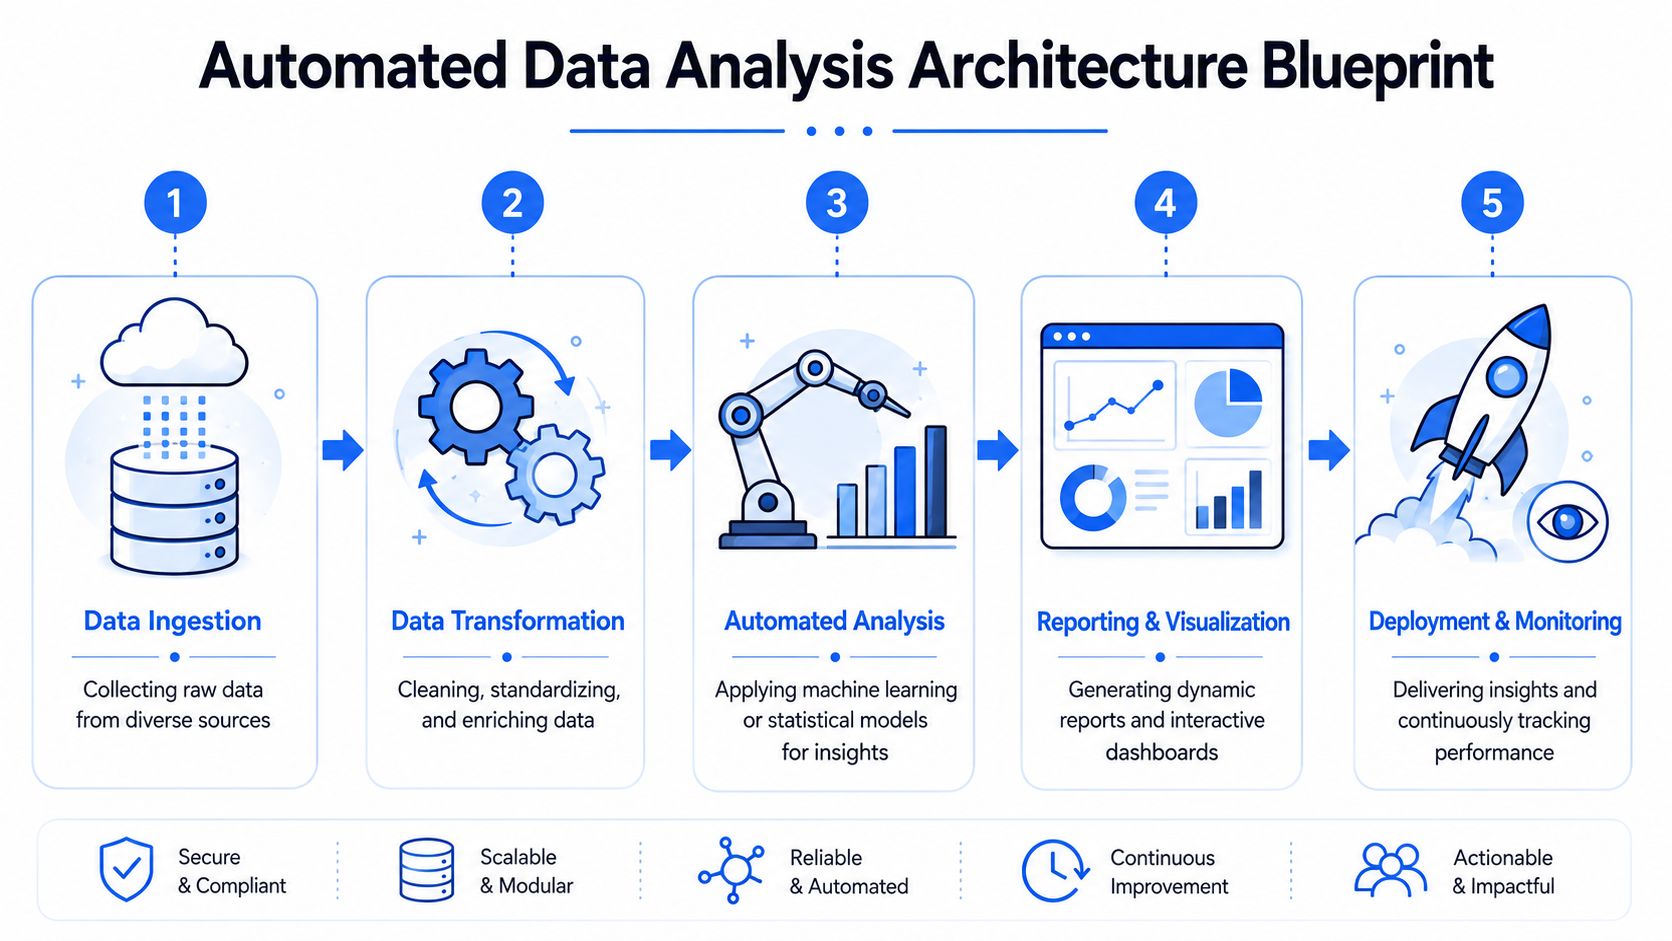
A typical automated analytics architecture includes an ingestion layer, a cloud warehouse such as Snowflake or BigQuery, and a transformation layer using dbt-style models. It also needs alerting, access control, and auditing to deliver insights securely and reproducibly at scale, as outlined in Explo's overview of automated data analytics architecture.
The stack that holds up in production
Think of the architecture in five layers.
Ingestion layer
This is ETL or ELT from product databases, CRM systems, billing tools, ad platforms, ERP systems, and external APIs. The priority isn't just moving data. It's preserving lineage and landing source data consistently enough for downstream modeling.
Warehouse layer
Snowflake, BigQuery, and Redshift work because they centralize compute and storage around one queryable source of truth. If your automation stack has to pull from scattered spreadsheets and app-level exports, you'll spend more time reconciling than analyzing.
Transformation layer
Business logic belongs in this layer. dbt-style models, tests, and documentation turn raw events into durable analytical entities such as sessions, orders, active accounts, trial cohorts, and attributed conversions.
Analysis layer
In the analysis layer, teams often still lean too heavily on BI dashboards. Dashboards are useful for consumption, but weak for iterative diagnosis. The analysis layer should support SQL, Python, reusable notebooks, parameterized workflows, and machine-assisted exploration. If you're evaluating design trade-offs in this layer, Rite NRG on software architecture is a useful read on choosing structures that stay maintainable as complexity grows.
Delivery and control layer
Alerts, reports, APIs, permissions, audit logs, and workflow orchestration sit here. This layer decides who sees what, when they see it, and how you can reconstruct what happened later.
For teams modernizing the full stack, this view lines up closely with the modern data stack operating model.
Where the analysis layer usually fails
Most failures aren't caused by bad models. They're caused by bad coupling.
A common anti-pattern is this:
transformations live in one tool
metric logic lives in another
exploratory notebooks live on local machines
alert thresholds live in a BI layer
nobody can trace which definition fed which decision
That setup creates invisible forks in business logic. One dashboard says "active customer." One notebook uses a slightly different filter. A Slack alert uses a third variant. Automation multiplies that inconsistency unless the analytical logic is versioned and close to the warehouse.
Agent-based tooling transforms the design. Instead of forcing every question into dashboard abstractions, a file-based notebook system lets teams package analysis as code and still expose it through a controlled interface. Querio fits that pattern by deploying AI coding agents directly on the warehouse through custom Python notebooks, so teams can operationalize recurring analysis without turning every workflow into a custom engineering project.
Implementing Core Automation Workflows with Python
The fastest way to automate data analysis is to start with workflows your team already runs by hand. Python remains the practical default because it handles SQL execution, statistical checks, scheduling hooks, plotting, and notification logic in one environment.
Automated systems now complete many routine reporting and diagnostic tasks in seconds to minutes instead of hours to weeks, especially when paired with cloud warehouses, automatic dashboard updates, and scheduled workflows using Python and R, as described by Zuar's discussion of data automation and analysis speed.
A notebook-first setup makes this approachable.

If your team wants a reusable starting point for this style of work, these interactive notebook templates for analytics workflows are the right format to standardize on.
Workflow one KPI monitoring and alerting
Start with a metric that already drives behavior. Daily signups, activation rate, support backlog, failed payments, or usage by account tier all work.
This is simple on purpose. You don't need a full anomaly platform to get started. What matters is standardizing the baseline logic, documenting exclusions, and routing alerts to an owner who can investigate.
A useful extension is automated notification delivery. If you want the workflow to trigger customer-facing or internal email actions, this guide to building autonomous email-enabled workflows is relevant because delivery becomes part of the operating system, not an afterthought.
Workflow two funnel analysis
Funnels are ideal candidates because the question repeats and the structure is stable. The logic below computes drop-off by stage for a recent period.
The manual version of this workflow usually breaks when someone asks the next question. "Can you split by acquisition source?" "What about mobile only?" "What changed after the release?" That's why static dashboards often disappoint. Substantial work starts after the first chart.
The winning pattern is not one automated funnel report. It's a parameterized workflow that can rerun the same analytical logic across product area, market, device type, or experiment group without a fresh rebuild.
A mature version adds root-cause branches. If activation drops, the notebook should automatically test which dimensions changed most and surface the likely breakpoints.
Later in the process, a walkthrough helps teams see how notebook logic becomes an operational workflow:
Workflow three segmentation and cohorts
Segmentation automation works when your entity model is stable. Customers, accounts, plans, geographies, and lifecycle stages are common dimensions.
What usually matters isn't the chart. It's persistence. Can this run without local setup, with versioned logic, consistent dependencies, and scheduled execution? That's where agent-based notebook systems help. They can generate scaffolding, debug failing queries, and keep recurring analysis close to warehouse data instead of trapped in individual analyst environments.
Enabling Self-Service and Secure Deployment Patterns
A notebook that only the author can run is still a bottleneck. Real self-service starts when the data team packages analysis so other people can use it without editing SQL, copying formulas, or waiting for office hours.
That requires product thinking. You are not just exposing data. You are exposing safe analytical actions.

Self-service needs product design not just permissions
Most self-service programs fail for one of three reasons:
The interface is too raw
Users get direct table access and no semantic guardrails.The outputs are too rigid
Dashboards answer last week's question but can't support follow-up analysis.The permission model is too loose
Sensitive data spreads faster than understanding.
The better pattern is layered access.
User type | What they need | What they should not need |
|---|---|---|
Business stakeholder | Parameterized reports, alerts, guided drill-down | SQL editing, table joins |
Product manager | Interactive exploration within governed models | Full warehouse admin rights |
Analyst or engineer | Notebook access, version control, reusable code paths | Manual report duplication |
File-based analytics proves helpful. Versioned notebooks and parameterized workflows create a clear boundary between reusable logic and user-controlled inputs. Business users can run approved analyses. Advanced users can branch responsibly. The data team retains control over definitions and execution context.
Deployment patterns that reduce rework
A strong deployment model usually includes these elements:
Scheduled execution
Run recurring notebooks on a cadence tied to the business process, not just technical convenience.Git-backed logic
Treat notebook code, SQL, and metric definitions as versioned assets. If a result changes, you need to know whether data changed or logic changed.Parameterized runs
Let users choose region, product line, team, or date range without changing the underlying code.Role-based access
Permissions should apply to datasets, notebook execution, outputs, and sharing paths.Reproducible environments
Dependency drift is one of the quietest causes of analytical mistrust.
A self-service platform works when users can answer the next reasonable question on their own, but can't accidentally redefine the business.
Secure deployment also means resisting the temptation to expose raw AI output directly to decision-makers without context. Generated summaries, anomaly explanations, and suggested root causes should link back to the data model and drill-down path that produced them. If users can't inspect the logic, trust erodes quickly.
Governance, Testing, and Measuring True ROI
"Automate everything" is a bad analytics strategy.
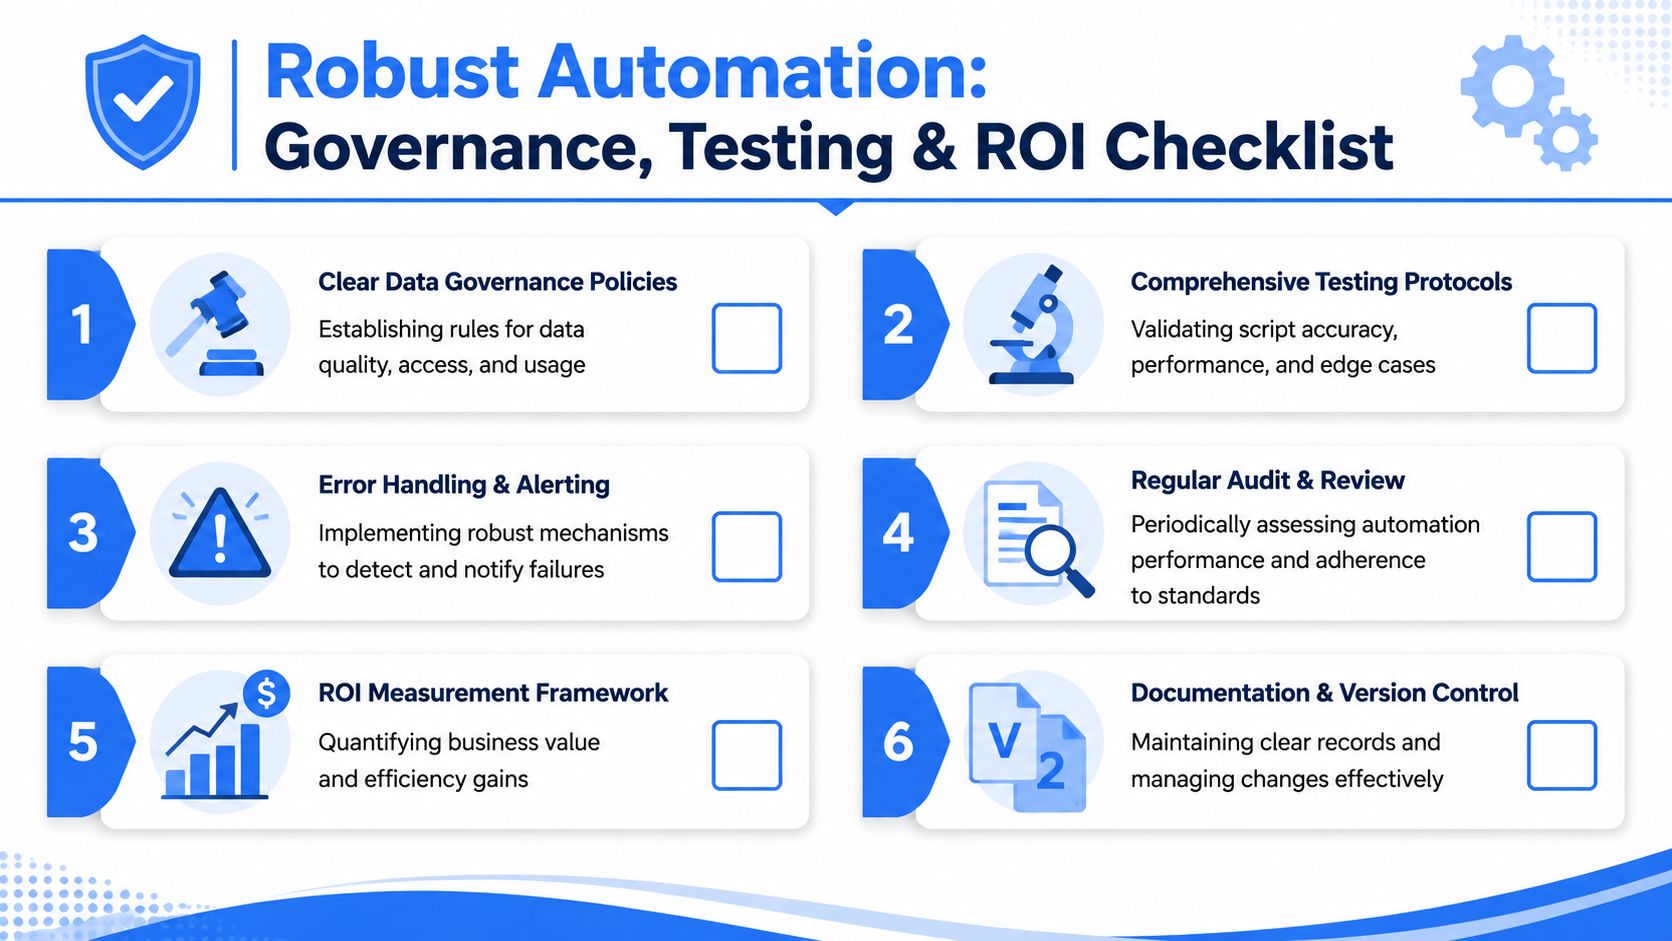
The hard part isn't generating more output. The hard part is making automated output trustworthy enough that people will act on it. Guidance on automated analytics governance highlights a recurring problem: many systems can collect, clean, and analyze data, but far fewer explain how to validate business logic or prevent misleading outputs. More automation can increase decision risk if the organization lacks governance around KPI definitions, anomaly thresholds, and the human review loop for high-stakes decisions (Skopx on governance and trust in automated data analysis).
If you're building that trust layer formally, this guide to data governance implementation patterns is the right companion to the technical stack.
Why full automation often increases risk
Some decisions shouldn't be automated past recommendation.
Good candidates for full automation include:
threshold-based operational alerts
recurring report refreshes
standard segmentation updates
scheduled diagnostic notebooks
Poor candidates include:
metric redefinition
strategic interpretation of mixed signals
high-stakes pricing or staffing decisions based on one model output
executive narratives where context matters more than speed
This distinction matters because systems are good at consistency and scale. They are bad at ambiguity, organizational nuance, and unstated exceptions. If your company treats an AI-generated explanation as final truth without review, the failure mode isn't just a wrong chart. It's a wrong decision with false confidence.
What to test before people trust it
Testing needs to happen at multiple levels.
Data pipeline tests
Validate freshness, schema expectations, null handling, and duplicate behavior before analysis runs.
Transformation tests
Check metric logic, joins, grain consistency, and dimensional mapping. Most "analysis bugs" start here.
Notebook and workflow tests
Run sample inputs, edge cases, and expected failure paths. A notebook that works once isn't production-ready.
Delivery tests
Verify that the right users receive the right outputs, and that access restrictions hold under sharing and export patterns.
A practical review model looks like this:
The system runs automatically.
Low-risk outputs publish directly.
Higher-risk outputs go through a human review queue.
Every output retains lineage to source tables, logic version, and execution timestamp.
Users can drill into the underlying numbers when the summary feels wrong.
Trust doesn't come from automation. It comes from being able to inspect, reproduce, and challenge what automation produced.
How to measure ROI without hand waving
Most ROI discussions stop at labor savings. That understates the value and sometimes points teams to the wrong work.
Use three buckets.
Recovered analytical capacity
How much repetitive work disappeared from the queue? This allows analysts to move to experimentation support, metric design, and strategic diagnostics.
Faster business response
Did the company identify anomalies sooner, ship fixes earlier, or resolve operational issues before they spread?
Decision quality and consistency
Are teams using the same logic across functions? Are they spending less time debating definitions and more time acting?
A simple scorecard works better than a heroic forecast. For each automated workflow, record:
Dimension | Questions to ask |
|---|---|
Reliability | Did it run correctly on schedule? |
Adoption | Did the intended users actually consume it? |
Actionability | Did it trigger investigation or action? |
Trust | Did people accept the output without manual recreation? |
Strategic value | Did it free analysts for higher-leverage work? |
The strongest automation portfolios aren't the ones with the most workflows. They're the ones with the clearest boundaries, the best testing discipline, and the highest trust per workflow.
Querio is one way to operationalize that model. It deploys AI coding agents directly on the data warehouse through a file-based notebook approach, so teams can package recurring analysis, keep logic close to governed data, and give business users self-serve access without turning analysts into permanent report operators. If you're rethinking how to automate data analysis at the architecture level, Querio is worth evaluating alongside your warehouse, transformation, and governance stack.

