Business Intelligence
Statistical Tools for Data Analysis: R vs Python vs SPSS vs SAS
Compare cost, ease of use, warehouse fit, auditability, and team use cases for major statistical tools.

If I had to sum it up in one line: R fits stats-heavy work, Python fits ML and pipeline work, SPSS fits GUI-based standard analysis, and SAS fits regulated enterprise teams.
If you work with Snowflake, BigQuery, Redshift, or Postgres, the choice often comes down to five things:
- Cost: R and Python are free; SPSS starts around $109/month per user; SAS is quote-based
- Ease of use: SPSS is easiest for non-coders; R and SAS take more time to learn
- Warehouse fit: R and Python work better for live warehouse-based analysis
- Audit trail: SAS leads for controlled review and logging; R and Python depend on code + Git
- Type of work: R for deep stats, Python for ML and production, SPSS for standard tests, SAS for compliance-heavy teams
In short, if you need exploratory and advanced statistical analysis, I’d lean toward R. If you need models, automation, and repeatable workflows, I’d pick Python. If your team wants point-and-click analysis, SPSS is the simple choice. And if you need strict controls for finance, healthcare, or pharma, SAS is usually the safer fit.
::: @figure 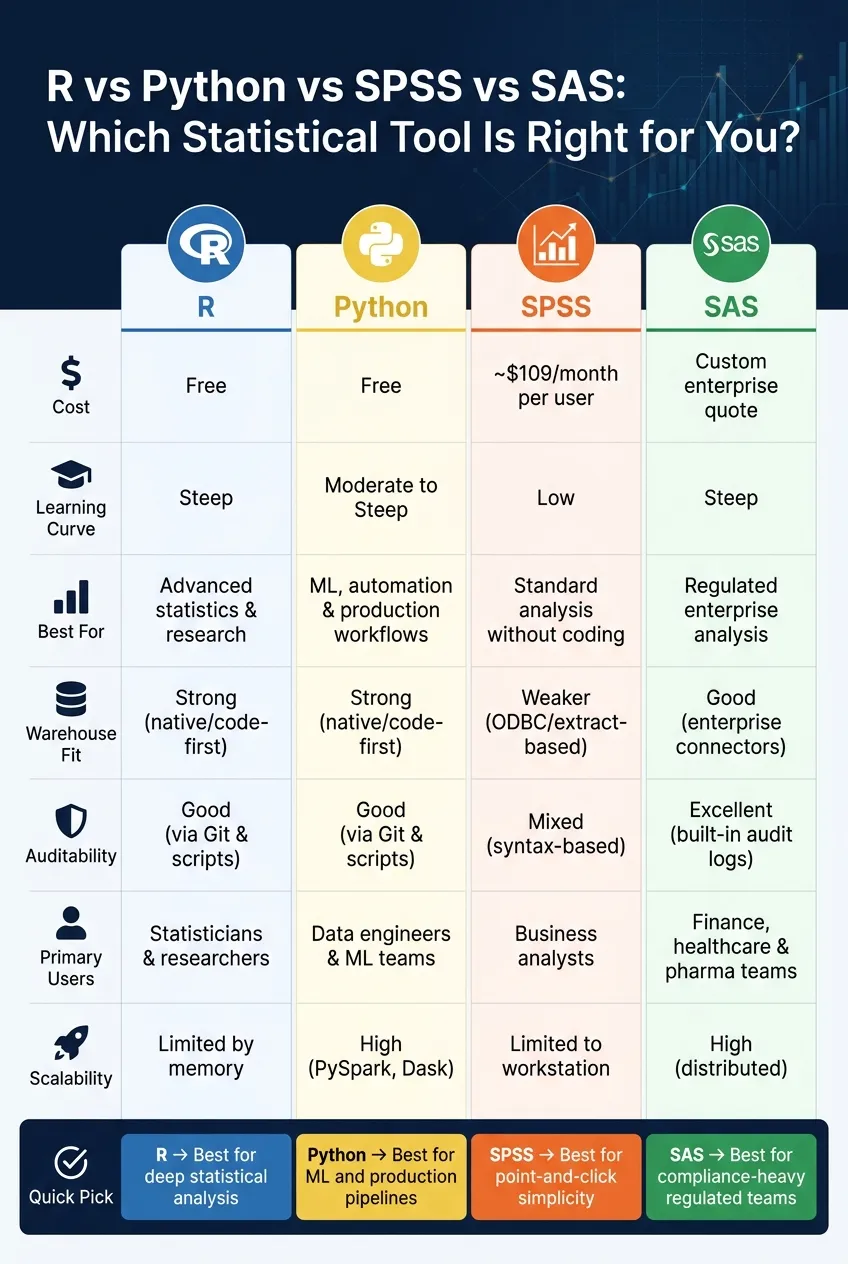 {R vs Python vs SPSS vs SAS: Statistical Tools Compared}
:::
{R vs Python vs SPSS vs SAS: Statistical Tools Compared}
:::
Python, R, SAS vs SPSS, Excel, Minitab– The Ultimate Comparison| #statisticalsoftware #dataanalysis
::: @iframe https://www.youtube.com/embed/2X2zSDSCZbg :::
Quick Comparison
| Tool | Best use | Cost | Learning curve | Warehouse fit | Audit trail |
|---|---|---|---|---|---|
| R | Advanced statistics | Free | Steep | Strong | Good through code |
| Python | ML and production workflows | Free | Moderate to steep | Strong | Good through code |
| SPSS | Standard analysis without coding | $109/month+ | Low | Weaker | Mixed |
| SAS | Regulated enterprise analysis | Custom quote | Steep | Good | Strong |
My quick take: choose the tool that matches your team’s skills, workflow, and review needs - not just the one with the most features.
R vs Python vs SPSS vs SAS: side-by-side comparison
Here’s the quick version of how these four tools compare on the things analytics teams usually care about most:
| Dimension | R | Python | SPSS | SAS |
|---|---|---|---|---|
| Cost | Free | Free | ~$109/mo per user [1] | Enterprise quote |
| Learning curve | Steep | Moderate to steep | Low | Steep |
| Primary user | Advanced statistical users | Production analytics teams | Business analysts | Regulated enterprise teams |
| Warehouse access | Native/code-first | Native/code-first | ODBC/extract-based | Enterprise connectors |
| Reproducibility | Excellent (scripts, Quarto) | Excellent (scripts, notebooks) | Moderate (auto-syntax) | Excellent (validated scripts) |
| Governance | Manual governance (Git, SOPs) | Manual governance (Git, SOPs) | IBM platform controls | Built-in controls |
| Auditability | Traceable via code | Traceable via code | Syntax-based records | Comprehensive audit logs |
| Scalability | Limited by memory | High (PySpark, Dask) | Limited to workstation | High (distributed) |
Cost, learning curve, and team adoption
R and Python are free to use, so the main cost isn’t licensing. It’s training.
That’s the catch with code-first tools: you save money on software, but teams usually need more time to get comfortable with them. R tends to be toughest for most new users. Python can feel a bit easier at first, but it still asks people to learn how to work in code.
SPSS goes in the other direction. IBM licenses it at about $109/month per authorized user [1], but the learning curve is much lower. Someone who has never written code can still run regressions, t-tests, and cross-tabulations through the interface. For many business teams, that’s a big deal.
SAS usually lands at the top end on price, with quote-based enterprise licensing. It also has a steep learning curve, so teams often choose it for control and process, not ease of use.
Those tradeoffs become clearer once you look at day-to-day work like analysis, modeling, and reporting.
Warehouse and modern stack compatibility
R and Python fit more naturally into modern data warehouse architectures. They connect straight to Snowflake, BigQuery, Redshift, and Postgres through native or code-first integrations.
SPSS can connect too, but it often relies on ODBC or local extracts. That adds friction. In a warehouse-first setup, extra export and import steps can slow people down and make the workflow feel clunky.
SAS has enterprise connectors for major warehouses, so it can work well in larger company setups. Still, the workflow is usually less flexible than what you get with R or Python.
Reproducibility, governance, and auditability
R and Python do well here because everything lives in code. When analysts commit scripts to Git, changes to transformations and model settings are visible, reviewable, and easy to track.
SPSS offers part of that through auto-generated syntax. That helps, but only if teams actually save and version the syntax. If they don’t, the record is much weaker.
SAS stands out most in regulated settings. Validated scripts, built-in audit logs, and enterprise controls make it a better fit when reviewability and record-keeping aren’t optional.
A governed semantic layer also helps keep metric definitions aligned across R and Python workflows. That becomes more important when teams move from one-off analysis into recurring work.
How each tool handles common analytics work
This section turns those tradeoffs into the kind of work teams deal with every day. Here’s a simple, job-by-job view of where each tool tends to fit best.
| Analytics Job | R | Python | SPSS | SAS |
|---|---|---|---|---|
| Exploratory analysis | Strong | Strong | Good (point-and-click) | Good |
| Hypothesis testing | Excellent | Good | Strong | Excellent |
| Predictive modeling | Best for statistical modeling | Strong for machine learning and production workflows | Limited | Strong for enterprise and large-data use cases |
| Recurring reporting | Good | Strong | Works for basic scheduled output | Strong |
| Regulated workflows | Code-based controls | Code-based controls | Saved syntax + SOPs | Built-in validation + audit logs |
Exploratory analysis and hypothesis testing
R and Python both do well in exploratory analysis, but R has an edge when the work leans more heavily on statistics. If your day is full of tests, distributions, and research-style analysis, R often feels like the better fit.
SPSS works well for non-programmers who need standard tests through a GUI. That lines up with the usual takeaway: SPSS is easier for standard statistics, while R is a better match for research-oriented work. SAS, on the other hand, fits teams that need analysis to happen in a controlled, audited setting.
Predictive modeling and advanced analytics
Python leads when the focus is machine learning and production workflows. It’s often the tool teams reach for when models need to move beyond analysis and into systems people use every day.
R is stronger for statistically rich modeling. SAS fits enterprise-controlled modeling, especially when process control matters as much as model output. SPSS is the weakest option here, especially for more advanced modeling work.
Reporting, recurring workflows, and stakeholder reporting
For recurring reporting, the main question is simple: can the work be rerun, versioned, and written back to the warehouse? That’s where Python and R both stand out. They work well when results need to live inside repeatable workflows instead of one-off files.
SAS also handles enterprise reporting well in controlled settings where outputs need to be auditable. SPSS can manage basic scheduled output, but it usually fits less well with warehouse-native, version-controlled workflows. Those day-to-day differences set up the tool-level strengths and weaknesses in the next section.
Strengths, weaknesses, and best fit for each tool
| Tool | Core Strength | Primary Friction | Best Fit |
|---|---|---|---|
| R | Advanced statistics & visualization | Steep learning curve; memory limits | Advanced statistics and research |
| Python | ML, automation, and production workflows | Requires coding; complex environment setup | Automation and production analytics |
| SPSS | Point-and-click analysis | High cost; limited workflow automation | Standard statistical work without coding |
| SAS | Compliance and large regulated datasets | Very high cost; vendor lock-in | Regulated enterprise analysis |
R and Python for warehouse-native analytics
R and Python are the best match for warehouse-native analytics because they keep analysis tied to live data in Snowflake, BigQuery, Redshift, or Postgres. That means the work can stay in the warehouse instead of bouncing between exported files and separate tools.
R stands out when statistical depth and data visualization matter most. Python has a broader range, especially for automation, machine learning, and repeatable production workflows. Both can support repeatable pipelines that write results back to governed warehouse tables.
If coding isn't the main goal, SPSS handles standard statistical work with less setup and a much more guided interface.
SPSS for standard statistical workflows
SPSS is a good fit for teams that need standard tests like ANOVA, factor analysis, and regression without writing code. It works well for t-tests, ANOVA, factor analysis, and regression in survey analysis and standard business statistics.
Subscriptions start at about $109 per month per authorized user [1]. That's the tradeoff: it saves setup time, but it can create more friction for warehouse-first teams that want live warehouse connections instead of extracts. In that kind of setup, SPSS tends to feel more limited because its ecosystem connections are lighter.
If control and compliance matter more than ease of use, SAS starts to look like the stronger option.
SAS for regulated and enterprise-controlled analysis
SAS fits teams that need governed analysis inside controlled enterprise workflows. Its edge isn't flexibility. It's control, traceability, and alignment with regulated workflows. That's why teams in healthcare, finance, and pharma often choose SAS for large regulated datasets and tightly managed processes.
The downsides are hard to ignore: SAS is expensive, and vendor lock-in is part of the package. Still, for regulated teams, it's the strongest fit when traceability and control matter most.
How to choose the right tool for your team
Start with three things: where your data lives, how comfortable your team is with code, and how much control you need around access and review. Then use the comparison above to match a tool to the way your team actually works, not just to a flashy feature list.
Best tool by company type and use case
The simplest way to narrow the field is by company type and operating model.
| Company Type | Primary Need | Recommended Tool | Why |
|---|---|---|---|
| B2B SaaS (100–500 employees) | Production analytics, automation, live warehouse queries | Python | Fits live warehouse queries and recurring reporting |
| Healthcare / Clinical research | Survey analysis + advanced biostatistics | SPSS → R | SPSS is a good starting point for quick survey analysis; R is better for sophisticated biostatistics or longitudinal studies [1][2] |
| Finance / Regulated enterprise | Compliance, audit trails, large datasets | SAS | Strong fit for regulated workflows and built-in traceability |
| Biostatistics / Clinical research teams | Advanced statistics, custom visualizations | R | Strong statistical depth and flexibility for custom analysis |
Decision checklist for data leaders
If the table gives you a shortlist, this checklist helps you break the tie.
- Budget: Can you take on SPSS subscription costs, or would an open-source option like R or Python make more sense?
- Coding skills: Does your team write code with ease, or do analysts need a guided interface?
- Warehouse maturity: Are you working from a production warehouse in Snowflake, Redshift, or BigQuery, or are you still leaning on exports and flat files?
- Governance requirements: Do you need built-in audit trails, or can your team handle governance through scripts and version control?
- Reporting volume: How many recurring reports does your team ship? If that number is high, Python tends to be a better fit.
For data teams that want governed self-serve analytics on top of live warehouse data, Querio sits alongside these statistical tools as the self-serve layer. Business users can query live data without exporting CSVs, and every answer shows inspectable SQL or Python.
FAQs
::: faq
Which tool is best for a SQL-first data team?
For a SQL-first data team, the best setup is simple: use SQL for the heavy lifting. That means filtering, joining, and aggregating large datasets right in the warehouse. Then, switch to Python when you need deeper statistical analysis, more advanced modeling, or custom charts.
This way, analysts can go from data extraction to analysis in one governed workflow, without manual exports or messy CSV handling. :::
::: faq
When should a team choose SAS over R or Python?
Choose SAS when a team works in highly regulated settings like pharmaceuticals, government, or finance, where compliance, audit trails, and data security matter most.
It’s also a strong fit for large enterprise datasets and organizations that need dedicated support, strict validation processes, and built-in governance. R and Python give teams more flexibility and usually cost less, but SAS is often the safer pick when enterprise-level rigor is the top priority. :::
::: faq
Can SPSS handle recurring warehouse-based reporting?
SPSS isn't a great fit for recurring, warehouse-based reporting.
Yes, it can automate some work with syntax. But at its core, it's a standalone statistical package that often depends on manual data extraction.
That becomes a pain when you're working with complex relational data in Snowflake, BigQuery, or Redshift. And as recurring analytics starts to scale, manual file handling can lead to efficiency problems and inconsistent metrics. :::