Business Intelligence
How Do You Migrate QuickSight Calculated Fields to SQL and dbt?
Two QuickSight level-aware calculations share one bracket syntax and need different SQL. How calculated fields, parameters and row-level security move to dbt.
 Javier BonillaCo-founder & CTO
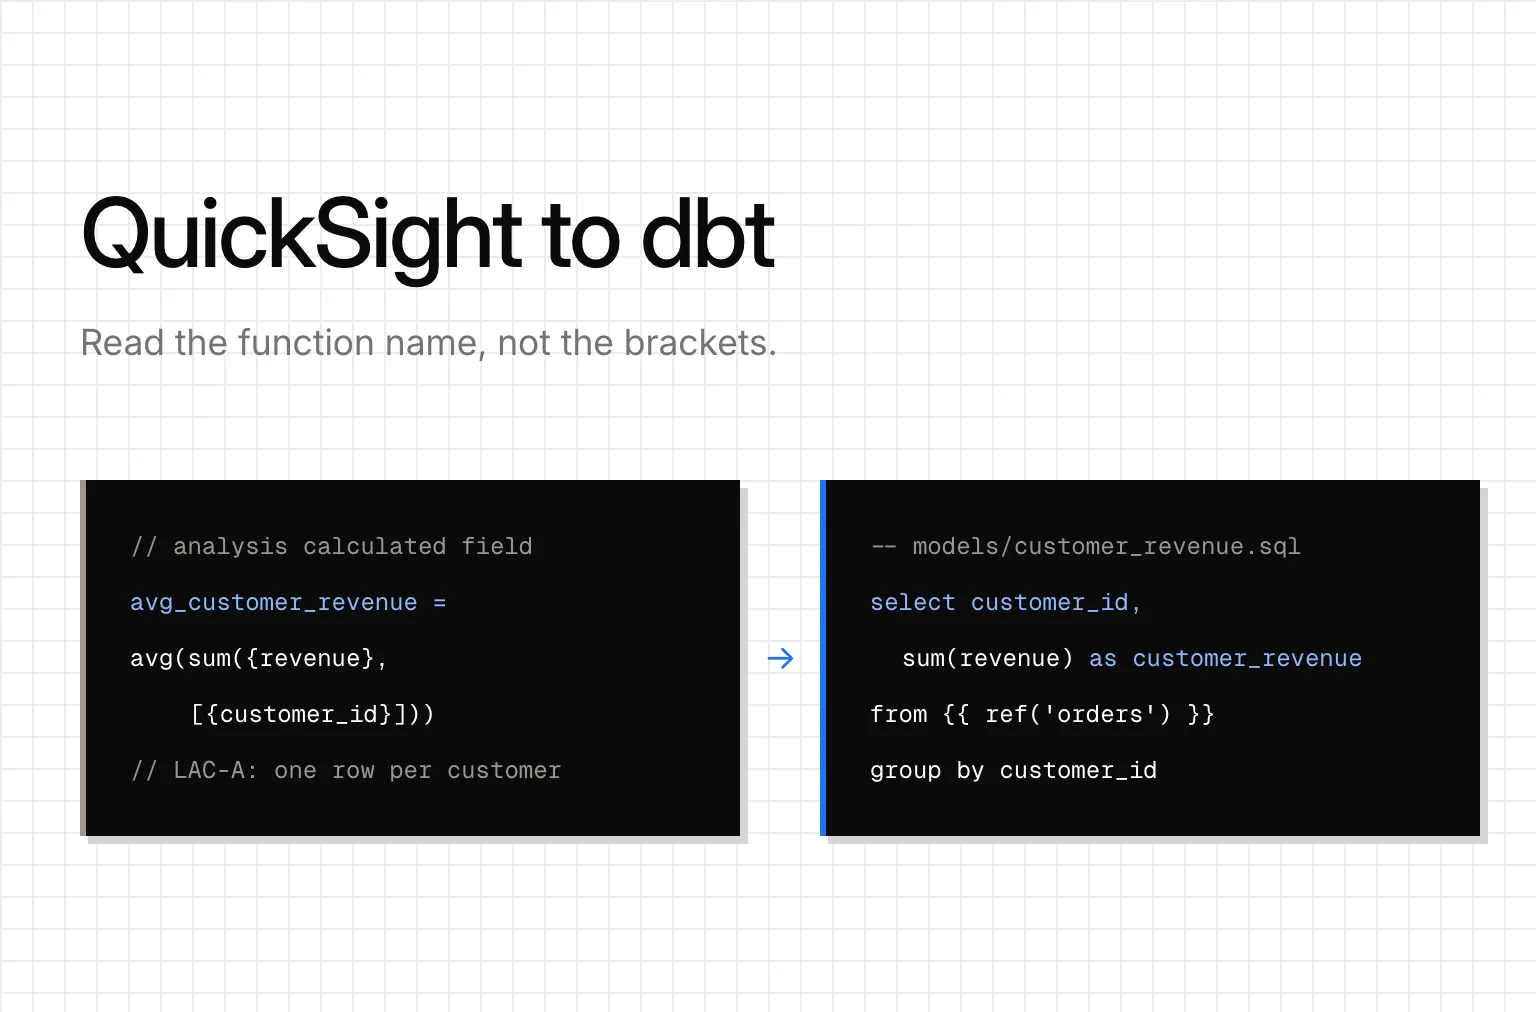
QuickSight writes two kinds of level-aware calculation with the same square brackets, and they don't move to SQL the same way. A level-aware aggregate like sum({revenue}, [{customer_id}]) becomes its own dbt model at the grain in the brackets. A level-aware window like sumOver({revenue}, [{customer_id}], PRE_FILTER) becomes a window column. Mix them up and the number moves: on our test data, average revenue per customer came out 277.5 as a model and 281.25 as a window column.
This guide is about moving the logic out of QuickSight and into dbt, not moving assets between AWS accounts. Every number in our examples comes from a QuickSight asset bundle we wrote by hand, with invented retail data. We converted it with unshackle 0.1.0, the free, open-source CLI we built for moving BI tools into Git, and ran the result in dbt-core 1.12 and MetricFlow 0.213 on DuckDB.
Is a QuickSight level-aware calculation a SQL window function?
Only one of the two kinds is. Search for the SQL behind QuickSight calculated fields and Google's AI Overview says level-aware aggregations "map perfectly to SQL Window Functions (OVER (PARTITION BY ...))". For sumOver, avgOver and the other window functions, that's right, and the old name explains the slip: AWS's level-aware calculations page says those "used to be called level aware aggregations". AWS calls them LAC-W now.
The aggregate kind, LAC-A, isn't a window at all. It puts the brackets on a plain aggregate, and AWS says it "first aggregates" at the level in the brackets, "and then the visual level calculation" runs over those results. So avg(sum({revenue}, [{customer_id}])) sums each customer's orders into one row, then averages those rows.
Our data has 6 customers and 20 orders. Two customers placed 4 orders each and the other four placed 3. Their totals are 430, 200, 315, 195, 395 and 130, which is 1,665 in all:
- As LAC-A means it, six customer rows: 1,665 ÷ 6 = 277.5.
- As
PARTITION BY,sum(revenue) over (partition by customer_id)writes each customer's total on every one of their orders. Average that column and you're averaging 20 order rows, so the two customers with 4 orders count 4 times each: 5,625 ÷ 20 = 281.25.
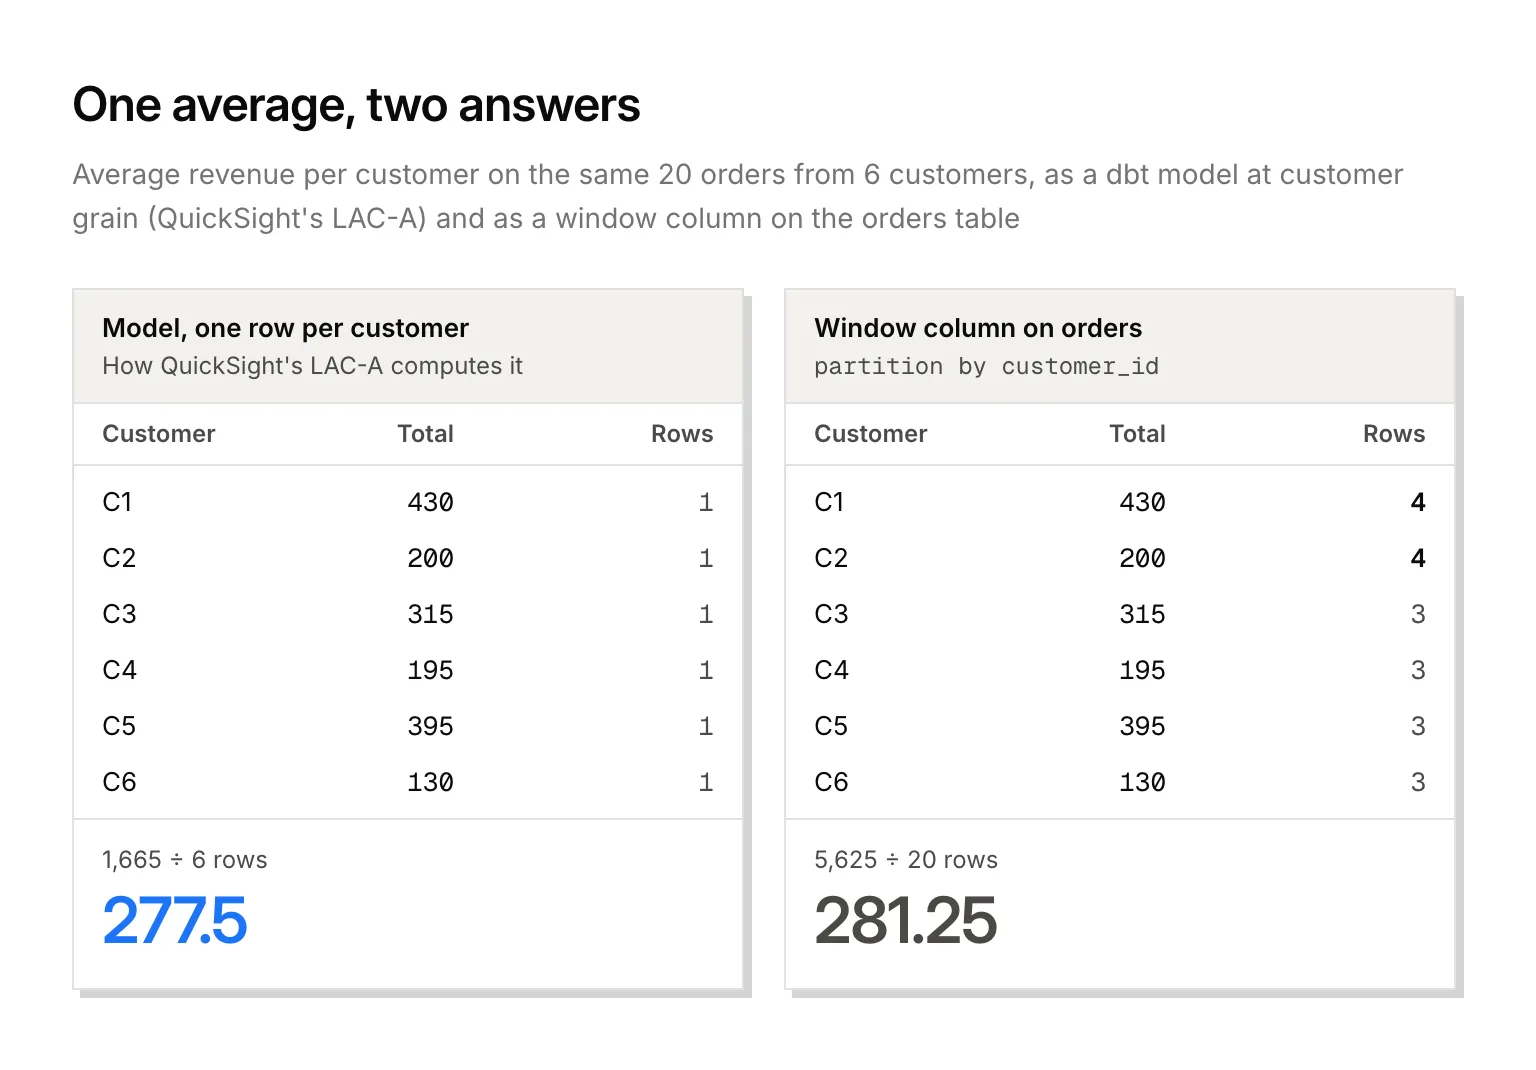
Read the function name, not the brackets: if it ends in Over, it's a window.
How do you rebuild a level-aware calculation in dbt?
For LAC-A, write a model at the grain in the brackets. Ours groups by customer:
select customer_id, sum(revenue) as customer_revenue, min(order_date) as first_order_date
from {{ ref('orders') }}
group by customer_id
Then the outer function becomes the measure. In MetricFlow that's a semantic model on customer_revenue with a measure set to agg: average, and a simple metric on it. It returned 277.5. MetricFlow wants a time dimension on a semantic model that defines metrics, so ours carries each customer's first order date. It adds up all years together, though: if your dashboard filters by year, put the year in the model's grain too (group by customer_id, order_year), or the filter has nothing to act on. It's the same move as Qlik's Aggr(), which our Qlik guide covers.
For LAC-W, a window column in a model fits PRE_FILTER: a model runs before any filter a query adds, and so does PRE_FILTER. We didn't run either level.
How do QuickSight calculated fields convert to SQL and MetricFlow?
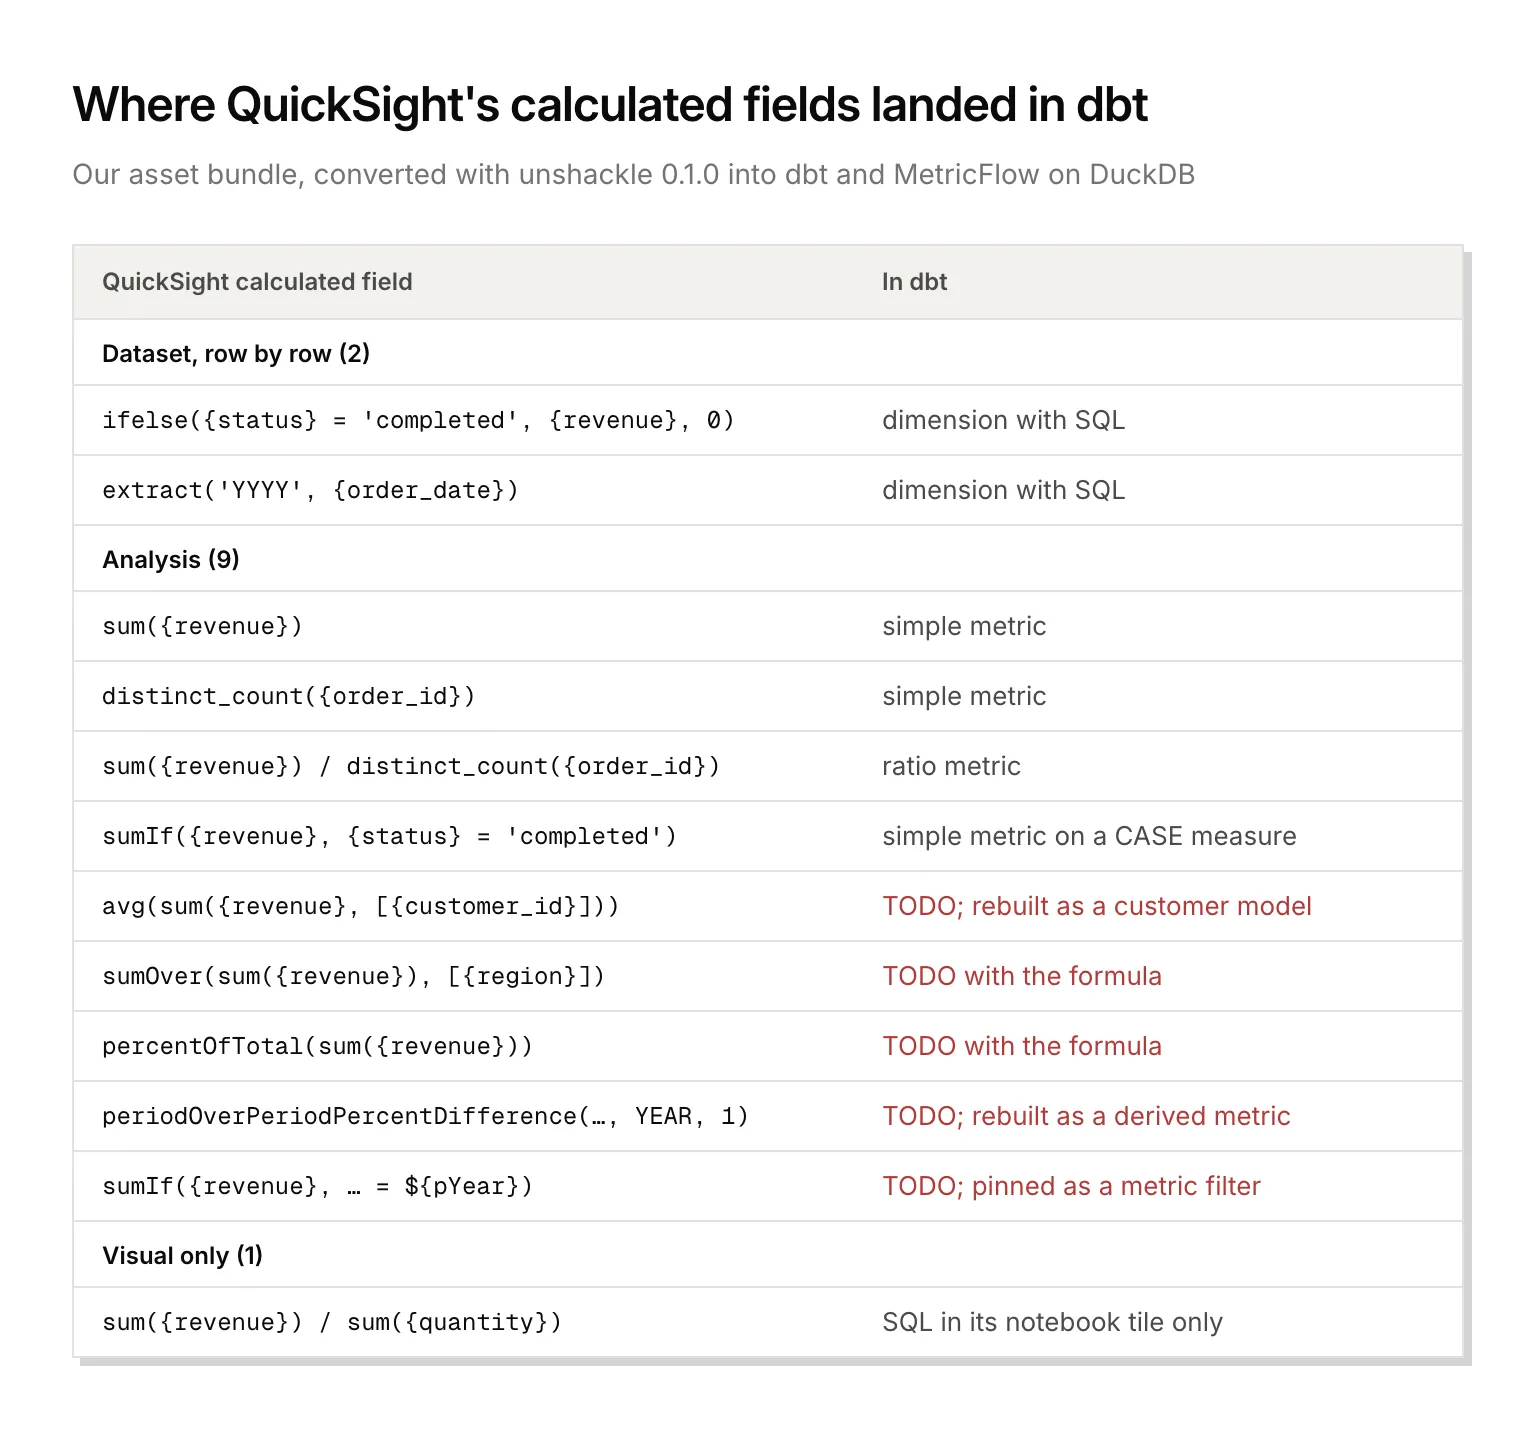
QuickSight keeps calculated fields in three places, and each lands somewhere different in dbt:
- Dataset calculated fields are row by row. Our
ifelse({status} = 'completed', {revenue}, 0)becamecase when status = 'completed' then revenue else 0 end, andextract('YYYY', {order_date})becameextract(year from order_date), both as dimensions with SQL in the model. That's where a QuickSight user ended up anyway, after a reply on AWS's own forum said "Quick Sight does not let you define or preserve dataset-level calculated fields within CloudFormation templates." - Analysis calculated fields that aggregate at the visual's grain became MetricFlow metrics as they are:
sum,distinct_count, the ratio of the two, and asumIfthat became aCASEmeasure. Revenue came to 720 for 2024 and 945 for 2025, and it groups by customer segment through the join to the customers table. - Visual-only calculations, typed into one visual, ended up in that tile's SQL and nowhere else. Ours, revenue per unit, came out as
1.0 * sum(revenue) / nullif(sum(quantity), 0). Promote the ones people reuse to metrics.
One thing you'll hit: the numeric columns quantity and revenue also came out as categorical dimensions. Delete them from the dimensions list unless someone groups by them.
What happens to percentOfTotal, period over period and parameters?
QuickSight computes these after a visual has its rows, or reads them from a dashboard control. unshackle doesn't guess at them: each came out marked TODO(unshackle) with the original formula next to it.
percentOfTotal can cost you a whole table. Our Products table had 5 measures, and one was percentOfTotal(sum({revenue})). The tile came out with no SQL at all, so the 4 measures that convert fine had none either. Move share-of-total fields to their own visual before you export. Share of total is a share of whatever the visual shows, so it stays in the notebook or in your BI tool. So does a sumOver with no level, which QuickSight runs after the visual has its rows by default. Our ThoughtSpot guide has the general rule for table calculations.
Period over period becomes a derived metric. periodOverPeriodPercentDifference on yearly revenue is revenue against revenue with offset_window: 1 year, in dbt's derived metric syntax. It gave 31.25% for 2025, (945 − 720) ÷ 720.
Parameters don't move. Our ${pYear} lives on a dashboard control, so the field that read it had nothing to read. Either pin it as a metric filter ({{ Dimension('orders__order_year') }} = 2025 returned 945) or pass the year when you query, with mf query --where.
Does QuickSight row-level security carry over?
Security carried over better than the formulas did. Our rules dataset, with UserName, GroupName and region columns, became a row filter on the orders table with a full SQL predicate: each person sees the regions their user name or group has a row for, and a rule with no region sees them all. What's left is identity: QuickSight matches its own user and group names, so map them to the emails and groups your identity provider sends. Column-level security on customer_name became a policy file that hides the column from everyone outside the Finance group.
How do you migrate QuickSight dashboards into code?
Export an asset bundle with AWS's StartAssetBundleExportJob: format QUICKSIGHT_JSON, with IncludeAllDependencies so the datasets and data sources come along, and IncludePermissions so each asset's permissions come too. You download a .qs zip from a URL that's valid for 5 minutes, so don't go for coffee first. Only datasets your exported analyses and dashboards use are included. Then:
pip install unshackle
unshackle import quicksight assetbundle-retail-overview.qs
unshackle build quicksight
Run it inside your dbt project and the metrics come out as MetricFlow YAML next to your models, with dashboards as notebooks and security as policy files. Querio reads those dbt and MetricFlow definitions as they are and keeps no second copy, so the 277.5 you rebuilt is the number Querio's agent answers with.
FAQ
Is QuickSight now called Amazon Quick Sight?
Yes. In October 2025 AWS folded QuickSight into Amazon Quick Suite, where the BI part is now called Quick Sight. AWS says existing API integrations keep working, so the asset bundle export is the same.
Do you need QuickSight Enterprise edition to migrate?
Only for the security. Row-level security, column-level security and groups come out of Enterprise edition only.