Business Intelligence
How Do You Migrate Qlik Sense Apps and Load Scripts Into SQL and dbt?
Why a Qlik Sense migration to dbt starts with the load script, and what happens to master measures, set analysis, Aggr() and Section Access on the way.
 Javier BonillaCo-founder & CTO
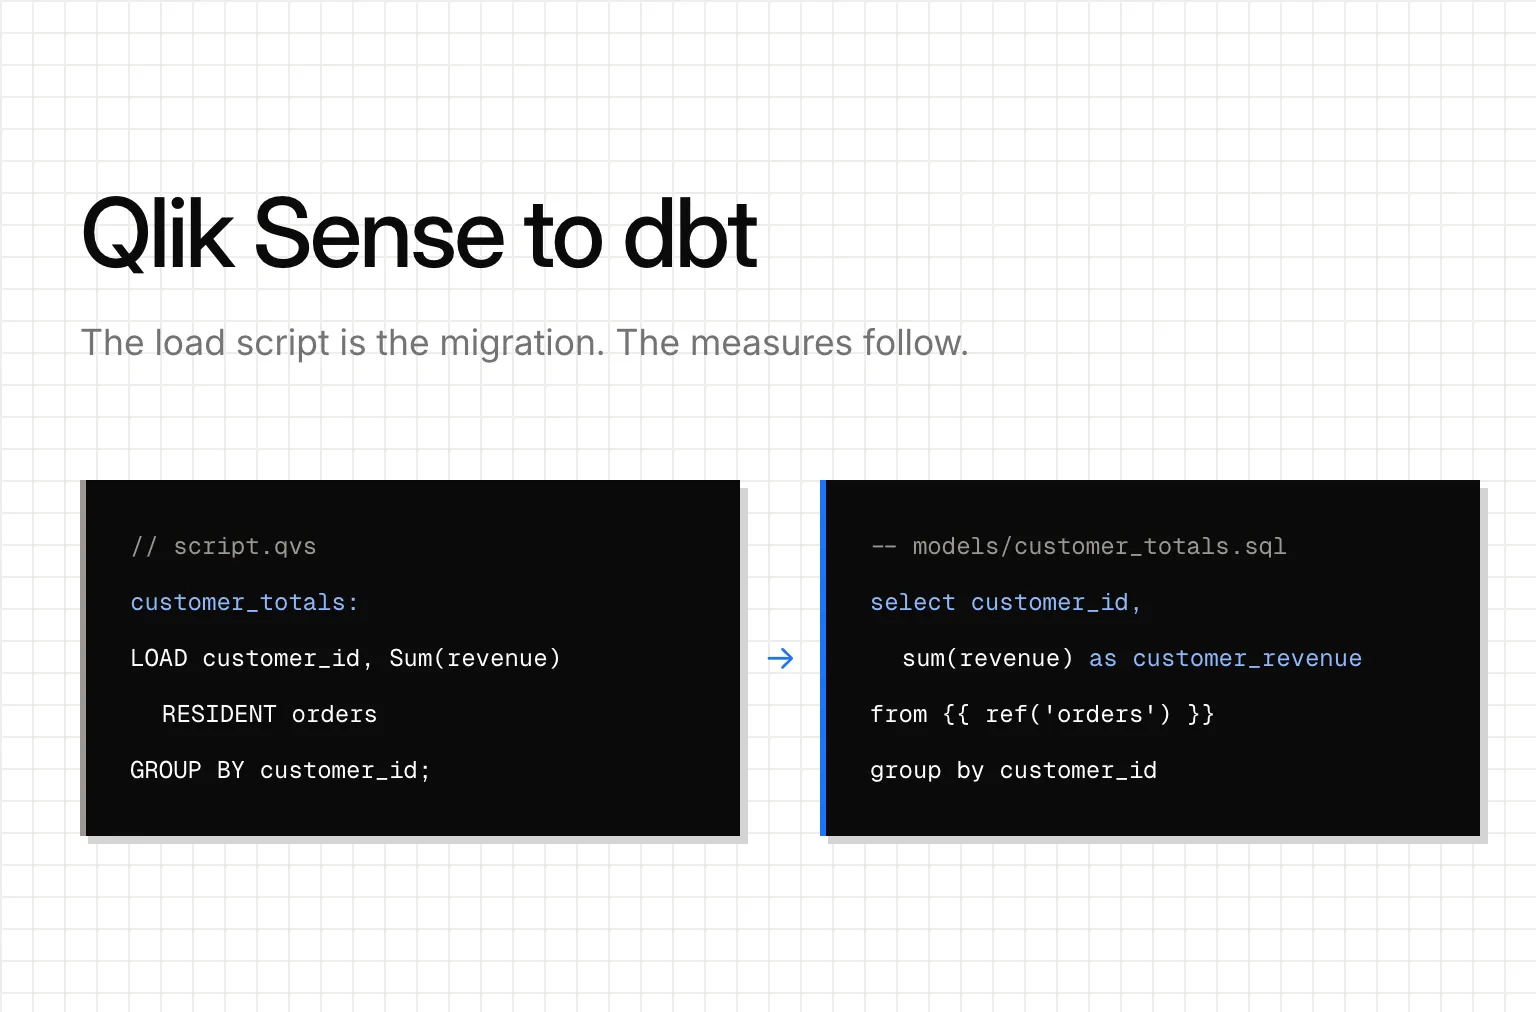
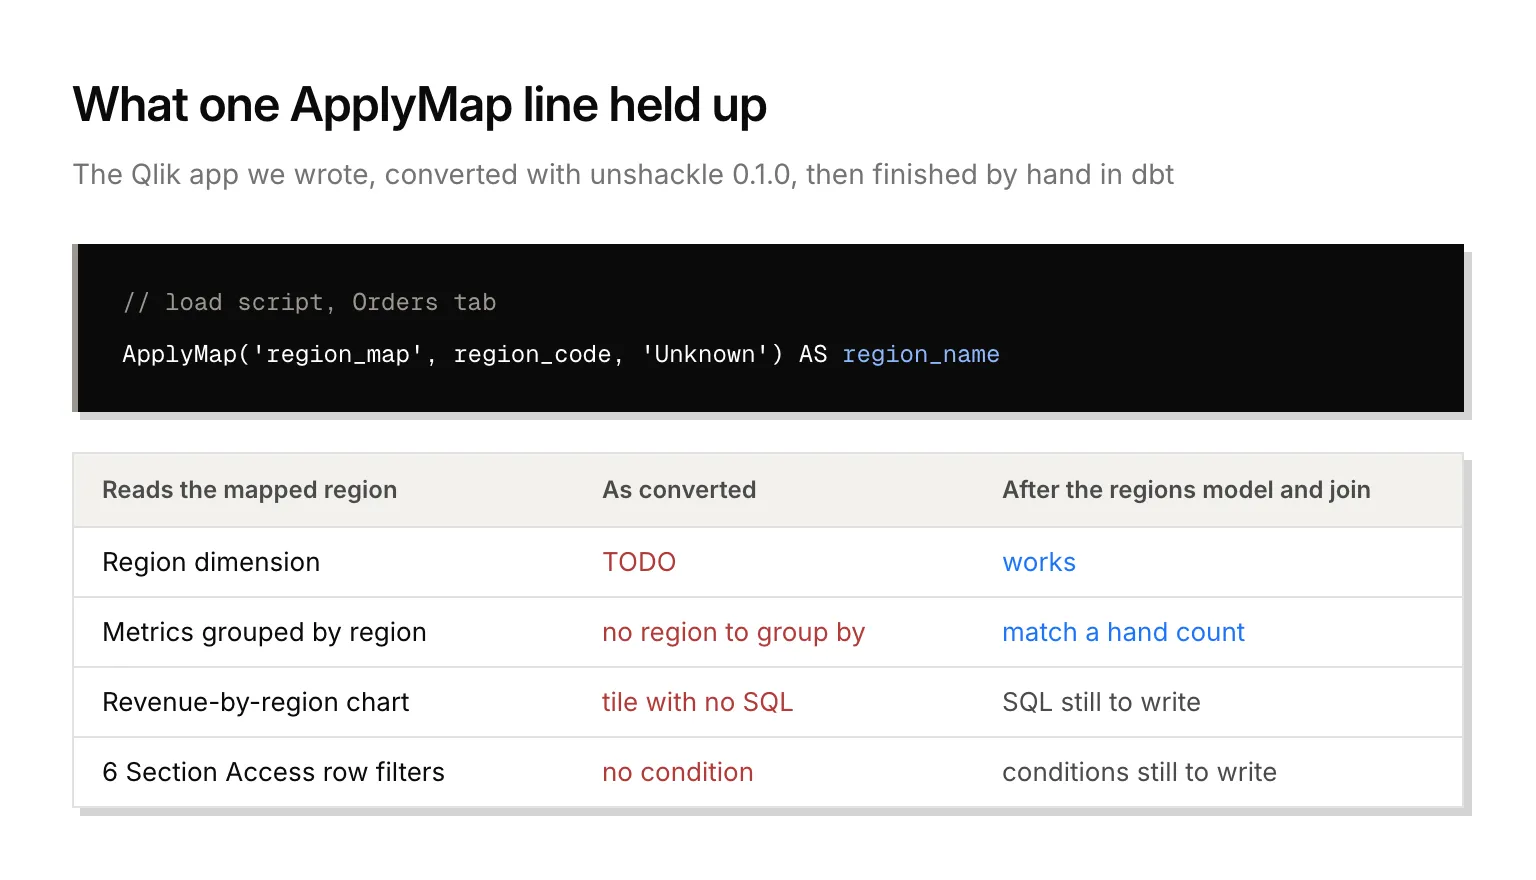
In the Qlik Sense app we moved to dbt, one ApplyMap line in the load script held up the Region dimension, the revenue-by-region chart and every Section Access row filter. No measure had anything to do with it. The load script is the migration: rebuild the tables it builds as dbt SQL models, and most master measures, set analysis included, convert to MetricFlow metrics as they are.
We wrote that app ourselves: 20 invented orders in 3 regions, laid out the way the tests in unshackle lay out a Qlik export. unshackle is the free, open-source CLI we built for moving BI tools into Git (the one our Metabase guide uses too). It rates Qlik Sense "Saved exports", meaning it's tested on exports over a fictional dataset. We converted the app with unshackle 0.1.0 into a dbt project on DuckDB, with dbt-core 1.12 and MetricFlow 0.213.
How do you export a Qlik Sense app for migration?
Run qlik app unbuild from qlik-cli. It writes an app out as separate files: the load script, master measures and dimensions, variables, sheets and their charts, and data connections, with connection passwords left out.
What the folder doesn't hold is the data model: which fields exist, their types, which ones are dates. unshackle reads it from a data-metadata.json file: the app's GET /api/v1/apps/{id}/data/metadata response, saved next to script.qvs. Leave it out and nothing tells the conversion that order_date is a date: all seven of our master measures came out commented out, because MetricFlow needs a time dimension on the model they sit on. With the file added, order_date became a time dimension and five of the seven became live metrics. We wrote that file by hand, in the shape unshackle reads.
How do you rebuild a Qlik load script as dbt models?
The plain parts of a script convert on their own. Our LOAD ... FROM orders.csv became a semantic model on ref('orders'), with a note to land the file in the warehouse as table orders. If(status = 'completed', 1, 0) became a CASE WHEN dimension, Year(order_date) became a year dimension, and the preceding load folded into one orders table.
Two kinds of script table don't, and they're where the work is. For both, rebuild the table as a SQL or dbt model with the same name and fields.
Mapping tables. Our script loads region_map with MAPPING LOAD and adds each order's region with ApplyMap('region_map', region_code, 'Unknown'). In dbt that's a regions table (a seed, or a model on wherever the CSV lands) plus a join. MetricFlow joins on entities, so the regions model gets a primary entity and the orders model a foreign one. This follows dbt's semantic model spec for dbt-core 1.12:
# models/semantic/regions.yml
semantic_models:
  - name: regions
    model: ref('regions')
    entities:
      - name: region
        type: primary
        expr: region_code
    dimensions:
      - name: region_name
        type: categorical

# added to the entities in models/semantic/orders.yml
      - name: region
        type: foreign
        expr: region_code
Don't also set primary_entity: region on the regions model. With both, dbt parse failed with only "Semantic Manifest validation failed."
RESIDENT ... GROUP BY tables. Our script builds customer_totals by grouping the orders table it already loaded, and unshackle wrote that model fully commented out. In dbt it's a plain SQL model:
-- models/customer_totals.sql (dbt SQL model, dbt-core 1.12)
select
    customer_id,
    min(order_date) as first_order_date,
    sum(revenue) as customer_revenue,
    count(distinct order_id) as customer_orders
from {{ ref('orders') }}
group by customer_id
That table is also where the app's Aggr() measure lands. Avg(Aggr(Sum(revenue), customer_id)) is an average over one row per customer, which is what this model holds, so in MetricFlow it's a measure with agg: average on customer_revenue. If your app computes an Aggr() with no script table behind it, the rule is the same: the inner aggregation becomes a dbt model at its grain, and the outer function becomes the measure. A QuickSight level-aware aggregate moves the same way. One catch: MetricFlow wanted a time dimension on this model, so we added first_order_date. Group it by year and you're grouping by each customer's first order year, which isn't what a Qlik chart would show. Only the ungrouped average matches Qlik's number.
With region as a join, the Region dimension worked and every metric could be grouped by it. mf validate-configs reported 0 errors, and mf query by region and year matched a count we did by hand over the same 20 orders, for every metric.
What happens to master measures and set analysis?
They're the part of a Qlik app that converts best. Sums, distinct counts and ratios became MetricFlow metrics, and so did set analysis with listed values. Sum({<status={'completed'}>} revenue) became a simple metric with a filter, in dbt's metric syntax:
- name: completed_revenue
  label: Completed revenue
  type: simple
  type_params:
    measure: completed_revenue
  filter: "{{ Dimension('orders__status') }} = 'completed'"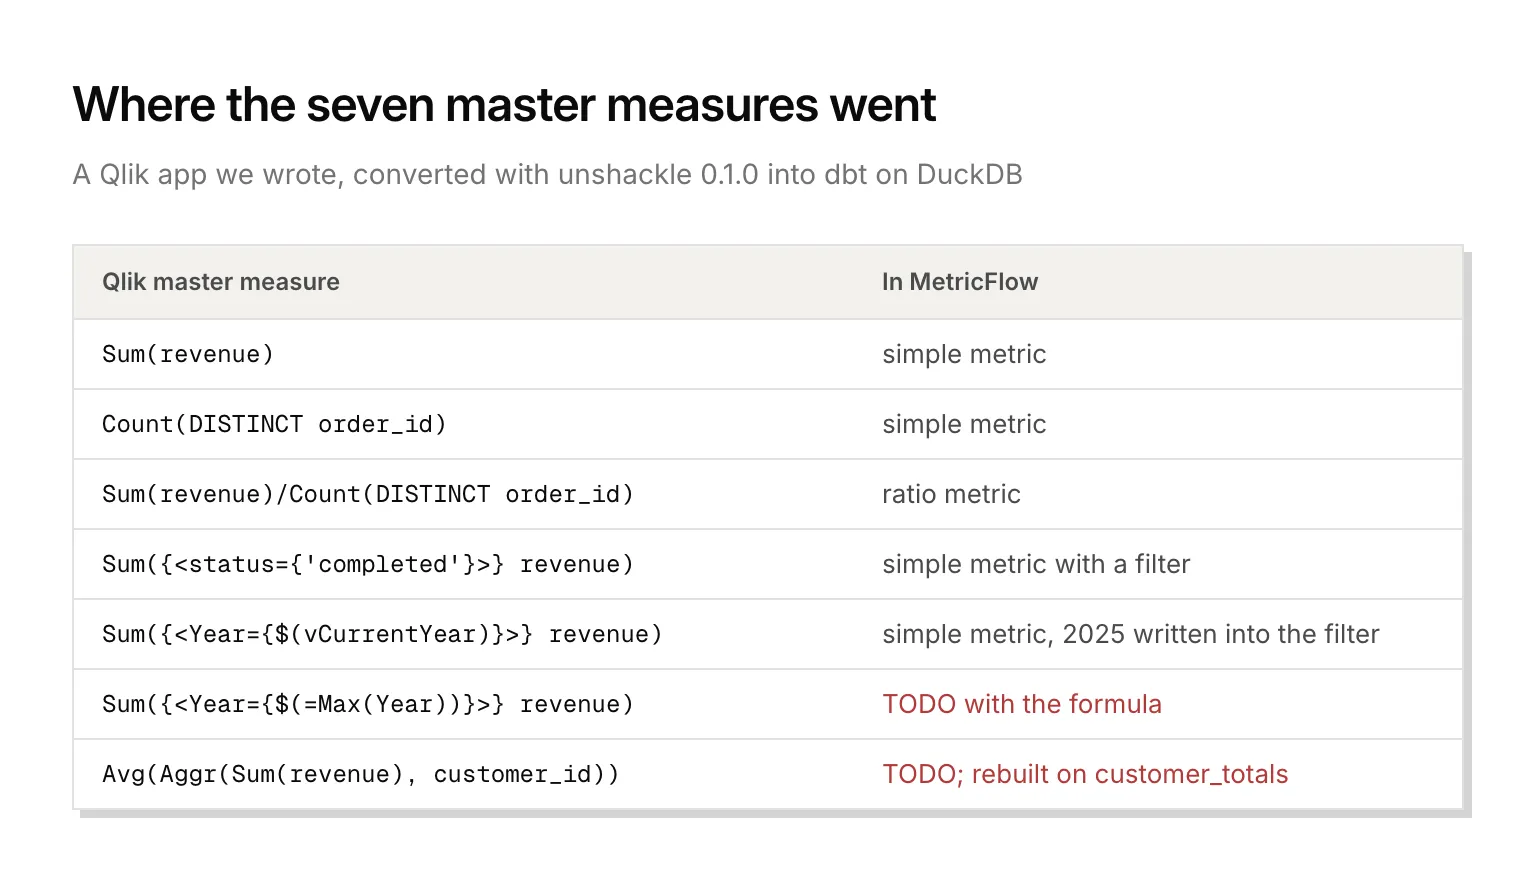
Three things you'll still fix by hand:
- Variables turn into fixed values.
SET vCurrentYear = 2025;was copied into the revenue-this-year metric's filter as the number 2025. In Qlik you change one line each January; in dbt you'd edit every metric that used it. Drop the filter and pick the year when you query. $(=Max(Year))comes back marked. Qlik works it out for each selection, so unshackle left it as aTODO(unshackle)with the formula. Our quick fix, aCASEmeasure with aMAXsubquery, works, butref()wouldn't render inside a measure expression, so it names the table directly and drops out of dbt's lineage. What we'd do: put the latest year in a small dbt model, or filter on it when you query.- Chart expressions and drill-downs. Expressions typed into a chart instead of saved as master measures, like our
Sum(quantity), became SQL in the converted notebook, not metrics, so promote the ones people rely on. Superset has the same split between saved metrics and chart metrics. The drill-down group Region > Product vanished with no TODO. Write your drill paths down before you leave Qlik.
What happens to Section Access?
Section Access, Qlik's row-level security, is where the ApplyMap chain ends. Our reduction field, REGION_NAME, is Upper(ApplyMap(...)), so unshackle wrote 6 row filters, one per user and table, with no condition, each marked with a TODO saying the field isn't traced to a column. The region join gives those filters a column to use, but the conditions are still yours to write. The policy files are plain files, and nothing enforces them until you rebuild them as row access policies in your warehouse. USERID values like RETAIL\BEN are Qlik user ids, so map each one to a user or group in your identity provider.
In Qlik, the data, the logic and the security all live inside one app. After the move each has its own home: the script's tables are dbt models, the metrics are YAML in your repo, and who sees which rows is a rule in your warehouse. Querio reads those MetricFlow definitions as they are, and on Snowflake, BigQuery and Databricks it runs each query as the signed-in person, so the row access policies you rebuilt decide what each person sees, and what their agents see too.
FAQ
Do you need a Qlik Cloud tenant to migrate?
Not for the export. unshackle's API route reads Qlik Cloud apps, and its file route reads an unbuild folder, which qlik-cli also exports from Qlik Sense Enterprise on Windows or a local engine. The data-metadata.json file comes from Qlik Cloud's API, though, and we found no Enterprise route for it, so on Enterprise you'd write it by hand, as we did.
What about QVD files another app writes?
dbt can't read them: QVD is Qlik's own format, and only Qlik Sense and QlikView can write or read it. Migrate the app that writes them first. Same rule as the rest of this guide, one app earlier: rebuild that app's tables as dbt models first, then point this app's models at them.