Business Intelligence
Payments Analytics with AI: Failure, Retry & Recovery Analysis
AI-driven warehouse analysis ranks payment failures, optimizes retry timing, and flags accounts at risk to reduce involuntary churn.

Failed payments don’t just block one charge. They can put MRR, retention, and customer access at risk. I’d look at this in a simple order: separate soft vs. hard declines, measure retry results in fixed windows like 7, 14, and 21 days, and tie failed payments to churn and lost revenue before changing dunning rules.
Here’s the short version:
- Involuntary churn starts when a payment fails and the customer does not keep access.
- Soft declines may recover with the right retry timing. Hard declines usually need a different path.
- A flat retry schedule can miss recovery because decline codes, payment methods, and timing do not behave the same way.
- AI works best when it queries warehouse data with one shared metric model for failure, retry, recovery, and churn.
- The core data usually comes from invoices, payment attempts, subscription status, and customer records.
- The main outputs are simple: failure reasons ranked by lost revenue, retry timing by decline code, recovery by payment method, and accounts at risk of churn.
- This matters because the article notes that involuntary churn makes up about 23% of customer losses, and 5% monthly churn compounds into about 46% annual customer loss.
If I were summarizing the full piece in one sentence, it would be this: use AI to query clean warehouse data so you can see which failed payments are recoverable, which retries bring back the most revenue, and which accounts need action before churn happens.
Quick comparison
| Area | What to focus on | What AI helps show |
|---|---|---|
| Failure analysis | Soft vs. hard declines, decline codes, lost MRR | Why payments fail and where revenue is at risk |
| Retry analysis | Attempt number, hours since failure, day of week | Which retry timing works by decline type |
| Recovery analysis | 7/14/21-day recovery windows, recovered revenue | Which failures come back and when |
| Churn analysis | Failed payment to cancel timeline | Which accounts may churn from non-payment |
| Workflow | Dashboards, monitors, notebooks | What changed and what to do next |
Bottom line: I’d treat payment recovery as a measurement problem first, then a retry-rule problem second.
What to measure before changing your retry strategy
Changing retry timing without a shared metric baseline is how teams end up fixing the wrong problem. Before AI steps in to improve retry strategy, everyone needs to work from the same metric model. Those definitions become the input layer for AI analysis of failure, retry, and recovery patterns.
Core payment metrics to standardize
Start by standardizing these core metrics: failed-payment rate, retry success rate, recovery rate across fixed windows like 7, 14, and 21 days, recovered revenue (the MRR impact of successful payment recoveries), and involuntary churn rate. Each one needs a single definition. Not one version in a dashboard, another in a notebook, and a third in an analyst’s SQL.
When involuntary churn is more than 30% of total churn, the payment stack should be the first place to look [1]. Recovery rate also needs a fixed observation window every time. A payment recovered on day 19 tells a very different story than one recovered on day 3. Mix them together, and you hide what’s doing the work.
A governed semantic layer sets these metrics once and keeps them steady across Snowflake, BigQuery, or Postgres. That way, dashboards, notebooks, and AI queries all read from the same definitions.
That setup only holds if the warehouse model can support it.
The warehouse tables and fields you need to model
Once the metrics are locked in, map them to the warehouse objects that produce them. For retry analysis you can trust, the smallest useful model joins four source objects: invoices, payment attempts, subscription status, and customer dimensions. Decline codes and payment method type belong on the payment attempt record, and they drive both retry analysis and decline analysis.
You also need to track created_at, failed_at, retried_at, recovered_at, and canceled_at. These timestamps are what let you calculate recovery windows and involuntary churn. If they’re missing, recovery windows fall apart, and first attempts start to blur into retries.
| Table | Key Fields | Why It Matters for AI Analysis |
|---|---|---|
| Invoices | invoice_id, amount, created_at, status |
Base record for every payment event |
| Payment Attempts | attempt_id, invoice_id, decline_code, payment_method, failed_at, retried_at, recovered_at |
Drives retry sequencing and decline-code root-cause analysis |
| Subscription Status | subscription_id, customer_id, status, canceled_at |
Links payment outcomes to involuntary churn timing |
| Customer Dimensions | customer_id |
Connects payment outcomes to the customer record |
Add refund and dispute tables too if you want to measure net recovered revenue [1].
Why static dunning rules miss recovery opportunities
::: @figure 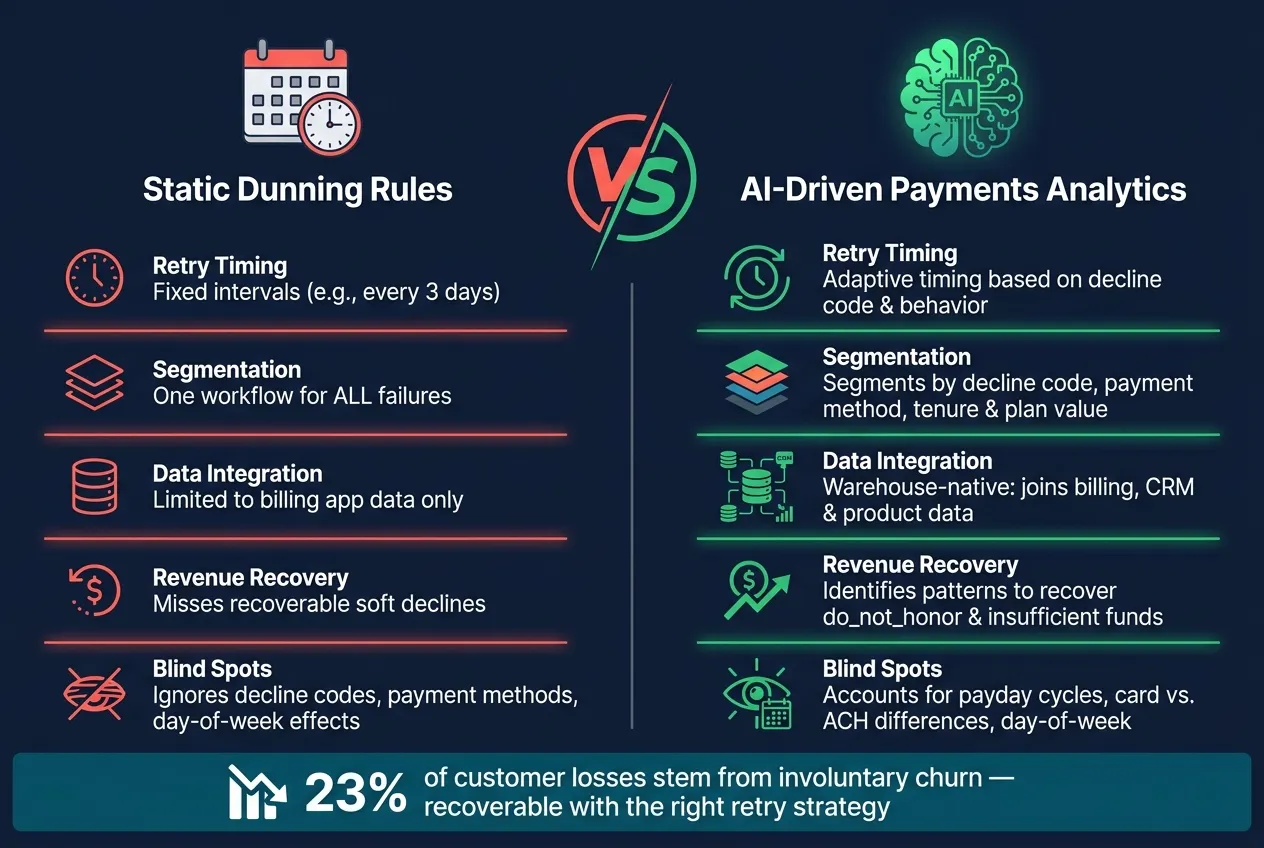 {Static Dunning Rules vs. AI-Driven Payments Analytics}
:::
{Static Dunning Rules vs. AI-Driven Payments Analytics}
:::
Once failure, retry, and recovery are set up in a standard way, the next step is simple: figure out which retry rules bring money back.
This is where static dunning starts to fall short. A single retry schedule for every failed payment sounds neat on paper, but payment failures don't all behave the same way. Insufficient funds, gateway errors, fraud flags, and do_not_honor responses each recover on their own timeline. So one retry rule can help in one case and work against you in another.
Where fixed retry rules break down
Fixed schedules ignore failure type. Insufficient funds, expired cards, fraud flags, and do_not_honor responses all show different recovery patterns [1]. If you retry all of them on the same interval, you're not aiming for the moment when recovery is most likely. For instance, retrying an insufficient-funds failure after a common payday can beat a flat 3-day cycle [1].
Static rules also miss differences between customers and payment methods. Once you segment by decline code, payment method, customer tenure, and plan value, you start to see which failures are likely to recover and which ones need a different move [1][2]. That's the point where fixed rules stop being enough, and warehouse-native analysis starts to pay off.
There's another blind spot too: day-of-week effects. The same retry can perform one way on a Tuesday and another way on a Friday, which static schedules don't account for [1].
Static dunning rules vs. AI-driven payments analytics: a comparison
The difference is easiest to see side by side.
| Dimension | Static Dunning Rules | AI-Driven Payments Analytics |
|---|---|---|
| Retry timing | Fixed intervals, such as every 3 days | Adaptive timing based on decline code and behavior [1] |
| Segmentation depth | One workflow for all failures | Segments by decline code, payment method, customer tenure, and plan value [1][2] |
| Data integration | Limited to billing app data | Warehouse-native; joins billing, CRM, and product data [2] |
| Revenue recovery | Misses recoverable soft declines | Identifies patterns to improve recovery of do_not_honor and insufficient funds failures [1] |
Warehouse-native analysis shows which combinations of decline code, payment method, and customer segment recover best. The next step is to measure those patterns directly in warehouse data.
How AI analyzes failure, retry, and recovery patterns
Once you have standard payment metrics in place, AI can dig into warehouse data and separate failures you can recover from revenue that's likely gone for good. If an analytics agent queries Snowflake, BigQuery, or Redshift directly, it can run inspectable SQL or Python against your transaction tables and group failures by decline code, payment method, retry interval, and customer segment. That added context helps move the analysis from a pile of failed transactions to a clear view of recovery.
Decline-code breakdowns and root-cause analysis
The first step is to split recoverable soft declines from hard declines [1]. If you lump them together, you blur the actual recovery opportunity.
A strong AI output here is a ranked list of failure reasons based on lost MRR and month-over-month change. Because the query lives in a reactive notebook, your team can inspect it, edit it, and trace how the result was produced.
Recovery-rate analysis by retry timing and payment method
After failures are grouped by root cause, the next step is figuring out which retry windows bring back the most revenue. AI looks at recovery rate by attempt number, hours since the first failure, day of week, and payment method.
The goal isn't to fire off more retries. It's to recover more revenue from each failed payment.
For insufficient_funds declines, retrying three days later can work better than using the same flat schedule for every case [1]. Hard declines shouldn't go through the same retry path as soft declines. Payment method matters too. Card failures and ACH failures often recover on different schedules.
An AI agent can produce a notebook chart that shows recovery probability by hour since failure, split by decline code and payment method. That gives your team something concrete to work from when adjusting dunning settings. It's not a guess. It's a decision backed by warehouse data.
Analytics patterns, required data, and AI outputs: a comparison
The table below shows the most common payment analyses, the warehouse data each one needs, and the output an AI agent usually produces.
| Analysis Type | Required Warehouse Data | Key Metrics | Typical AI Output |
|---|---|---|---|
| Decline-code analysis | Transaction logs, issuer response codes | Auth rate, % soft vs. hard declines, lost MRR by code | Ranked failure reasons with MoM change, root-cause summary |
| Retry timing optimization | Retry attempt history, timestamps | Recovery rate by attempt #, hours since failure, day of week | Recommended retry timing by decline code |
| Payment-method recovery | Customer billing profiles, gateway data, card metadata | Success rate by card brand, card vs. ACH, card updater impact | Segmented recovery charts, failure alerts by method |
| Churn-risk scoring | Failed-payment signals, usage logs, billing status | At-risk accounts for proactive outreach |
Those patterns then feed dashboards, alerts, and retry-setting changes.
Putting payments analytics into dashboards, notebooks, and workflows
Dashboards and scheduled monitors teams actually use
Once you know which failed payments are likely to recover, the next step is simple: put those signals somewhere finance and payments teams can use them fast.
A good payments dashboard brings failed-payment risk, recovery, and churn exposure into one view. The core metrics are:
- Authorization rate
- Recovery rate
- Revenue at risk
- Decline-code mix
- Recovery by retry attempt
- At-risk accounts sorted by exposure
That’s what turns warehouse analysis into something useful. If a team can’t act on the data, it’s just another chart sitting in a folder.
Querio connects straight to Snowflake, BigQuery, Redshift, and Postgres, so dashboards stay tied to live warehouse data. Reactive notebooks refresh charts when SQL changes, and dashboards are built right from those notebooks.
Then comes the shift from reporting to monitoring. If failed-payment volume jumps, a scheduled monitor can compare authorization rate against a rolling baseline and flag the change within minutes.
AI-assisted workflows for investigation and action
Once something gets flagged, the workflow should show what changed. Maybe it was a certain decline code. Maybe a payment method started failing more often. Maybe the retry window stopped working as expected.
From there, the system should point to the next move: adjust retry timing, suppress retries on low-value accounts, route high-MRR failures to customer success, or trigger a payment-method update request.
In Querio, these investigations run on live warehouse data through encrypted, read-only connections. And every SQL step is inspectable before anyone acts on the result. That matters because teams need to trust what they’re seeing. It also means the same investigation can be reused the next time that failure pattern shows up.
The shortest path to better recovery analysis
The fastest way forward is to put the analysis into daily work. Move decline-code breakdowns, retry-timing findings, and at-risk account signals into dashboards, scheduled monitors, and reusable notebooks that finance and payments teams can use directly.
The key point is easy to miss: measure retry strategy by actual recovery outcomes, not by how many retries fired.
FAQs
::: faq
How do I tell soft declines from hard declines?
Use the decline codes you see to sort each failed transaction into a soft or hard decline. Then measure recovery based on when the retry happened.
A decline-code breakdown helps you spot which codes tend to lead to successful retries and which ones keep failing. It also lets you compare recovery rate by payment method and by retry timing.
Keep the metric definition and SQL easy to inspect so the classification stays auditable and consistent. :::
::: faq
What data do I need to analyze payment recovery with AI?
You need a single warehouse dataset that brings together transaction history, customer behavior, and billing outcomes.
That means pulling in event data such as checkout attempts, payment requests, and success or failure status. It should also include customer attributes, retry attempts, decline codes, and the timing of communications or card-updater events.
With all of that in one unified, governed schema, AI can show why transactions fail and which recovery moves actually work. :::
::: faq
How should I measure whether retries are actually working?
Track recovery after each retry attempt using one steady definition of failure and recovery. Do that in your warehouse, not through CSV exports and one-off snapshots.
Backtest retry timing and payment method against past normal behavior. Then focus on large, persistent shifts, not random blips. Every alert or investigation should include the segment behind the change, plus the SQL or Python used to calculate recovery rate and retry timing so the work can be checked line by line. :::