Mastering Sales Forecasting Methodologies for Accurate Revenue
Explore key sales forecasting methodologies from classic models to AI. Learn how to choose and implement the right approach for accurate revenue predictions.
https://www.youtube.com/watch?v=j22tLUQQDh4
published
Outrank AI
sales forecasting methodologies, revenue forecasting, sales analytics, predictive modeling, business forecasting
38e05fad-cfa8-4308-93e1-f3135efb37c2

Think of a sales forecast as the GPS for your business. It's the set of tools and techniques you use to chart a course, predicting where your sales revenue is headed. Some methods are like looking in the rearview mirror, relying on past performance. Others are like checking the weather forecast, factoring in current market conditions. The most advanced are like satellite navigation, using powerful data models to find the optimal path forward.
Why Sales Forecasting Methodologies Matter

Let's be blunt: solid sales forecasting is the difference between strategic planning and just guessing. It’s what separates proactive, data-informed decisions from reactive, gut-based moves. Without a structured method, you’re essentially flying blind.
The numbers back this up. It's a bit shocking, but research shows that only 43% of sales leaders feel they can forecast with an accuracy of within 10%. That’s a huge margin of error that can cascade across the entire business.
This isn't just a sales problem. An accurate forecast is the bedrock for everything else—it dictates how you allocate your budget, sets realistic targets for your reps, and gives leadership the financial clarity to manage risk and justify new investments.
The Two Core Approaches to Forecasting
Fundamentally, every forecasting method boils down to one of two approaches. Getting a handle on this basic split is the first step to picking the right tool for the job.
Quantitative Forecasting: This is all about the numbers. It uses your historical sales data and runs it through statistical models to find patterns and project future results. This method is objective, repeatable, and perfect for businesses sitting on a good amount of clean, historical data.
Qualitative Forecasting: This approach is more about human insight. It leans on the judgment and opinions of your sales team, industry veterans, and market analysts. It's incredibly valuable when you’re a startup with no sales history or you’re launching a new product into uncharted territory.
A great forecast is rarely built on a single method. The most successful organizations often create a hybrid model, blending the objective rigor of quantitative analysis with the on-the-ground context provided by qualitative insights.
This combination gives you the best of both worlds. Your predictions stay grounded in what has actually happened, but you also account for the forward-looking intelligence that only people can provide.
To help you get a clearer picture of the landscape, here's a quick breakdown of the main methodology categories.
Overview of Sales Forecasting Methodology Types
Methodology Category | Core Principle | Best For | Example Method |
|---|---|---|---|
Qualitative (Judgmental) | Relies on expert opinions and subjective insights from sales teams or market experts. | New companies, new products, or markets where historical data is scarce or unreliable. | Opportunity Stage Forecasting, Delphi Method |
Quantitative (Time-Series) | Uses past sales data to identify trends, seasonality, and patterns over time. | Stable businesses with a significant amount of consistent historical sales data. | Moving Average, Exponential Smoothing |
Quantitative (Causal) | Connects sales outcomes to specific internal and external factors (e.g., ad spend, economic indicators). | Understanding the 'why' behind sales figures and modeling the impact of specific drivers. | Regression Analysis |
Quantitative (Machine Learning) | Leverages complex algorithms to analyze vast datasets and identify non-linear patterns. | Businesses with large, complex datasets seeking high accuracy and predictive power. | Neural Networks, Gradient Boosting Machines |
Each of these categories contains specific techniques, which we'll explore in detail. The key is to understand that they aren't mutually exclusive; the most powerful forecasting systems often layer these approaches.
Building a Foundation for Growth
Mastering these methods isn’t just a numbers exercise; it’s a massive strategic advantage. When you can trust your forecast, you can make confident decisions that fuel real growth. Everything from managing inventory and planning marketing campaigns to hiring new talent and expanding into new markets becomes more precise and effective.
This guide will walk you through the most common sales forecasting methodologies, helping you turn raw data into a reliable roadmap for the future.
Exploring Traditional Sales Forecasting Methods

Before AI and machine learning became the talk of the town, businesses had a trusty toolkit of sales forecasting methods. These traditional approaches have been the bedrock of business strategy for decades, built on two core pillars: past performance and human expertise. They haven't gone away—in fact, they're still incredibly valuable, especially for businesses with stable sales cycles or those just getting their forecasting process off the ground.
You can think of these methods as falling into two main camps. The first, known as time-series analysis, is all about looking backward. It treats historical sales data as the best crystal ball for predicting the future. The second, qualitative forecasting, looks inward, tapping into the street-smart wisdom and gut feelings of the sales team and other experts. Getting a handle on both is the first step toward building a truly robust forecasting system.
Using Past Performance as a Guide
What's the most natural way to guess what's coming next? Look at what just happened. That’s the entire idea behind historical forecasting, a cornerstone of time-series analysis. This quantitative approach runs on a simple but surprisingly powerful assumption: history tends to repeat itself. This makes it a go-to for established companies who’ve seen it all before.
Think about a big consumer goods company. They know, without a doubt, that sales of gift sets and seasonal items will surge around the holidays. By looking at the sales data from the past five Novembers and Decembers, they can map out a reliable baseline for the upcoming season. It's a straightforward, data-first approach that gets you a solid number, fast.
There's a reason this method has stuck around. It’s one of the most foundational ways to forecast, and a staggering 65% of Fortune 500 firms still use it as their anchor. When they blend this historical data with newer technologies, they can achieve a hybrid accuracy of up to 92%. You can check out more proven tactics for historical sales forecasting on Akucast.
Within this category, a couple of techniques are especially popular:
Moving Averages: This method is great for cutting through the noise. It smooths out the random peaks and valleys in your sales data to show you the real underlying trend. For example, a three-month moving average simply takes the average sales of the last three months to predict the next. It’s perfect for getting a sense of the general direction your sales are headed, but it can be a bit slow to react to sharp, unexpected turns.
Exponential Smoothing: This is like a smarter, more agile version of the moving average. It also looks at past data, but it gives more weight to what happened recently. This makes the forecast much more responsive to new information, so you're not caught flat-footed by a sudden change in the market.
Relying on Human Expertise and Judgment
Numbers tell a story, but not always the whole story. That’s where qualitative sales forecasting comes in, filling the gaps with human insight, hard-won experience, and good old-fashioned intuition. These methods are absolutely essential when you don't have much historical data to work with—like when you're launching a brand-new product or expanding into an untested market.
The Big Idea: Qualitative methods trade statistical precision for real-world context. They help answer the "why" and "what if" questions that raw data can't, weaving the nuances of customer conversations and market shifts into the forecast.
This approach is less about crunching numbers in a spreadsheet and more about creating a structured way to gather and make sense of expert opinions.
Common Qualitative Forecasting Techniques
Let’s look at two of the most common ways this human-centric approach plays out.
Opportunity Stage Forecasting
This is a classic for a reason. It ties your forecast directly to the health and momentum of your sales pipeline. The whole system is based on assigning a probability of closing to each stage of your sales process.
For instance, a new lead in the "Qualification" stage might get a 10% probability, while a hot prospect in the final "Negotiation" stage gets an 80% chance. To get your forecast, you just multiply each deal's potential value by its stage probability and add it all up.
Strength: It’s incredibly simple to understand and is directly connected to what your reps are doing every single day.
Weakness: The biggest pitfall is that it often ignores how long a deal has been sitting in a stage. An opportunity that’s been stuck in "Negotiation" for three months is way riskier than one that just got there yesterday, but this method treats them both the same.
The Delphi Method
Ever heard of "wisdom of the crowd"? The Delphi Method is the corporate version of that. It brings together a panel of experts—think senior sales leaders, seasoned industry analysts, maybe even economists—to arrive at a consensus forecast.
Here’s how it works: a facilitator anonymously asks each expert for their forecast. Then, they compile all the anonymous predictions and share the summary with the group. The experts see where they stand relative to their peers and can revise their forecast in a second round. This process repeats until the group’s predictions start to converge around a single number.
Strength: It's brilliant for sidestepping groupthink and preventing one loud, dominant personality from swaying the whole forecast. It creates a more balanced prediction from subjective opinions.
Weakness: This can be a very slow, drawn-out process. And at the end of the day, the accuracy of your forecast is only as good as the experts you pick for your panel.
Getting Serious with Quantitative Forecasting Models
While many forecasting methods lean on past performance and a bit of human intuition, quantitative models are all about the cold, hard data. Think of it this way: instead of navigating with a hand-drawn map based on memory, you're using a GPS that crunches real-time data to find the best route.
These models are built to strip away the guesswork. They don't care about a sales rep's optimism or a manager's gut feeling; they only care about the mathematical patterns hiding in your numbers. This commitment to data is precisely why quantitative forecasting is becoming the go-to for businesses that can't afford to be wrong.
Pinpointing What Drives Sales with Regression Analysis
One of the most powerful tools in the quantitative toolbox is regression analysis. This isn't just about looking at past trends; it's about digging into the why behind your sales numbers. It helps you draw a clear, statistical line between your sales (the dependent variable) and all the things that influence them (the independent variables).
Let’s say a SaaS startup wants to know what really moves the needle on its monthly recurring revenue (MRR). Regression analysis can show them exactly how a $10,000 increase in ad spend leads to a 5% bump in new sign-ups. It connects the dots between specific actions and concrete results, making your forecast a powerful tool for planning your next move.
The model can factor in variables like:
Marketing Spend: How does your ad budget directly impact new leads and closed deals?
Website Traffic: Is there a measurable relationship between unique visitors and new customers?
Team Headcount: What's the real revenue impact of hiring another salesperson?
By putting a number on these relationships, regression gives you a formula for the future. It helps answer critical questions like, "If we double our marketing budget next quarter, what can we realistically expect to see in revenue?"
Factoring in the Bigger Economic Picture
Sometimes, your sales are at the mercy of forces far beyond your company's walls. This is where econometric models enter the scene. They're a souped-up version of regression that brings broad macroeconomic indicators into the equation, giving you a much wider view of the market.
For a construction supply company, sales are obviously tied to the housing market. An econometric model would pull in data points like:
Current interest rates
New housing starts
Consumer confidence reports
Unemployment figures
This approach creates a forecast that’s tuned into the overall economic climate, making it far more robust when the market shifts. It helps you see the forest, not just the trees, and understand how external pressures might affect your bottom line.
By mixing your internal data with these external market signals, quantitative models give you a sophisticated, evidence-based way to predict what's coming. Forecasting stops being a reactive chore and becomes a proactive part of your strategy.
The Real-World Impact of Statistical Models
The shift toward quantitative methods isn't just academic; it delivers real results. The adoption of machine learning, for instance, has been shown to slash forecast errors by 25-50%. For short-term outlooks, time series analysis can hit an accuracy of 85%, while regression shines at connecting sales to specific drivers like marketing spend.
It's no surprise that in major markets like the US and EU, 70% of enterprises now rely on these techniques. And when you combine quantitative models with your internal pipeline data, these hybrid approaches can achieve an accuracy of up to 88%, helping to power an estimated $50T in annual global commerce. For more on this, you can see how professionals at ForecastPro are using statistical models.
While regression is great for understanding causal links, another crucial quantitative method is time-series analysis, which focuses purely on finding patterns in your historical data over time. You can dive deeper into this specific approach in our guide on how to do time series analysis. By grounding your strategy in these data-driven models, you're building your business plans on a foundation of objective reality, not just wishful thinking.
The Power of Multivariable and AI Forecasting
As markets get more complicated, old-school sales forecasting methods just don't cut it anymore. They often struggle to keep up with the tangled web of factors that actually drive sales today. This is where the more sophisticated models come into play, moving beyond simple, straight-line predictions to truly grasp the complexity of your business world.
These advanced methods are a massive step up. Instead of just looking at past sales in a bubble, they analyze dozens of variables all at once—everything from social media chatter and competitor price changes to supply chain hiccups and website traffic. Welcome to the world of multivariable and AI-powered forecasting.
Seeing the Whole Picture with Multivariable Analysis
Think about a simple forecast like trying to predict rain by only looking at the clouds. Multivariable analysis is like having a full-blown weather station that tracks humidity, wind speed, barometric pressure, and temperature all at the same time. You get a much richer, more accurate picture because you understand that sales are rarely driven by just one thing.
This approach shines by blending historical sales data with customer behavior, social trends, and economic indicators, which can improve accuracy by as much as 35% over simpler methods. In fact, it's predicted that 60% of global tech and retail companies will be using it by 2025. By tapping into machine learning to spot influencers you might otherwise miss, this method dramatically reduces blind spots. While you have to be careful not to get overwhelmed by data, AI-driven tools can help build solid models with up to 92% accuracy, giving leaders the confidence to make quick decisions when things get turbulent.
For example, an e-commerce company could use a multivariable model to see how a dip in web traffic, a competitor's flash sale, and a string of negative product reviews on Twitter will all combine to affect next month's revenue. It connects seemingly random dots into a single, clear story.
Unleashing Predictive Power with AI and Machine Learning
While multivariable analysis is great at identifying relationships you already know about, Artificial Intelligence (AI) and Machine Learning (ML) take things to a whole new level. These systems can uncover hidden patterns and complex trends that a human analyst would never spot. They’re built to learn from data, getting smarter and more accurate over time.
AI doesn't just analyze the data you give it; it discovers the relationships you didn't even know existed. It can identify subtle correlations between seemingly unrelated data points, turning information noise into a predictive signal.
An ML model might discover, for instance, that customers from a certain city who visit your pricing page three times in a week are 90% more likely to buy—but only if they found you through an organic search. It’s almost impossible to uncover that kind of granular insight with traditional methods. For companies ready to tap into these algorithms, looking into the most advanced predictive tools can make a huge difference in forecasting precision.
Key Strengths of Advanced Forecasting Models
The biggest advantage of these forecasting methods is their incredible accuracy, especially when markets are volatile or changing fast. They thrive on complexity and can adjust on the fly as new data rolls in.
Here’s what really makes them stand out:
Pattern Recognition: AI can dig through enormous datasets to find faint, predictive patterns that are totally invisible to the human eye.
Adaptability: ML models aren't set in stone. They constantly retrain themselves on new information, which means your forecast gets smarter with every sales cycle.
Holistic View: By pulling in dozens of internal and external variables, these models give you a complete and realistic view of everything that could possibly drive sales.
AI and ML models aren't just for huge corporations anymore. Modern BI platforms are making this kind of power more accessible, helping businesses of all sizes build more resilient, data-driven strategies. You can dive deeper into how AI improves KPI forecasting accuracy and see what it could mean for your own business planning.
How to Choose and Implement the Right Methodology
Knowing the different forecasting methods is one thing; putting them to work effectively is another challenge entirely. The real secret is picking the right tool for your specific job. What works for a Fortune 500 company with decades of data won't work for a startup sketching out its first sales projections.
It's not about finding the most sophisticated model, but the most fitting one. Your business stage, the quality of your data, and the stability of your market will be your guide.
Aligning Your Method with Your Business Reality
Before you dive into building a model, you need to take an honest look at your company's situation. Answering a few straightforward questions will point you toward the most realistic and effective methodology.
Consider these three factors:
Your Business Stage: Are you just starting out, or are you a mature business with predictable revenue streams? An early-stage company will likely rely on qualitative methods like Opportunity Stage forecasting. A well-established one can tap into historical data for time-series analysis or even machine learning.
Your Data Quality: How clean and reliable is your historical sales data? If your CRM is a single source of truth, you're in a great position for quantitative methods. If your data is messy or sparse, you'll have to start with simpler, more qualitative approaches.
Your Market Stability: Is your industry predictable, or is it constantly shifting? Stable markets are perfect for historical analysis. Volatile ones, on the other hand, often demand the more dynamic and adaptive power of AI-driven forecasting.
The whole point is to build a forecast you can actually use and maintain. Choosing a model that requires data you don’t have or expertise you can't access is a recipe for frustration and bad predictions.
This decision tree gives you a simple starting point. It all begins with your data.
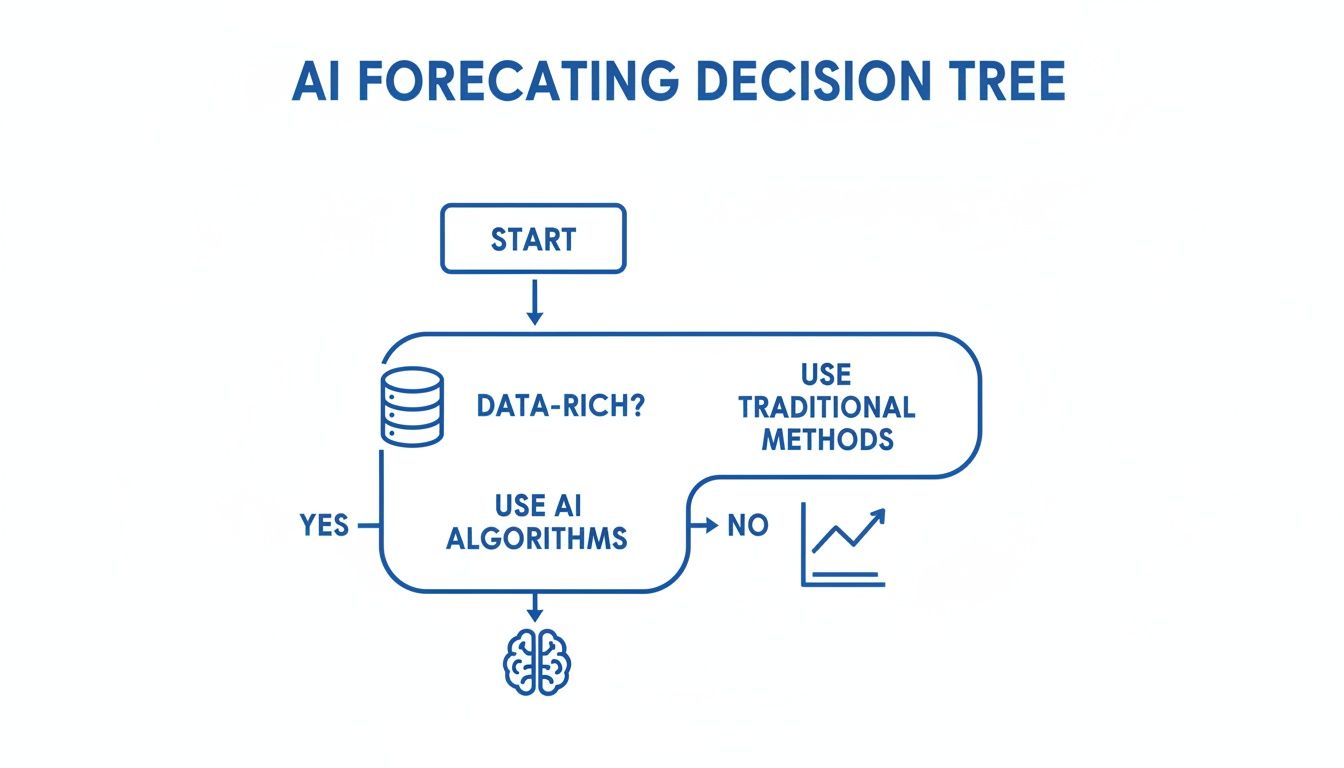
As the graphic shows, having rich, clean, and accessible data opens up the possibility of using powerful AI forecasting. If your data is limited, you’ll want to stick with more traditional—but still effective—models.
Choosing Your Sales Forecasting Methodology
To help you decide, here’s a direct comparison of the main methodologies. Think about where your business is today and what you're trying to achieve to find the best fit.
Methodology | Best For | Data Requirement | Pros | Cons |
|---|---|---|---|---|
Bottom-Up | Sales-driven cultures; companies with detailed pipeline data. | High (CRM data on individual deals). | Highly realistic; promotes sales team accountability. | Can be time-consuming; may overlook macro trends. |
Top-Down | New businesses; entering new markets; strategic planning. | Low to Medium (market size, TAM data). | Quick to build; good for high-level strategy. | Lacks detail; disconnected from sales reality. |
Time-Series | Stable businesses with consistent historical performance. | High (at least 2-3 years of clean historical data). | Simple and reliable in predictable environments. | Fails in volatile markets; ignores external factors. |
Causal | Mature businesses trying to understand market drivers. | Very High (sales data + external economic/market data). | Extremely powerful; explains why sales change. | Complex to build; requires data science expertise. |
Cohort-Based | Subscription/SaaS businesses focused on retention. | High (customer sign-up, usage, and churn data). | Excellent for predicting recurring revenue and LTV. | Less useful for non-subscription business models. |
AI/ML | Data-rich companies in dynamic or complex markets. | Very High (large, clean, and varied datasets). | Most accurate; adapts to change; uncovers hidden patterns. | "Black box" nature can be hard to interpret; needs expertise. |
Ultimately, the best approach is often a hybrid one. You might use a top-down model to set a high-level target and a bottom-up forecast to see if your pipeline can realistically hit it.
A Four-Step Guide to Implementation
Once you've picked a methodology, it's time to put it into practice. Following a structured process ensures your forecast is built on a solid foundation and can be trusted to guide important decisions.
Step 1 Collect and Prepare Your Data This is where most of the work happens, and you can't cut corners. A forecast is only as good as the data it’s built on. Pull everything together from your CRM, marketing tools, and financial software. Then, get to work cleaning it—that means removing duplicates, fixing errors, and handling any missing values.
Step 2 Select and Build Your Model With clean data in hand, you can build your chosen model. For a simple regression, this might be as straightforward as identifying key variables in a spreadsheet. For an AI model, you’ll be feeding your dataset into a BI platform or statistical software that can run the algorithms for you. For more on this, check out our guide on data analysis tools for forecasting and scenario planning.
Step 3 Validate and Refine Your Forecast Never, ever trust the first output. You have to pressure-test your model. The best way to do this is through backtesting—comparing your model's predictions against historical data it has never seen before. This tells you how it would have performed in the real world.
Use a couple of key metrics to measure its accuracy:
Mean Absolute Error (MAE): This gives you the average size of your forecasting errors in plain terms (e.g., you were off by an average of $10,000). It’s simple and easy to explain.
Root Mean Square Error (RMSE): This is similar to MAE but gives much more weight to large errors. A high RMSE is a red flag that your model is making some big, costly mistakes.
Step 4 Monitor and Iterate A sales forecast isn't a one-and-done report. It’s a living document. As new sales data rolls in each week or month, compare it to what you predicted. This gap between your forecast and your actuals is called forecast variance, and it’s where the real learning happens. Figure out why you were off and use those insights to make your next forecast even sharper.
Streamlining Forecasts with Modern BI Platforms

Knowing the different sales forecasting methods is one thing, but actually putting them to work without getting bogged down is a whole different ball game. For many teams, forecasting means getting lost in a maze of spreadsheets, wrestling with tricky formulas, and struggling to share insights before they're already out of date. This constant friction leaves a huge gap between what the data says and what the business actually does.
That's where modern business intelligence (BI) platforms come in. They're built to bridge that very gap. Imagine a product manager asking, "What's our sales forecast for the next two quarters, assuming we follow last year's growth pattern?" and getting a solid, data-driven answer in seconds. That's the kind of speed and simplicity we're talking about with AI-powered analytics.
From Manual Effort to Automated Insight
Modern BI tools turn forecasting from a dreaded, quarterly chore into something you can do anytime, on demand. They plug right into your live data sources—your CRM, your accounting software, you name it—so you're always working with the freshest information. Gone are the days of manually copying and pasting data, hoping you didn't make a mistake.
The real magic is how they combine speed with accessibility. Modern BI can take an analysis that used to burn a full week and shrink it down to just a few minutes. Better yet, it allows people who aren't data scientists to ask complex questions in plain English and get real answers.
By handling all the heavy lifting, these platforms give your team their time back. Instead of just crunching numbers, they can focus on what the numbers actually mean for the business. A great place to start understanding these capabilities is to see how tools like Power BI for UK SMBs are changing the game.
Operationalizing Your Forecasts
A forecast is only useful if people act on it. This is where a modern BI platform truly shines—it helps you "operationalize" the forecast. Instead of a static report that's irrelevant by next Tuesday, you get a living, breathing dashboard with real-time alerts.
Now, everyone from sales and marketing to finance and operations is on the same page, working off the same numbers. This creates a ripple effect of good decisions across the entire company.
This kind of integration delivers some serious wins:
Self-Serve Analytics: No more waiting for the data team. Anyone can dive in, explore the numbers, and generate their own forecasts on the fly.
Unified Truth: Every department is aligned, working from a single source of truth for all metrics and predictions.
Proactive Adjustments: Teams can instantly see when reality starts to drift from the forecast, letting them adjust their game plan before it's too late.
Platforms like Querio are at the forefront of this shift. If you're ready to give your company's analytical capabilities a serious upgrade, check out our guide to the best AI business intelligence platforms on the market.
Your Sales Forecasting Questions, Answered
Jumping into sales forecasting can feel a bit like learning a new language. You've got the basics down, but a lot of practical questions pop up along the way. Let's tackle some of the most common ones I hear from teams trying to get their forecasting process right.
How Often Should We Update Our Sales Forecast?
The honest answer? It depends on your sales pulse.
If you're in a fast-paced business like SaaS or e-commerce where deals close quickly, you should be looking at your forecast at least monthly, if not weekly. Things change fast, and your forecast needs to keep up.
On the other hand, if you're selling complex enterprise solutions with long sales cycles, a quarterly review usually makes more sense. The key is to treat your forecast not as a static report but as a living document. Any time something big happens—a major competitor makes a move, the economy shifts, a huge deal goes sideways—it's time to re-forecast.
The best sales forecasting methodology isn’t a one-and-done report. It's an agile process, ready to adapt to new data and market signals. This ensures your strategic decisions are always based on the most current reality, not last quarter's assumptions.
What's the Single Most Accurate Forecasting Method?
This is the million-dollar question, but there's no silver bullet. The "most accurate" method is the one that best fits your business reality and the data you actually have.
Here’s a simple way to think about it:
Got a Stable Business? If you have years of clean, consistent sales history, a time-series analysis can be incredibly reliable. It’s great at spotting patterns in predictable environments.
Navigating a Wild Market? When things are constantly changing, AI-driven models often come out on top. They can sift through dozens of variables at once to find signals that a human might miss.
But in my experience, the real magic happens when you combine approaches. Use a solid quantitative model as your foundation, then layer on the qualitative, street-level intelligence from your sales reps. That blend of data and human insight almost always produces a more balanced and realistic number.
How Can We Get Better at This Over Time?
Getting good at forecasting is a journey, not a destination. It's all about learning and refining as you go.
Your first step is to track your forecast variance—that's just the gap between what you predicted and what actually happened. Digging into why you were off is where the real learning happens.
From there, it's about discipline. Continuously clean up and enrich your data, because any model is only as good as the information you feed it. And don't be afraid to revisit your methodology. As your business grows and changes, the way you forecast will need to evolve right along with it.
Ready to stop wrestling with spreadsheets and get AI-powered insights instead? Querio allows anyone on your team to ask questions in plain English and get reliable forecasts in seconds. See how you can simplify your analytics and make smarter decisions by visiting https://www.querio.ai.

