Business Intelligence
dbt Charts: Does It Read Your dbt Metrics? We Tested It
We ran dbt Charts 0.10.0 in a dbt project with a MetricFlow revenue metric, changed the metric, and the boards kept the old number. What it is and how to use it.
 Javier BonillaCo-founder & CTO
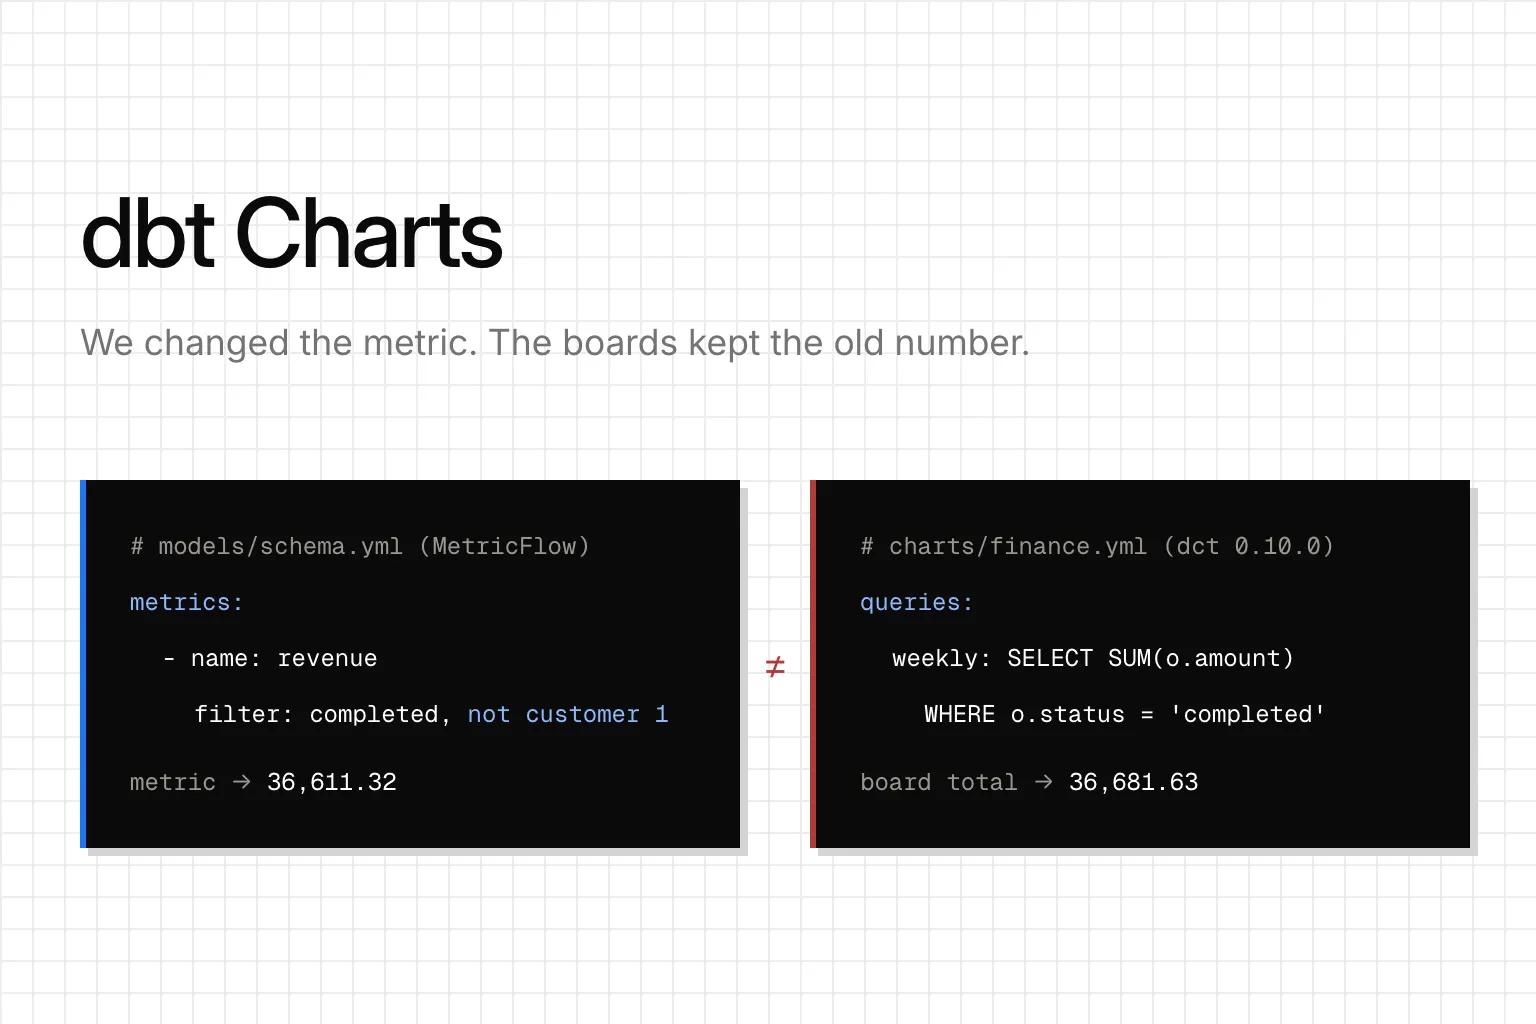
dbt Charts is dbt Labs' open-source YAML language for dashboards that live in a charts/ folder next to your dbt models. You run it with a CLI called dct, it's free under Apache 2.0, and it's in beta. Each dashboard is called a board. Boards query your models with SQL. They can't read a dbt metric by name yet: dbt Labs lists that as planned.
At Querio, we tested what that means on October 30, 2026. In a dbt project with a MetricFlow revenue metric, we changed the metric's definition. MetricFlow's number changed. The two dbt Charts boards showing revenue kept their old numbers, and dbt parse and dct validate still passed. Until dbt Charts can read a metric by name, keep metric logic out of board SQL.
What is dbt Charts?
A board is one YAML file with four parts: variables (the filters a viewer can change), queries (named SQL), charts (which query, which columns, which chart type) and rows (the layout). The CLI scaffolds a project with dct init, checks boards with dct validate, previews them with dct serve and renders them to HTML, PDF, PNG or SVG.
The code went open source on September 14, 2026. dbt Labs showed it at dbt Summit 2026 and wrote it up on October 27 as "a new open-source language for dashboards that live inside your dbt repo". Chart changes go through the same git tests and deploys as your models, in the same branch. That part is right: dashboards belong in git, next to the models they read. There's also a hosted version, dbt Charts Cloud, with sharing, a visual editor, version history and an AI chat.
The catch is metrics, and dbt Labs said so itself in issue #1, opened the day the code went public: "A dbt project that defines metrics in the Semantic Layer has to restate those metrics as SQL in every board, which duplicates the definition and lets the two drift." The live docs also describe a newer route, a MetricFlow "semantic bundle" that a source can carry, compiled by a separate metricflow-sql library. The docs that ship with dct 0.10.0, the current release, don't mention it, and the same live docs still list metric-by-name as planned.
What happened when we changed a dbt metric?
We built a small dbt project to see that drift happen. Versions: dct 0.10.0, dbt-core 1.12.6, dbt-duckdb 1.11.1 and dbt-metricflow 0.15.0, on DuckDB. The data is 500 made-up orders from September 1 to October 26, 2026, 58 of them refunded.
In MetricFlow we defined revenue as the sum of order amounts where the status is completed: 36,681.63.
Then we built two boards on {{ ref('orders') }}, the way two analysts might. The finance board filters to completed orders. The growth board doesn't, on purpose, to see what dbt Charts checks. Its query looks like this:
# charts/growth.yml (dct 0.10.0)
queries:
  weekly: |
    SELECT date_trunc('week', o.order_date) AS week, SUM(o.amount) AS revenue
    FROM {{ ref('orders') }} AS o
    GROUP BY week ORDER BY week
The finance board matched the metric at 36,681.63. The growth board totaled 41,344.39. dct validate passed both, with a warning on each that it couldn't check their columns against the dbt models. It checks that a board is well formed, not what revenue means, and nothing in either board points back to the metric.
Next we changed the metric. Our data has an internal test account, customer 1, with two completed orders worth $70.31. We added a filter to drop it from revenue. dbt parse passed and the metric dropped to 36,611.32.
The boards didn't move. Finance still said 36,681.63, growth still said 41,344.39. That's three numbers for revenue in one repo.
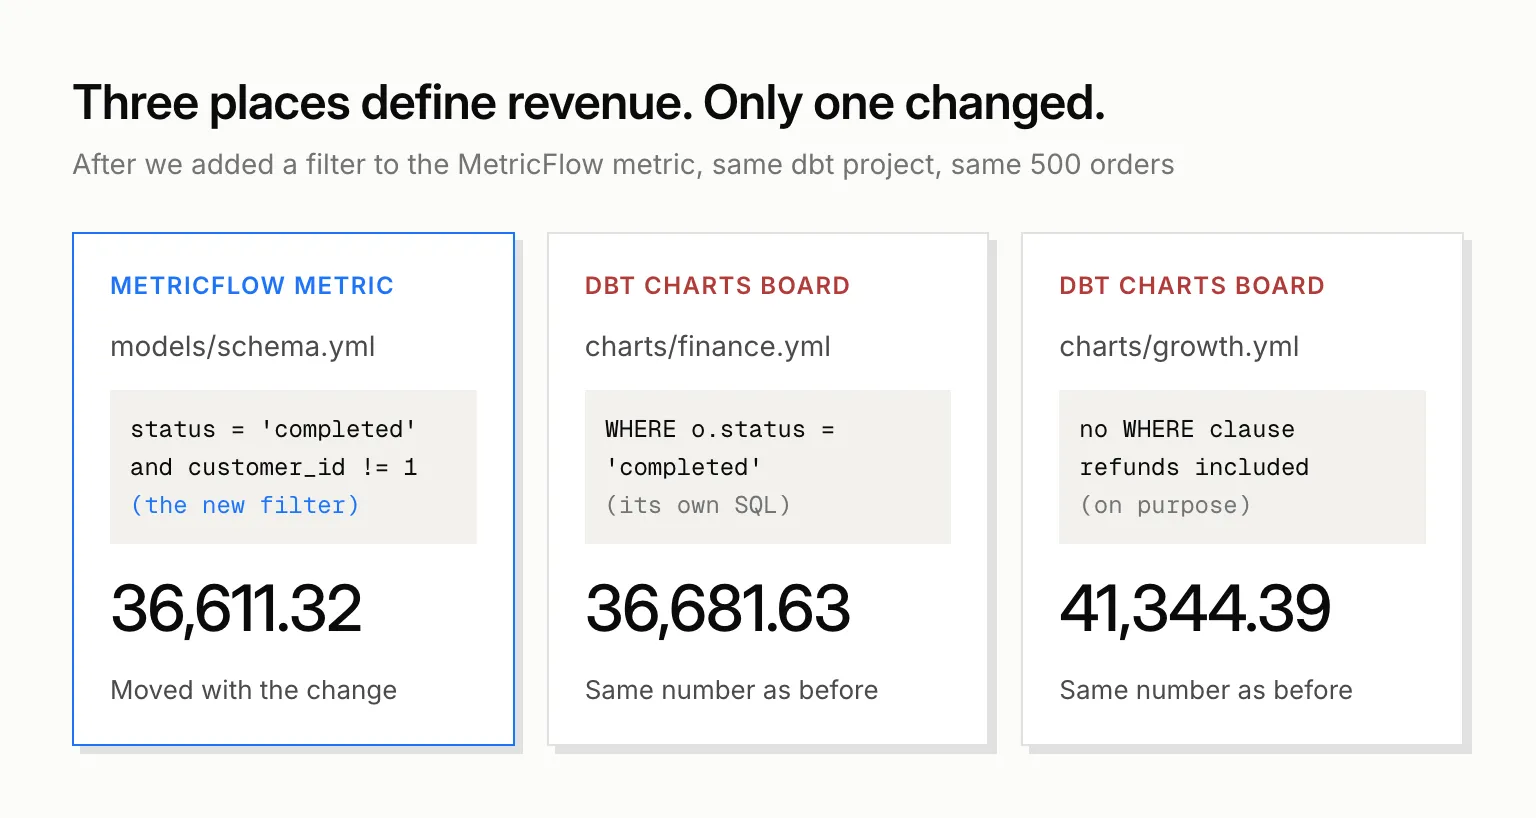
Our test, October 30, 2026: one dbt project, 500 orders, dct 0.10.0 and dbt-metricflow 0.15.0.
We tried two more things. A query that asks for metric: revenue fails validation with ERR-EXTRA-FIELD Unknown field 'metric'. And dct impact, which lists the boards that use a column, couldn't give an answer for status or amount, even with the dbt manifest and catalog built. It listed both boards as "Could not be analyzed" and told us to verify them by hand.
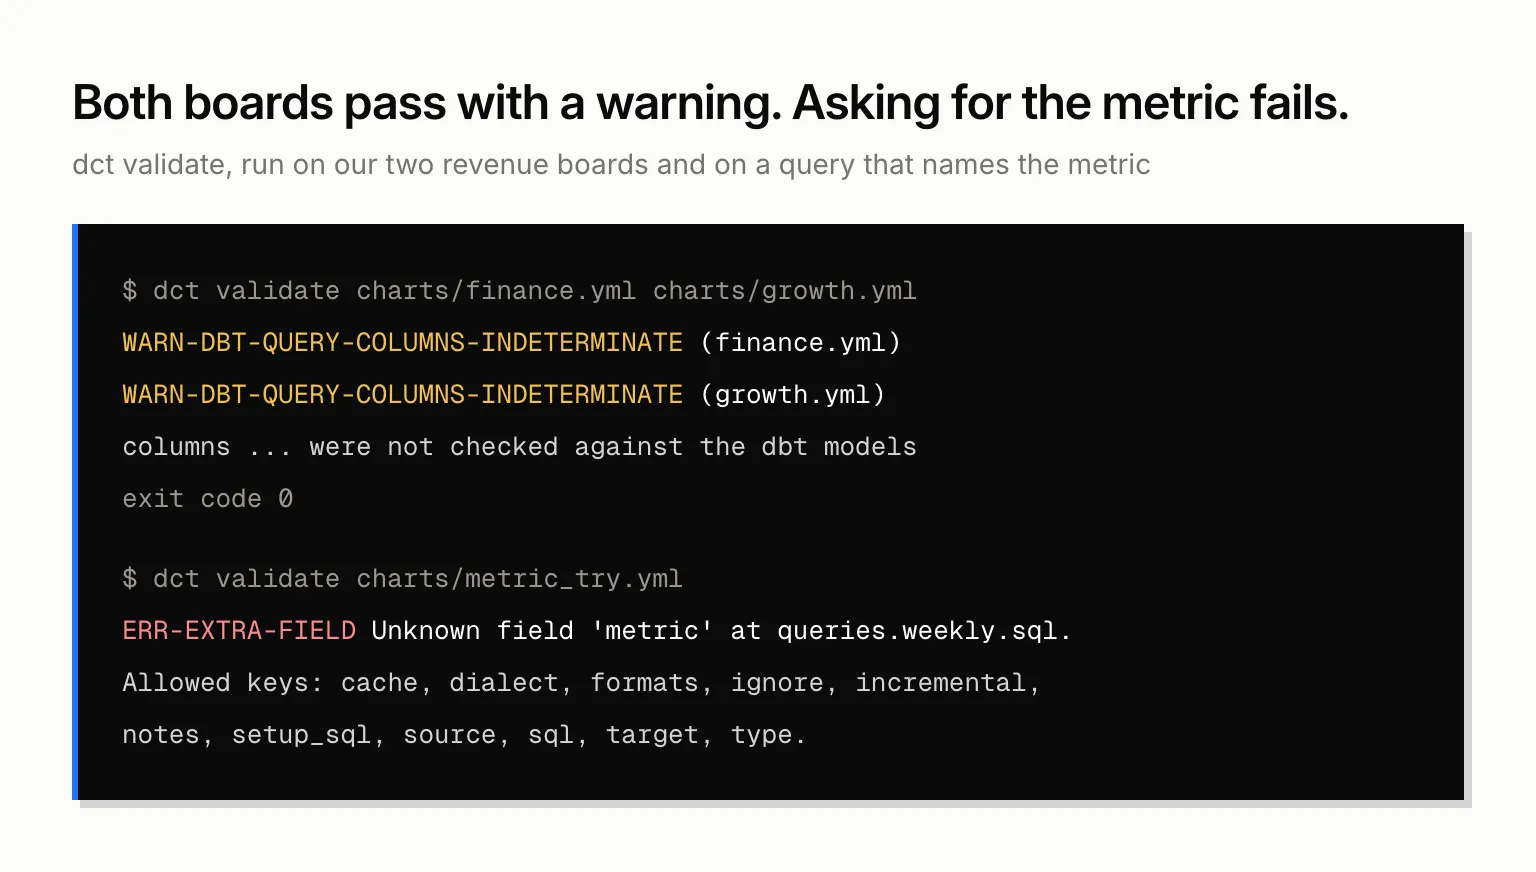
dct 0.10.0 in our dbt project, October 30, 2026. Output shortened.
Doesn't a dbt mart solve this?
Partly. If revenue is a column in a mart and every board sums that column, the boards agree on the sum. That covers a lot of dashboards.
It leaves three gaps. If you also define revenue in MetricFlow, the mart is a second copy, and our test shows what happens when one copy changes. A ratio such as average order value can't be stored as a column and summed: the average of daily averages isn't revenue divided by orders. MetricFlow defines it once, as one metric over another. And every filter a board adds, including the ones its variables feed into the SQL, lives in that board.
How should you use dbt Charts until it reads metrics?
Point boards at mart columns, never at raw tables. Put filters like "completed orders only" in the model, not in a board's WHERE. Don't build boards on any number you also define in MetricFlow until issue #1 ships, or check them against mf query before anyone relies on them. Review board SQL in pull requests the way you review models.
How does Querio read the same metric?
Querio reads dbt's semantic_manifest.json. You define a MetricFlow metric once in dbt YAML, and Querio's agent uses it from there, with no second copy.
Querio's dashboards, saved queries and metrics are plain files in a git repo you own, and they can sit inside your dbt repo. Promoting a dashboard opens a pull request under your repo's own reviewers. Renaming a dbt model flags every dashboard, query and context file that uses it before the PR can pass. Claude, ChatGPT or any agent connected through Querio's MCP server can ask for a metric by name. The query runs as that person and returns only what they're allowed to see. For more on keeping definitions in dbt, see our guide to the dbt Semantic Layer and our MetricFlow comparison.
FAQ
Does dbt Charts need dbt Cloud?
No. Locally, dct runs board queries through the connection in your dbt profiles.yml, and DuckDB is built in. dbt Charts Cloud is optional.
Can dbt Charts Cloud read a DuckDB file?
No. Cloud never reads a .duckdb file. Load the tables into a warehouse Cloud connects to, or export them to CSV, JSON or Parquet files in the repo.
Can you contribute to dbt Charts?
You can file issues. The GitHub repo is a read-only mirror of dbt Labs' own repo, and it doesn't accept pull requests.
How much does dbt Charts cost?
The open-source CLI is free. dbt Charts Cloud's Individual plan is free for up to 3 collaborators, and Team pricing is still marked "Pricing WIP". It will be per seat. Querio has no per-seat pricing on any plan.