Business Intelligence
How Do You Convert LookML to dbt MetricFlow?
How each LookML object maps to dbt MetricFlow, what we got converting Looker's own sample project with our open-source unshackle CLI, and the one choice that held back most measures.
 Javier BonillaCo-founder & CTO
To convert LookML to dbt MetricFlow, turn each view into a semantic model on a dbt model, primary keys and join keys into entities, dimension groups into time dimensions, and measures into metrics. Explores disappear: MetricFlow works out joins from entities. Derived tables become dbt models. Liquid gets rewritten by hand, and access filters move out of MetricFlow altogether.
You don't have to type it all by hand. We built unshackle, a free, open-source CLI that reads a LookML project and writes MetricFlow YAML into your dbt repo. We ran it on Looker's own public sample project. Most of the hand work it left came down to one question Looker never asked: which date does each table count by?
How does each LookML object map to MetricFlow?
| LookML | MetricFlow | What changes |
|---|---|---|
View on a table (sql_table_name) |
Semantic model on a dbt model (model: ref('...')) |
One semantic model per dbt model |
derived_table, including PDTs |
A dbt model, with a semantic model on top | dbt builds the table instead of Looker |
primary_key: yes dimension |
Primary entity | |
Join sql_on in an explore |
Foreign entity matching a primary or unique entity of the same name on the other model | No join config: MetricFlow finds the path |
| Dimension | Categorical dimension | |
dimension_group (type: time) |
Time dimension with a granularity | You pick the grain at query time |
Measure (sum, count_distinct, average) |
Simple metric | |
Measure with filters: |
Simple metric with a filter: |
|
type: number measure over other measures |
Ratio or derived metric | |
sql_always_where, access_filter |
Nothing in MetricFlow | Row filters live in the warehouse or the tool that queries |
| Liquid templating | Nothing | One metric per branch, or a filter |
| LookML dashboards | Nothing | Rebuilt in whatever reads the metrics |
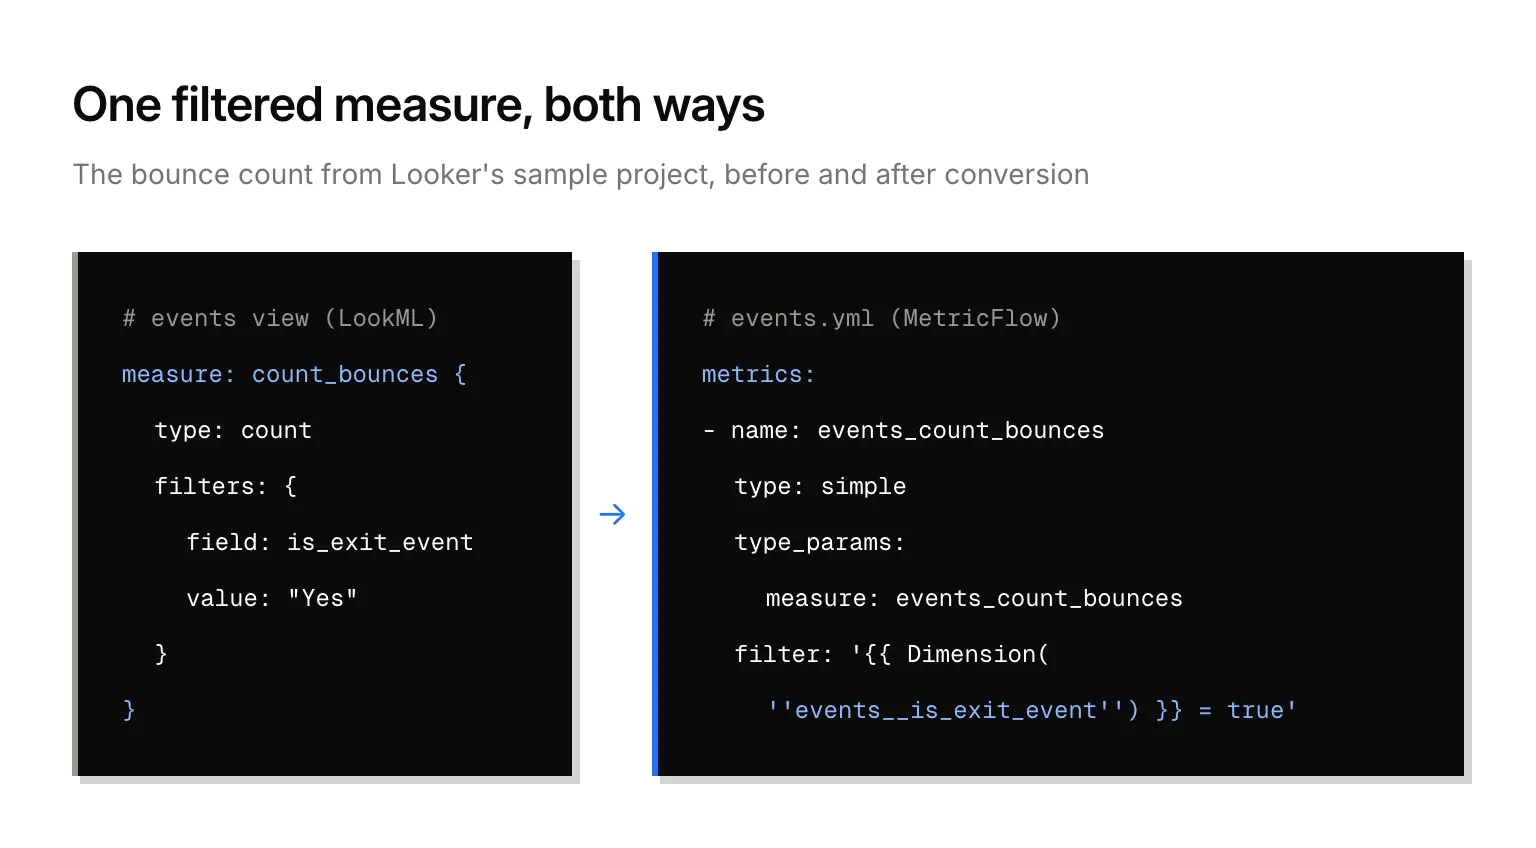
The table is the easy half. A filtered measure like count_bounces (a count with filters: is_exit_event "Yes") comes out as a simple metric with filter: '{{ Dimension(''events__is_exit_event'') }} = true'. A type: number measure like bounce_rate, which divides one measure by another, comes out as a derived metric.
Can you convert LookML to MetricFlow automatically?
The YAML, yes. The decisions, no.
dbt Labs has its own converter, dbt-converter, with a convert-lookml command. Its README says it "can only help with the migration and leaves many manual steps to the user", and that it requires dbt-core 1.5. Its last commit was on February 11, 2025.
unshackle is the one we maintain. It's Apache 2.0, needs no account and no Querio, and it reads a LookML Git checkout without any Looker credentials. When your repo has a dbt_project.yml, it writes MetricFlow next to Apache Ossie files (the open semantic-layer format formerly called Open Semantic Interchange). What it can't translate faithfully, it leaves commented out under a TODO(unshackle) line with the original formula. It doesn't guess.
pip install unshackle
cd your-dbt-repo
unshackle import looker path/to/lookml
unshackle build looker
On November 2, 2026, we ran unshackle 0.1.0 on thelookevent, Looker's open-source sample e-commerce project. It wrote 34 semantic models and 112 MetricFlow measures. 14 were ready to use. The other 98 needed a person.
Why do most measures wait on a time dimension?
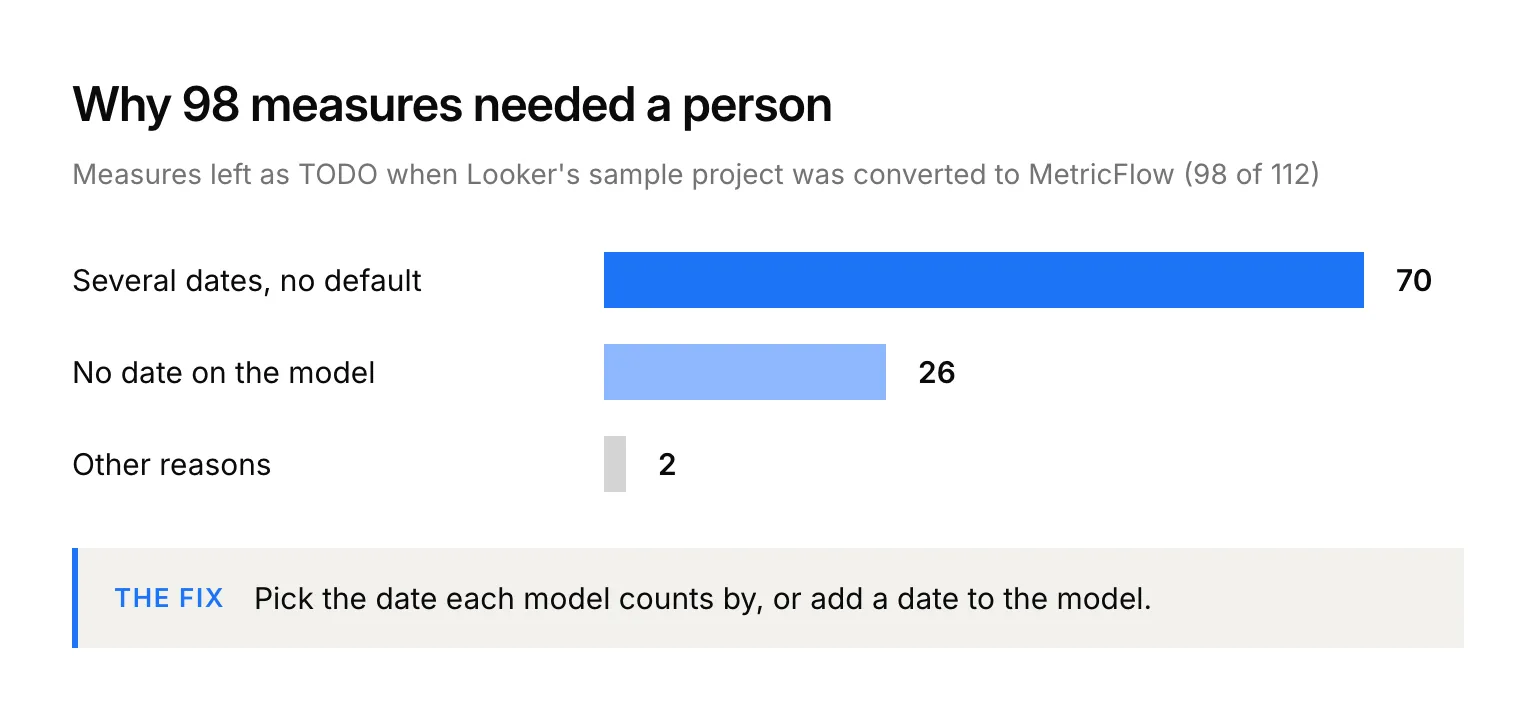
96 of those 98 measures were waiting on a date. 70 sat on models with several dates and no default. 26 sat on models with no date at all.
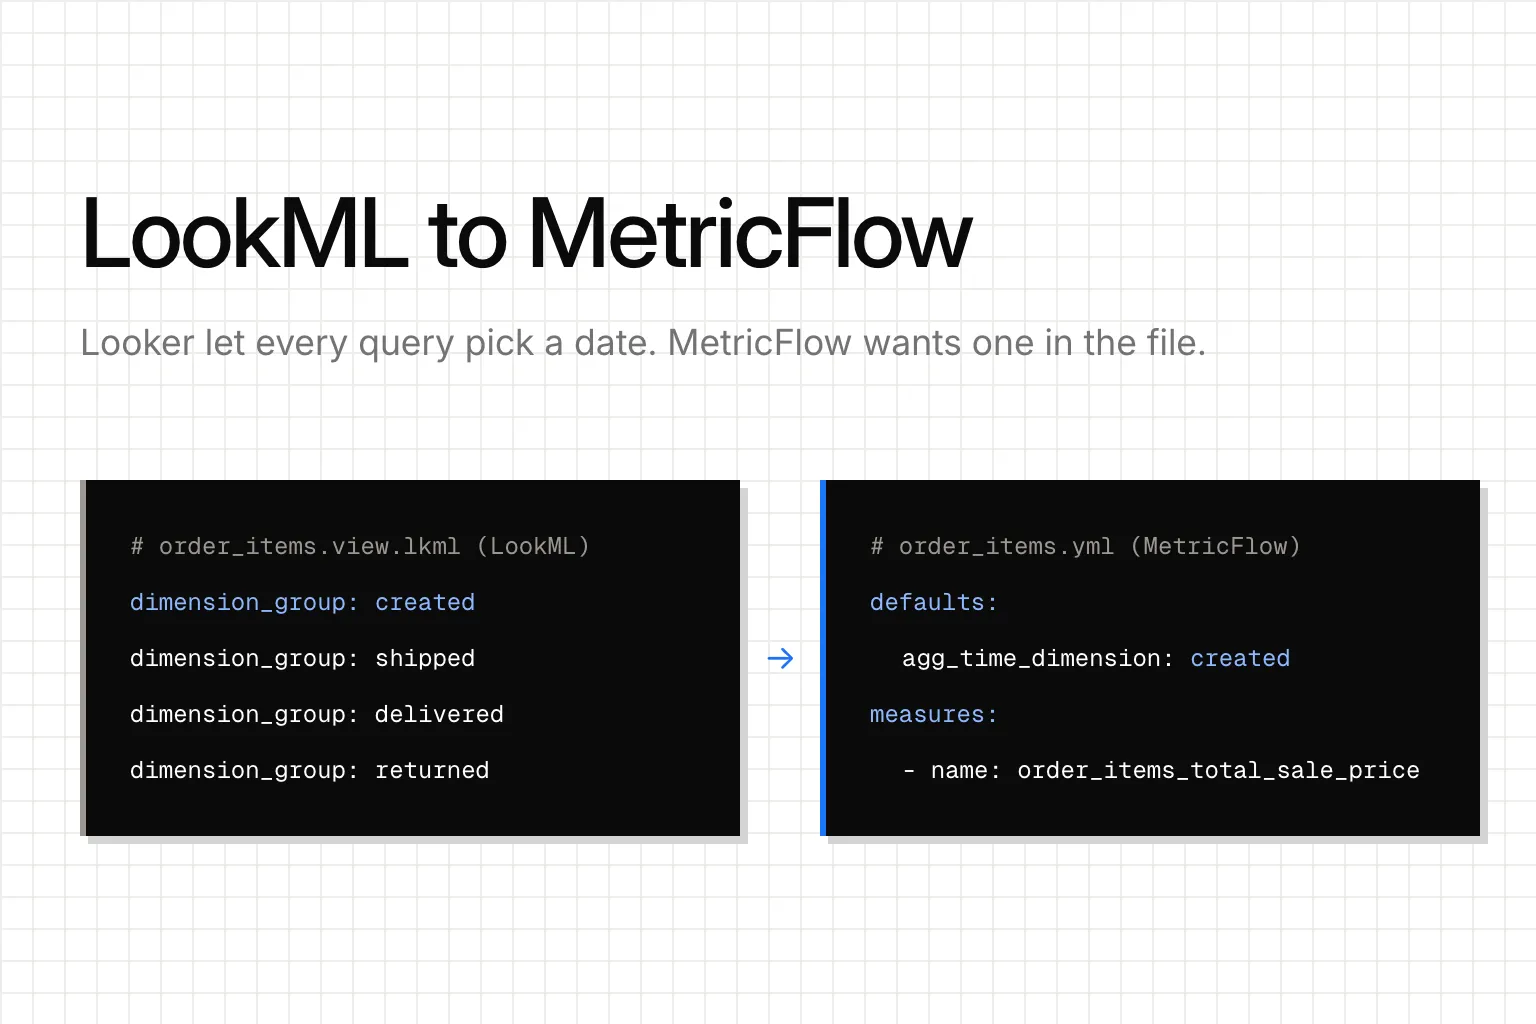
LookML never makes you choose. The order_items view has four dimension groups: created, shipped, delivered and returned. A Looker user picks one when they build a query. MetricFlow wants the choice in the file. A semantic model that defines metrics needs at least one time dimension with a granularity and an agg_time_dimension, the default date its metrics count by.
So unshackle lists the candidates and stops:
# TODO(unshackle): measure order_items.order_items_total_sale_price: the source declares no default time dimension; set defaults.agg_time_dimension to one of returned, shipped, delivered, created
#   measures:
#   - name: order_items_total_sale_price
#     agg: sum
#     expr: sale_price
The fix is a decision, then two edits: set the default and uncomment the block.
semantic_models:
- name: order_items
  model: ref('order_items')
  defaults:
    agg_time_dimension: created
  measures:
  - name: order_items_total_sale_price
    agg: sum
    expr: sale_price
We did that for order_items, picking created. The file went from 0 live measures to 12 measures and 14 metrics, including the return_rate ratio metric. It passed dbt parse and mf validate-configs --skip-dw with no errors on dbt-core 1.12.6, once we gave one metric a unique label. The 26 measures on models without a date need a date column added to the dbt model first.
Pick the date the business means. Revenue by order date and revenue by ship date are both right, and they're different numbers. Looker let every user choose. Now one person chooses once, in review.
This YAML has measures: blocks, which dbt-core 1.12 still reads. dbt's newer format folds measures into simple metrics, and dbt-autofix deprecations --semantic-layer rewrites the files to it.
What happens to explores, joins and the rest?
Explores go away. MetricFlow joins from the many side to the one side, and it rejects joins the other way, which would fan out the rows. Looker handles that fan-out with symmetric aggregates, which are on by default in every explore where the SQL dialect supports them. In MetricFlow, entity types do that job. MetricFlow also follows at most two hops.
A dimension that reads another view doesn't carry over. In the sample, order_items.gross_margin is ${sale_price} - ${inventory_items.cost}. unshackle leaves it as a TODO: compute it in the dbt model, or group through the join.
The rest:
- Access filters. dbt's Semantic Layer runs every request with the credentials you configure, and any access policies tied to those credentials apply. In a test project we wrote by hand, unshackle turned an
access_filterand asql_always_whereinto SQL row filters and anaccess_grantinto a Cedar policy, with a TODO to map the group to your identity provider. - Dashboards. The sample's 10 LookML dashboards became 10 Jupyter notebooks, with SQL behind 59 of their 95 tiles.
In what order should you do it?
- Run unshackle in your dbt repo on a checkout of your LookML.
- unshackle writes each derived table's SQL to
queries/. Build each one as a dbt model, under the name its semantic model already uses. - Point every
ref()at your real dbt model names. unshackle takes them from the LookML table names. - Add a time spine model. MetricFlow needs one before
dbt parseaccepts the metrics, and unshackle doesn't write it. - Set
agg_time_dimensionon every model with more than one date, and uncomment the blocks the TODOs list. - Rewrite Liquid, cross-view dimensions and access rules by hand.
unshackle todolists what's left. - Validate, then compare numbers with Looker before anyone switches. Start with the metrics your leadership team reads every week.
How do you check the numbers match Looker?
Run dbt parse, then mf validate-configs with open-source MetricFlow, or dbt sl validate on the dbt platform. That proves the YAML is valid. It doesn't prove the numbers.
For the numbers, run the same question both ways. unshackle verify runs the migrated SQL against your warehouse and compares it with the old tool's results. It needs a warehouse connection and a few test cases you write.
What reads the metrics once Looker is gone?
MetricFlow has no screen. Something has to query it, and Looker isn't on dbt's list of Semantic Layer integrations.
Serving metrics through dbt's APIs takes a dbt Starter, Enterprise or Enterprise+ plan. Without one, you can still define metrics and query them from the command line with mf query. Our dbt Semantic Layer guide covers what's free and what isn't.
Querio reads your dbt project's semantic_manifest.json, so your metrics stay defined once, in dbt, and we keep no second copy. Claude, ChatGPT or any agent connected through our MCP server can ask for a metric by name. It runs as the signed-in person and returns only what they're allowed to see. That call uses no Querio AI credits, and the MCP server is on every plan, Free included. Coming from Looker? Here's how Querio compares.
FAQ
Does converting change anything in Looker?
No. unshackle only reads. Your LookML, explores and dashboards stay as they are, so both can run side by side while you compare numbers.
What happens to Looks and dashboards people built in Looker?
A LookML checkout holds only what's in code: LookML dashboards come across, but dashboards and Looks people built in the Looker UI don't. To bring those, run unshackle against Looker's API with credentials, and it writes Looks as SQL queries and dashboards as notebooks.