Business Intelligence
What Are Data Analysis Tools? Definitions, Examples, and Use Cases
Explore essential data analysis tools that transform raw data into actionable insights, making decision-making faster and more informed.

Data analysis tools help transform raw data into actionable insights by collecting, processing, analyzing, and visualizing information. They connect to data sources like databases or spreadsheets, enabling businesses to make informed decisions faster. Modern tools, including the top AI tools for custom dashboards, feature predictive analytics, machine learning, and real-time data processing, making them indispensable for industries such as SaaS, fintech, and e-commerce.
Key Benefits:
- Simplify complex data for non-technical users.
- Detect trends, anomalies, and opportunities quickly.
- Enable real-time decision-making with automated updates.
Popular Tools:
- Querio: AI-driven, natural-language querying for live data with robust governance and security. Free plan; Core $2,499/month.
- Tableau: User-friendly visualizations with drag-and-drop functionality.
- Power BI: Microsoft-integrated, affordable analytics starting at $10/user/month.
- Python Libraries: Advanced analytics for skilled developers using Pandas, NumPy, and more.
Use Cases:
- Finance: Monitor revenue, budgets, and cash flow.
- Product Teams: Analyze user behavior and feature adoption.
- Operations: Optimize supply chains and reduce costs.
- Executives: Automated dashboards for high-level insights. Some platforms even use AI to generate dashboards automatically from live data.
Choosing the right tool depends on factors like data compatibility, user skill requirements, security, scalability, and budget. Start with a pilot project to test how well a tool meets your needs.
Core Features of Data Analysis Tools
Modern data analysis tools are designed to simplify how businesses handle their data, turning complex analytics into insights that are accessible to everyone, regardless of technical expertise. These features work together to provide a smooth journey - from raw data to actionable decisions.
Data Connectivity and Integration
At the heart of any effective data analysis tool is its ability to connect directly to your data sources. Whether it’s a data warehouse like Snowflake, BigQuery, or Amazon Redshift, or more traditional databases, these tools establish live connections that keep your dashboards and reports updated automatically.
This means no more manual updates or outdated spreadsheets. For instance, when new sales figures are added to your CRM or fresh customer data flows into your warehouse, your reports reflect those changes in real time. That’s a game-changer for organizations tired of battling version control issues.
But it doesn’t stop there. These tools can also pull data from multiple systems simultaneously. Imagine combining customer data from your CRM, financial figures from your accounting software, and product usage stats from your app - all in one view. This unified perspective provides insights you simply can’t get from isolated systems.
The best part? The tool handles the heavy lifting behind the scenes, managing authentication protocols, connection details, and data formatting differences. All you need to do is select your sources and start analyzing.
Natural-Language Querying
One of the standout advancements in modern tools is the ability to ask questions in plain English. Instead of wrestling with SQL or navigating complex menus, you can simply type, "What were our top-selling products last quarter?" or "Show me customer retention by region."
This feature breaks down barriers to data access. Marketing managers no longer have to wait for analysts to run reports, and executives can explore data on the fly, even in the middle of a meeting. The tool translates these natural-language questions into precise database queries, making it easier for everyone to interact with data.
These systems are getting smarter, too. They can understand context, manage follow-up questions, and even suggest related insights. For example, if you ask about sales trends, the tool might recommend breaking them down by region or product category.
This capability is particularly valuable for mid-sized businesses without large data teams. Instead of hiring specialists for every query, existing staff can dive into the data themselves, making informed decisions part of their everyday routine.
Data Visualization and Dashboards
Numbers alone can be overwhelming, but visualizations turn them into stories. Modern tools excel at converting rows of data into charts, graphs, and interactive dashboards that highlight patterns and trends.
These tools go beyond the basics like bar charts and pie graphs. They offer heat maps for geographic insights, trend lines for time-based data, scatter plots for correlations, and even industry-specific visualizations. Each type serves a unique role in helping users interpret their data.
Dashboards bring these visualizations together in one place. For example, a sales dashboard might display revenue trends, pipeline forecasts, regional performance maps, and individual rep scorecards - all on a single screen. What’s more, these dashboards update automatically as new data comes in, giving you real-time insights at a glance.
Interactivity takes this a step further. You can click on a chart segment to filter related data, drilling down from high-level trends to specific details. This hands-on approach allows users to explore their data naturally, following their curiosity without needing technical expertise.
Customization is another key strength. The same data can be tailored for different audiences - detailed operational dashboards for managers and high-level summaries for executives - ensuring everyone gets the information they need in a format that works for them.
Governance and Security
As more people within an organization work with data, governance and security become critical. These tools balance accessibility with control, ensuring data remains accurate and secure while being widely available.
One advanced feature is context layering. Administrators can define business logic, standard definitions, and approved data relationships once, and these standards are applied consistently across all analyses. For example, when someone queries "customer lifetime value", they’ll get the same standardized calculation every time, avoiding discrepancies between departments.
Role-based access controls ensure that sensitive information is only seen by those who need it. Finance teams might access revenue data, while marketing teams focus on customer engagement metrics - all within the same platform. Permissions can even be fine-tuned to control access to specific fields or time frames.
Audit trails provide transparency by tracking who accessed what data and when. This is invaluable for compliance reporting and identifying unusual activity. Additionally, data lineage tools show how information flows through your systems, from its source to the final report. This visibility helps maintain data quality and troubleshoot issues when something doesn’t look right.
These governance features create an environment where data is both accessible and secure. Businesses can empower their teams to explore and use data while maintaining the necessary controls to protect sensitive information and ensure consistency across the board.
Popular Data Analysis Tools
Data analysis tools today range from AI-driven platforms that simplify data access to specialized libraries designed for advanced analytics. These tools have reshaped how organizations handle data, offering features like easy data connectivity, intuitive visualizations, and straightforward querying. Here’s a look at some standout examples that highlight the variety of modern data analysis solutions.
Querio
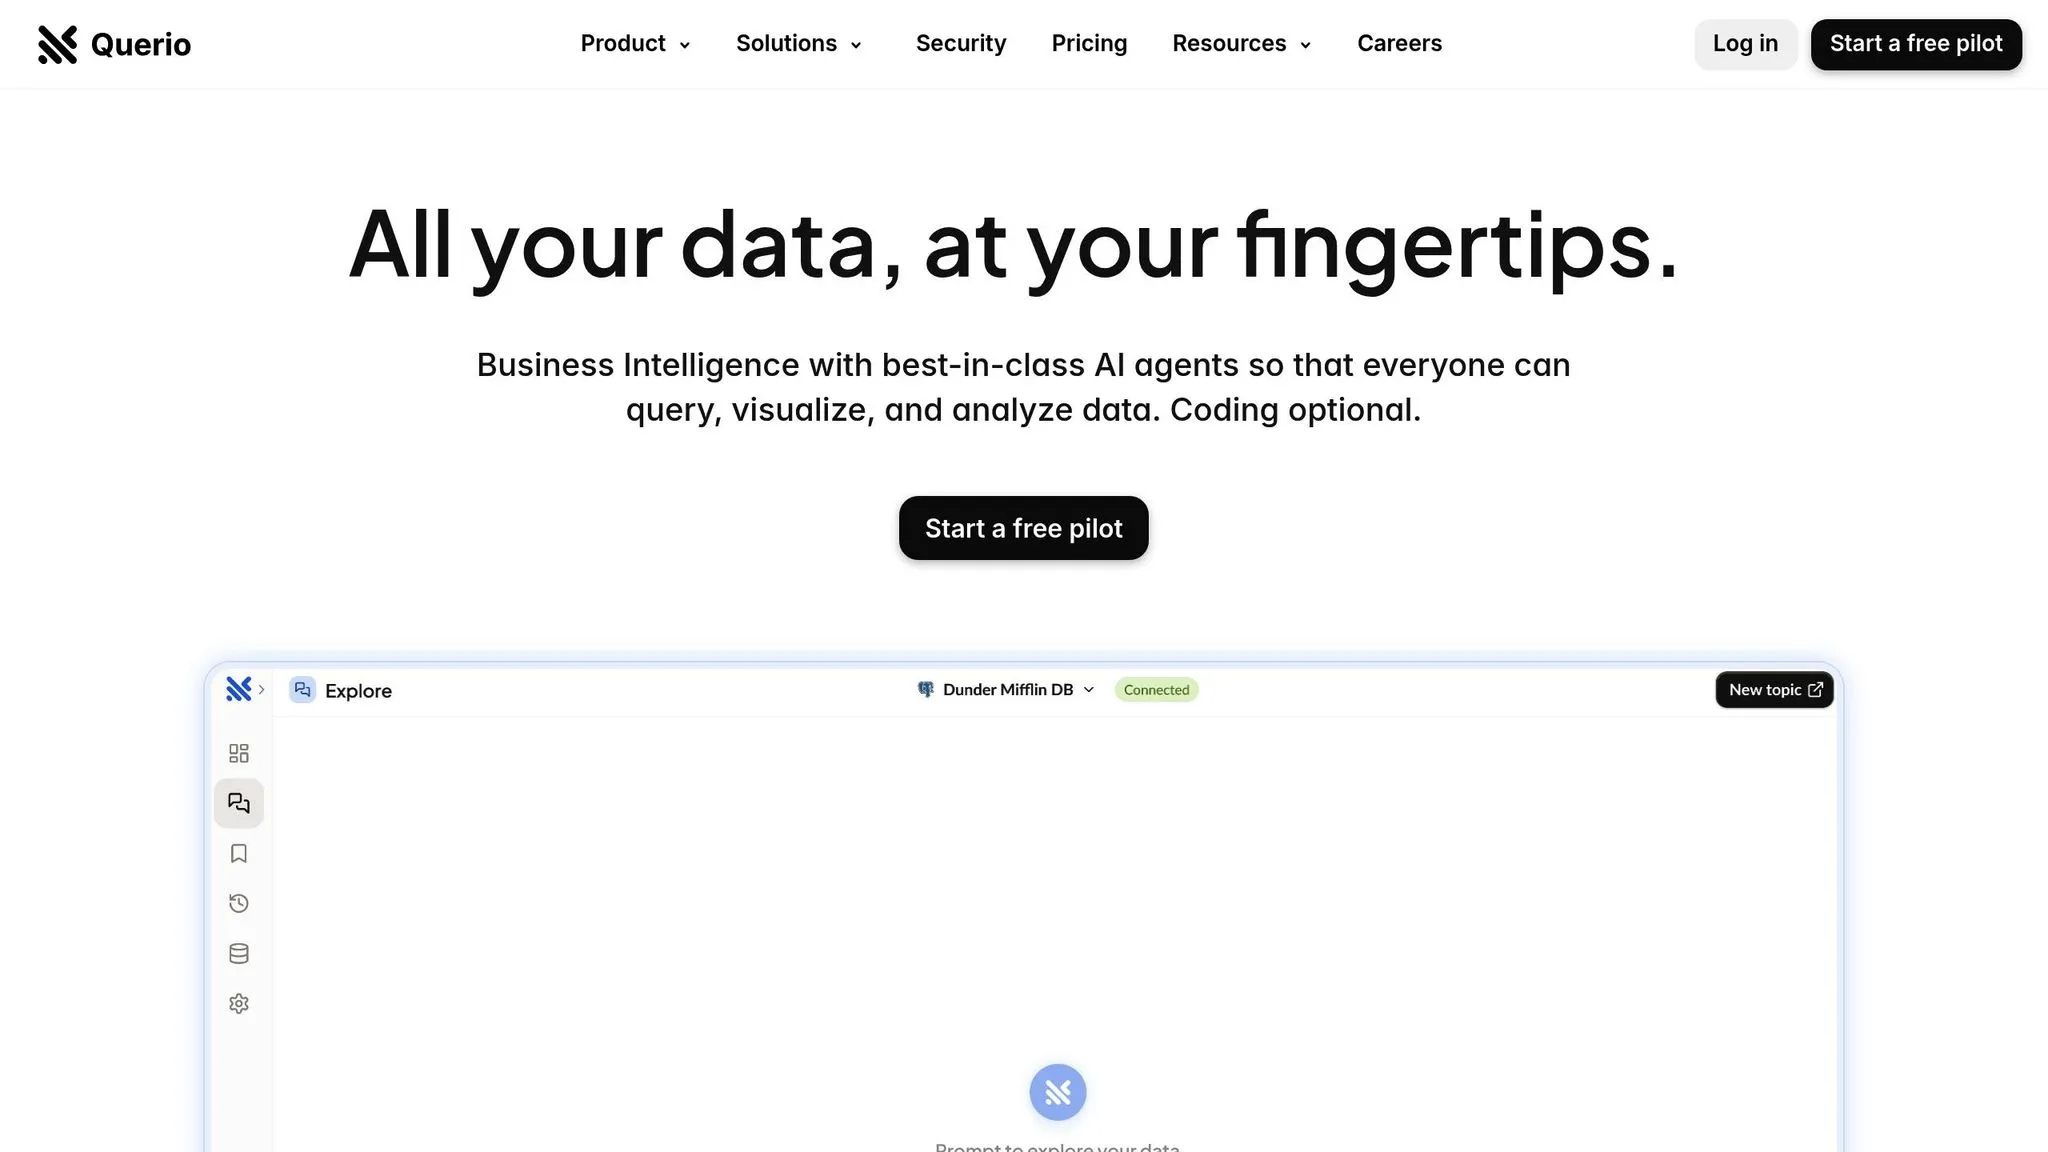
Querio is an AI-focused business intelligence platform that enables users to query live warehouse data using natural language. Essentially, you can type your questions in plain English and receive real-time visualizations based on the data. It integrates directly with major data warehouses like Snowflake, BigQuery, and Postgres - eliminating the need to create data copies.
One of Querio's standout features is that it has no per-seat pricing (unlimited users on every plan), which makes it a budget-friendly option for companies aiming to extend data access across different teams. It has a free plan with unlimited data connections and 500 AI credits a month.
Querio also includes a context layer for data governance, allowing data teams to define business logic, table relationships, and metric definitions in one place. This ensures consistent results across all queries. With SOC 2 Type II compliance and a 99.9% uptime SLA, Querio is a strong option for enterprises with strict security and reliability needs. The platform is also expanding its functionality with upcoming Python notebook integration, enabling deeper analysis within the same governed data environment.
Tableau
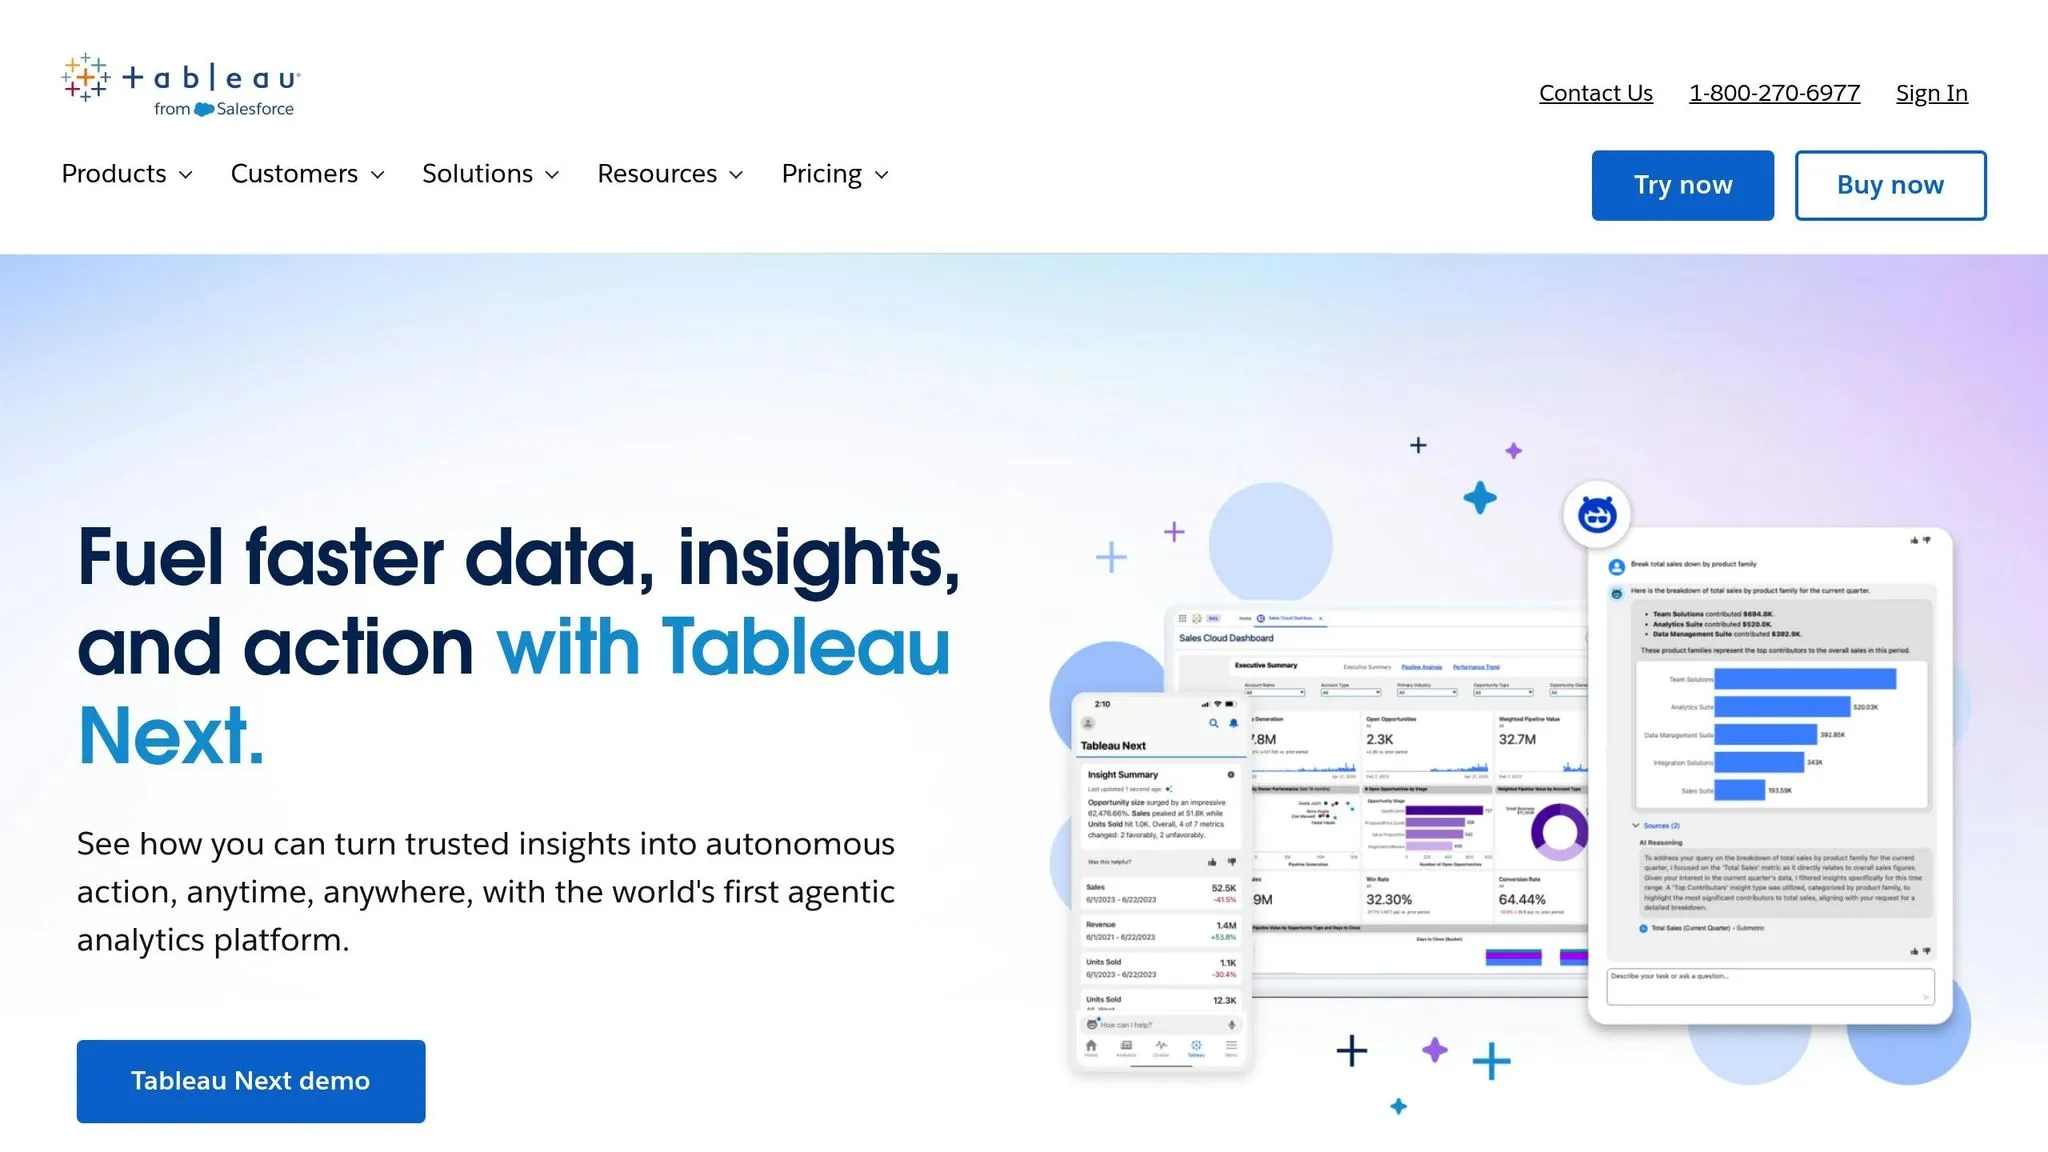
Tableau is widely recognized for its user-friendly drag-and-drop interface, which allows users to create interactive data visualizations without needing to write code. This makes it a favorite among business professionals looking to turn raw data into compelling visual narratives.
Tableau Public, a free offering, has cultivated a thriving community of data enthusiasts who share their visualizations online, providing a valuable resource for learning and inspiration. For enterprises, Tableau offers advanced features like data governance, security controls, and collaboration tools, making it suitable for larger organizational needs.
Power BI
Microsoft Power BI is deeply integrated into the Microsoft ecosystem, making it an excellent choice for companies already using Office 365 and Azure. This integration simplifies data extraction from tools like Excel and SharePoint. Users can create reports in Power BI Desktop, publish them to the Power BI service, and share insights via Microsoft Teams or embedded SharePoint reports.
Power BI is competitively priced, with Power BI Pro starting at $10 per user per month. For those needing more, Power BI Premium offers larger data capacities and more frequent data refresh options. The platform also includes AI-powered tools like the Q&A feature, which allows users to ask natural-language questions, and automated insights that spotlight key data trends.
Python Libraries (e.g., Pandas)
For those comfortable with programming, Python libraries offer unparalleled flexibility for advanced data analysis. Libraries like Pandas are ideal for data cleaning and manipulation, while others, such as NumPy, Matplotlib, Seaborn, Plotly, and Scikit-learn, handle everything from numerical computations to machine learning and data visualization.
As open-source tools, these libraries are free to use and benefit from continuous enhancements by a global community of developers. While they eliminate licensing costs, they do require skilled personnel for implementation and upkeep.
Many organizations combine Python with business intelligence platforms. Python is often used for data preparation and advanced analytics, while BI tools handle visualization and make data accessible to non-technical users. This hybrid approach allows companies to capitalize on the strengths of both methods while addressing their individual limitations.
Real-World Use Cases for Data Analysis Tools
Data analysis tools transform raw data into meaningful insights that businesses can act on. Here's how they make a difference in various areas.
Financial Performance Monitoring
Finance teams use data analysis tools to make smarter, faster decisions by keeping a close eye on key metrics like revenue, expenses, and cash flow. Instead of waiting for monthly reports, they can monitor financial health in real time and respond swiftly to changes.
- Revenue tracking: Teams can dive deep into sales data by product line, region, or customer segment to pinpoint top-performing areas. This also helps uncover seasonal trends and forecast future performance using historical data.
- Budget management: Comparing actual spending against planned budgets becomes seamless, allowing teams to spot discrepancies and adjust as needed.
- Cash flow forecasting: By pulling data from accounts receivable, accounts payable, and bank accounts into one view, teams can predict cash flow more accurately. This ensures they avoid shortages and manage working capital effectively.
Product and Customer Analytics
Product and marketing teams rely on data analysis tools to understand customer behavior and improve user experiences. These insights shape product development and targeted marketing strategies.
- User behavior analysis: Tracking how customers interact with products helps identify popular features and problem areas. Teams can prioritize updates based on real usage data rather than assumptions.
- Customer segmentation: Analyzing purchasing habits, demographics, and engagement levels allows marketing teams to craft campaigns tailored to specific customer groups.
- Product performance metrics: Beyond sales figures, teams can monitor daily active users, feature adoption rates, and customer satisfaction scores to assess product success.
- A/B testing insights: Experimentation becomes faster and more effective, helping teams fine-tune products based on what resonates with users.
Improving Operations
Operations teams leverage data analysis tools to streamline workflows, cut costs, and improve productivity. These tools help uncover inefficiencies and optimize processes across the board.
- Supply chain optimization: Real-time insights into inventory levels, supplier performance, and demand trends help prevent stockouts and reduce excess inventory costs.
- Quality control: Monitoring defect rates and identifying root causes enables teams to address quality issues before they escalate, saving time and money.
- Resource allocation: By analyzing employee productivity, project timelines, and resource usage, managers can balance workloads and keep projects on schedule.
- Cost reduction: Teams can analyze spending patterns to find savings opportunities, such as renegotiating vendor contracts or reducing utility expenses.
These insights not only improve day-to-day operations but also feed into high-level reporting for strategic decision-making.
Executive Reporting
Executives need quick, clear insights without diving into the details. Data analysis tools provide automated reports that keep leadership informed and ready to act.
- Scheduled dashboards: key performance indicators (KPIs) like revenue trends, customer acquisition costs, and productivity metrics are delivered directly to executives’ inboxes on a regular basis.
- Exception reporting: Alerts notify executives when metrics deviate from expected ranges, allowing them to address issues before they escalate.
- Board meeting preparation: Up-to-date visualizations and reports streamline the process of preparing for board meetings, eliminating the need for custom presentations.
- Strategic planning: Long-term trends and scenario modeling help leadership evaluate potential outcomes and make informed decisions about the company’s future.
The standout benefit across all these use cases is speed and ease of access. Teams no longer have to wait for custom reports from IT or data analysts. With modern tools, anyone can get the answers they need in minutes, enabling quicker decisions and more agile operations. These examples highlight how data analysis tools empower organizations with actionable intelligence at every level.
How to Choose the Right Data Analysis Tool
Selecting the right data analysis tool is a critical step that can shape the success of your analytics efforts. With so many options out there, the key is to focus on tools that align with your organization’s unique goals, technical setup, and long-term needs. Let’s break down what to consider when making this decision.
What to Look For
Data compatibility should top your list. The tool you choose must integrate smoothly with your existing data sources and infrastructure. If it doesn’t, you could face issues like poor data quality, integration headaches, performance slowdowns, or even the creation of isolated data silos [1][2]. Before committing, take stock of your current setup and identify any gaps. Ideally, the tool should work seamlessly with your data warehouses, eliminating the need for complicated ETL (Extract, Transform, Load) processes.
User skill requirements are another big factor. Some tools are built for data scientists and require coding expertise, while others are designed for nontechnical users, allowing them to query data using plain language. Think about who will be using the tool most often. Does your team need a platform that simplifies tasks, or do you require advanced functionality for technical users?
Governance and security become increasingly important as your analytics efforts grow. Look for tools that offer strong governance features, such as user permissions, audit trails, and centralized business logic. Security features like SOC 2 Type II compliance and encrypted credentials should be non-negotiable.
Scalability and performance are essential, especially if your data volume is expected to grow. A tool that works well with small datasets might not handle millions of rows efficiently. Consider tools with real-time data connections, as they often perform better than those requiring data duplication or lengthy refresh cycles.
Pricing structures can vary widely. For instance, Querio has a free plan, and Core is $2,499 per month. There is no per-seat pricing (unlimited users on every plan), and AI credits are included on every plan. When evaluating costs, don’t just focus on the upfront price - factor in additional expenses for extra databases, users, or premium features.
Implementation timeline is another practical concern. Some tools can be up and running in days, while others require months of setup and training. Be realistic about your team’s capacity and how quickly you need results.
These considerations form the foundation for evaluating tools effectively. Use the checklist below to guide your decision-making process.
Decision-Making Checklist
Here’s a simple framework to help you evaluate potential tools:
Technical Requirements:
- Does the tool integrate directly with your current data sources?
- Can it handle your data volume now and as it grows?
- Does it meet your security and compliance standards?
- Will it fit into your existing tech stack?
User Experience:
- Can your team use it without extensive training?
- Does it deliver answers quickly for common queries?
- Are the visualizations clear and actionable?
- Can users easily create their own reports and dashboards?
Organizational Fit:
- Is the pricing model aligned with your budget and usage needs?
- Can it be implemented within your desired timeline?
- Does the vendor provide sufficient support and training resources?
- Will it scale as your organization grows?
Governance and Control:
- Can data teams define business logic and metrics centrally?
- Are user permissions and access controls robust?
- Is data access trackable for compliance purposes?
- Does it include audit trails for accountability?
To make the best choice, start with a small pilot project. Use real data and actual business questions to test the tool. This hands-on approach often reveals practical challenges that sales pitches or demos might not highlight. Pay close attention to how quickly your team adapts to the tool and whether it genuinely speeds up decision-making without adding new hurdles.
Conclusion
Data analysis tools are at the heart of modern business intelligence, serving as a bridge between complex data warehouses and actionable insights. They empower teams across an organization to break through technical barriers and make well-informed decisions.
The true strength of these tools lies in their ability to make data accessible to everyone while ensuring governance and security. Features like modern business intelligence features like natural language data querying, direct database connections, and intuitive visualizations help eliminate traditional bottlenecks in decision-making processes.
Today’s analytics workflows require tools that can handle real-time data, scale with growing datasets, and integrate seamlessly with existing systems. The best solutions strike a balance between advanced functionality and user-friendly design, enabling organizations to maintain data quality and governance while giving teams the freedom to explore insights on their own.
Take Querio, for example. This AI-powered workspace addresses key analytics challenges with a natural-language agent that eliminates the need for SQL. By maintaining real-time data connections to platforms like Snowflake, BigQuery, and Postgres, Querio ensures up-to-date insights. Its governance tools allow data teams to define business logic once, maintaining control over how data is accessed and interpreted throughout the organization.
Investing in the right data analysis tool delivers measurable benefits - faster decision-making and stronger business outcomes. Whether it’s tracking financial performance, understanding customer behavior, or improving operations, the ability to quickly turn questions into actionable insights can become a lasting competitive advantage.
As data continues to grow in both volume and importance, organizations that choose tools tailored to their technical needs, user expectations, and strategic goals will be best equipped to unlock the full potential of their data.
FAQs
How can I choose the right data analysis tool for my organization's goals and budget?
To pick the best data analysis tool for your organization, start by defining your specific objectives and the kind of insights you aim to uncover. It's also important to assess your team's technical skills to ensure the tool is easy for them to adopt and use effectively.
Take a close look at the total cost of ownership - this includes not just licensing fees, but also expenses for training and ongoing support. Make sure the tool fits comfortably within your budget. Additionally, prioritize tools that can grow with your needs, integrate smoothly with your current systems, and offer trial periods or demos. Testing the tool beforehand helps you confirm that it works well with your existing workflows before committing financially.
By keeping these considerations in mind, you’ll be better equipped to choose a tool that aligns with your goals and remains practical and economical.
What security and governance features should you prioritize in a data analysis tool?
When choosing a data analysis tool, it's crucial to focus on security and governance features to protect sensitive information and meet compliance standards. Key capabilities to consider include encryption, data masking, and role-based access controls to ensure data stays secure and only accessible to authorized users. Tools that offer compliance management and data classification can also help you stay aligned with regulatory requirements.
On top of that, look for features like continuous data quality monitoring, automated security alerts, and detailed audit trails. These not only safeguard your data but also enhance transparency and accountability, fostering trust within your organization.
How does natural-language querying make data analysis easier for non-technical team members?
Natural-language querying makes data analysis easier by letting team members ask questions in plain, everyday language instead of relying on complicated technical commands. This approach removes the need for specialized skills, making it simpler and more intuitive for anyone to explore data.
With quicker, self-service insights, natural-language querying allows everyone on the team to play a role in data-driven decision-making. This not only encourages collaboration but also boosts workplace efficiency.