Business Intelligence
How to Connect Claude to ClickHouse for Analytics
Set up secure, read-only analytics access and choose between fast direct SQL or a governed semantic layer for consistent KPIs.

You have two ways to connect Claude to ClickHouse: direct MCP for fast setup, or Querio for shared metric rules. In both cases, I’d use a separate read-only user, TLS, and a reporting schema instead of raw tables. That setup lets teams ask plain-English questions and get back SQL, charts, and summaries from live ClickHouse data.
Here’s the short version:
- Direct ClickHouse MCP works best when I want the shortest path to a first query.
- Querio + ClickHouse fits better when a team needs the same KPI logic every time.
- I’d give Claude
SELECT-only access, use a 16+ character password, and connect over TLS. - For production, I’d prefer native TLS on port
9440. If that isn’t supported, I’d use HTTPS on8443. - I’d point Claude at reporting tables with clear joins and metric definitions, not staging data.
- Before trusting any answer, I’d inspect the SQL line by line.
In plain terms: direct MCP is about speed, while Querio is about control. If even 2 analysts can define “MRR” in 2 different ways, numbers drift fast. A governed layer helps stop that.
Quick Comparison
| Option | Best for | Setup | Metric consistency | SQL visibility |
|---|---|---|---|---|
| Direct ClickHouse MCP | Analysts and technical teams | Low | Lower | Mostly in query logs |
| Querio + ClickHouse | Teams sharing KPI definitions | Medium | Higher | In the Querio UI |
If I wanted one takeaway, it would be this: lock down access first, then pick between raw-schema speed and governed metrics.
::: @figure 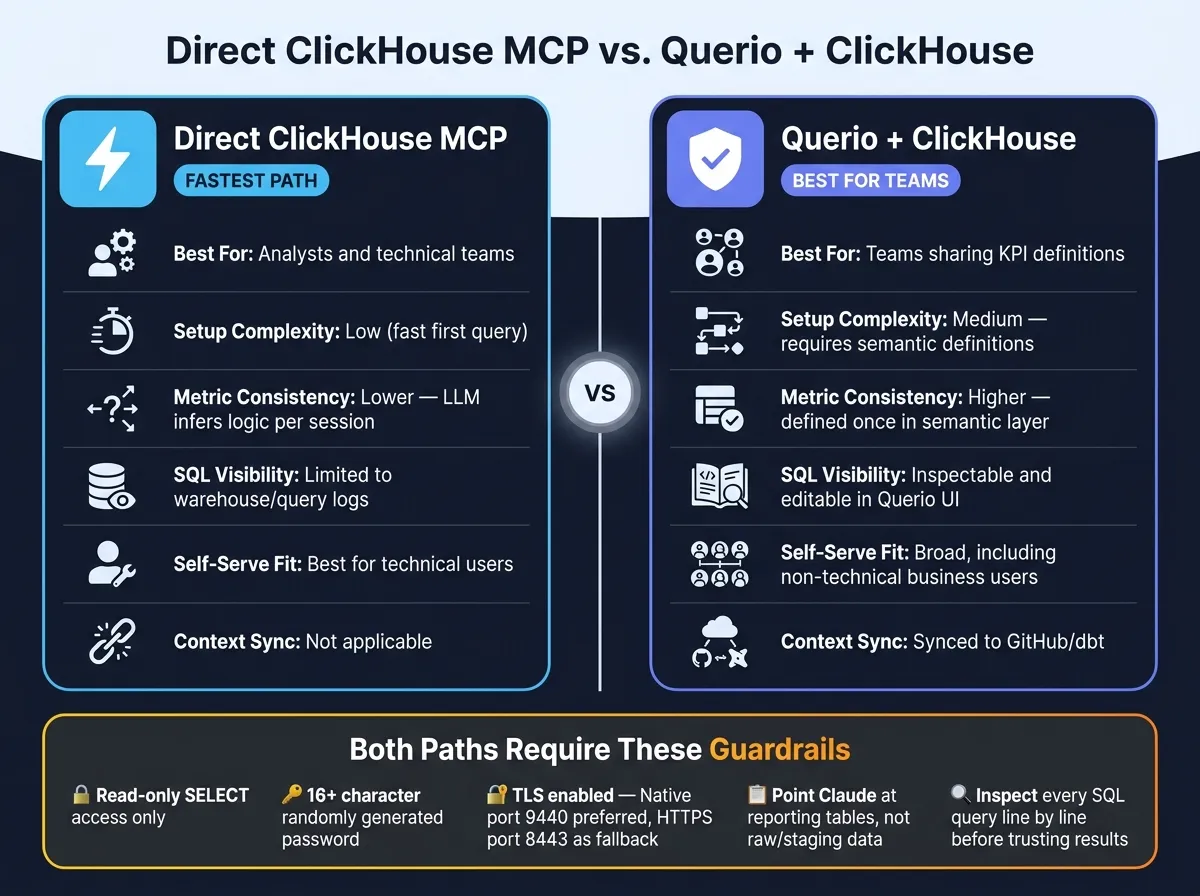 {Direct ClickHouse MCP vs. Querio + ClickHouse: Which Should You Choose?}
:::
{Direct ClickHouse MCP vs. Querio + ClickHouse: Which Should You Choose?}
:::
The ClickHouse MCP Server
::: @iframe https://www.youtube.com/embed/y9biAm_Fkqw :::
Prepare ClickHouse for safe read-only AI access
Before Claude touches production data, lock down ClickHouse. The subsections below walk through permissions, transport, and schema context in that order.
Create a dedicated read-only ClickHouse user
Set up a separate user account only for AI access. Run this in ClickHouse:
CREATE USER ai_read_only_user IDENTIFIED BY 'your-16-char-random-password';
GRANT SELECT ON analytics_db.* TO ai_read_only_user;
Use a password with at least 16 random characters [1]. Grant SELECT only on your reporting schema [1].
That gives Claude read-only access and nothing more. No writes. No schema changes. No room for accidents.
With that in place, the next step is the connection protocol and TLS port.
Choose HTTP or native connections and enable TLS
Claude needs a host, port, username, password, and TLS. The main decision here is whether to use HTTP or the native protocol.
| Feature | HTTP (8123 / 8443) | Native (9000 / 9440) |
|---|---|---|
| Latency | Higher (stateless) | Lower (persistent) |
| TLS support | Port 8443 | Port 9440 |
| Compatibility | Broadest - works with most web tools | Best for high-performance analytics |
| Fit for AI workloads | Good for simple tool-calling | Better for large result sets |
For production, use native TLS on port 9440. Use HTTPS on 8443 only if your MCP client can't use the native protocol.
If you're on ClickHouse Cloud, you can find the connection details in the cloud console. If you're running a self-managed instance, make sure port 9440 is open.
Once the transport layer is locked down, the next piece is schema context. That's what helps Claude write SQL that doesn't drift off course.
Structure schema context so AI-generated SQL is accurate
Claude writes better SQL when it can read curated reporting tables with documented columns, joins, and metric definitions. Point it to your reporting schema, not raw or staging tables.
A good rule of thumb: expose pre-aggregated metrics when you can. That way, Claude can answer KPI questions without guessing at business logic or piecing together half-finished source tables.
With a locked-down account, secured transport, and clean schema context, Claude is ready for a direct analytics connection.
Connect Claude Desktop directly to ClickHouse with the ClickHouse MCP server
You can connect Claude Desktop to ClickHouse through the ClickHouse MCP server by using the same read-only credentials and TLS settings from the previous section. That gives analysts a simple way to ask questions in plain English while still getting live ClickHouse results in a safe read-only setup.
Install the ClickHouse MCP server and dependencies
Install Claude Desktop and uv, which is used to install and run the MCP server package. Pass your ClickHouse credentials as environment variables instead of putting them directly in the config file.
After that, add those credentials to Claude Desktop's MCP config.
Add the ClickHouse MCP server to Claude Desktop
Open the Claude Desktop configuration file on macOS at ~/Library/Application Support/Claude/claude_desktop_config.json.
Add the ClickHouse MCP server under the mcpServers object and pass the connection details as environment variables:
| Parameter | Description |
|---|---|
CLICKHOUSE_HOST |
Address of the ClickHouse server or cluster |
CLICKHOUSE_PORT |
Connection port |
CLICKHOUSE_USER |
Dedicated read-only username |
CLICKHOUSE_DATABASE |
Target database for queries |
CLICKHOUSE_PASSWORD |
Secure password for the user |
The password and database should match the read-only ClickHouse setup from the previous section. Use the same ClickHouse protocol and port you already turned on above.
Save the file, then restart Claude Desktop. [1]
Once Claude can reach ClickHouse, test the setup with a read-only query.
Verify the connection with a real analytics query
Open a new Claude chat and ask it to list the available schemas or tables. If Claude shows the schemas or tables you expect, the connection is working.
Next, run a simple SELECT query against a reporting table you know well. During setup, it's smart to inspect the SQL before you trust the result.
If the connection fails, check these common causes:
| Issue | Root Cause | Fix |
|---|---|---|
| Connection refused | Wrong port or TLS mismatch | Use the same protocol and port already turned on above |
| Authentication failure | Bad credentials or missing user | Verify the ClickHouse username exists and matches the config |
| No rows returned | Missing SELECT privilege |
Run GRANT SELECT ON database.* TO user |
If the direct path works, the next step is to add governed metric and semantic layer definitions so everyone queries ClickHouse the same way.
Connect Querio to ClickHouse and expose governed context to Claude
When more than one person queries the same ClickHouse data, metric definitions tend to drift. Querio helps keep Claude tied to approved metric logic. That starts with how Querio connects to ClickHouse and what context it keeps.
Set up a live ClickHouse connection in Querio
Querio connects to ClickHouse with the same read-only credentials you already created. Enter these values in Querio’s connection settings:
| Parameter | Description |
|---|---|
HOST |
Address of your ClickHouse server or cluster |
PORT |
9440, the default for secure native protocol connections in ClickHouse Cloud [1] |
DATABASE |
The specific database Querio should query |
USERNAME |
Dedicated read-only user, such as querio_user |
PASSWORD |
Secure password for the dedicated user |
Querio runs live queries against ClickHouse through encrypted, read-only credentials. So Claude works from current data, without exports or stale extracts.
Once that live connection is set, the next step is to add the metric and join definitions Claude should rely on.
Add metric definitions, joins, and trusted queries to Querio
Querio adds approved meaning to your columns. Its context layer stores metric definitions, joins, trusted queries, and business terms as plain SQL, Markdown, and Python files. Those files live in GitHub, in the same repo as your dbt models. So when a dbt model changes, the context changes with it.
For example, you can define MRR once in the semantic layer as SUM(net_amount_usd) net of refunds. After that, every surface - including notebooks, dashboards, Slack answers, and Claude via MCP - uses that same formula automatically. That keeps KPI answers steady as teams move from ad hoc analysis to reporting.
Predefined joins matter just as much. If Claude has to guess how events connects to accounts, it might pick the wrong join type and quietly drop rows. Markdown glossary files help here too. You can spell out terms like "Active User" or "Enterprise Segment" so Claude answers with your company’s definitions, not its best guess.
Every answer is inspectable and editable in Querio’s notebook.
Direct ClickHouse MCP vs. Querio + ClickHouse: a side-by-side comparison
The direct route is faster to set up. If you’re one analyst prototyping on a dataset you know well, it’s a fair place to start. Querio asks for more work up front - metric definitions, joins, and glossary terms - but that work starts paying off as soon as multiple people need the same answer.
| Feature | Direct ClickHouse MCP | Governed MCP Layer (Querio) |
|---|---|---|
| Setup Complexity | Low (fast first query) | Moderate (requires semantic definitions) |
| Metric Consistency | Low (LLM infers logic per session) | High (defined once in semantic layer) |
| SQL Inspectability | Limited to warehouse logs | Inspectable and editable in Querio UI |
| Self-Serve Fit | Best for technical users | Broad (non-technical business users) |
| Context Sync | Not applicable | Synced to GitHub/dbt |
Both paths connect live to ClickHouse. Neither depends on extracts. The key difference is context: direct MCP gives Claude the schema, while Querio adds approved metric logic.
Next, use those governed definitions in day-to-day prompts, charts, and KPI checks.
Run and govern ClickHouse analytics workflows in production
Prompts that produce inspectable SQL, charts, and summaries
Once Claude is connected, the next move is simple: ask for outputs you can check line by line. That means prompts should spell out the metric, scope, time grain, filters, and output type.
| Question Component | Revenue Drop Example | Enterprise Signups Example |
|---|---|---|
| Metric | Net MRR change (USD) | New enterprise accounts per week |
| Scope | Active subscriptions excluding tests | account_tier = 'Enterprise', excluding internal domains |
| Time grain | Weekly, compared with prior week | Weekly, last 12 weeks |
| Dimensions | Sales region, plan type | Sales region |
For example, a prompt like "Show me why net MRR changed by sales region last week, excluding test accounts. Return the SQL, a bar chart, and a one-sentence summary." gives Claude enough detail to write a clean query you can inspect, instead of taking a wild guess at your schema.
Match the chart to the job:
- Use line charts for trends
- Use bar charts for comparisons
- Use cards for headline KPIs
- Use tables for row-level detail
That same prompt structure works well for sales analysis, metric debugging, and KPI review.
Apply guardrails for auditability and regulated data
After the prompts are working, tighten permissions and lock metric definitions before people start using the output as fact.
Read-only access is necessary, but it doesn't make analytics audit-ready on its own. Start with least-privilege access. Your dedicated user should have GRANT SELECT only on the exact databases or tables Claude needs - nothing more [1]. Pair that with a long, randomly generated password stored in a secrets manager, not in a config file.
For regulated data - PHI in healthcare or PII in fintech - keep access tied to the permissions the user already has. Querio's role-based access control and OAuth-based MCP help make sure agent queries inherit the querying user's data permissions. In plain English, each analyst stays inside the data scope they're already allowed to use.
Credentials are only part of the story. Schema context and metric definitions also need to be explicit. If schema context is fuzzy, LLMs can misread joins and business terms. Define revenue, active users, and enterprise segment in one central place so Claude applies the same logic across every query - not just in ad hoc sessions, but also in any audit trail that comes later.
Conclusion: choose the right connection path and keep metrics consistent
Direct MCP is the fastest path. Governed context is the better fit when teams need consistent KPI logic, inspectable SQL, and shared definitions.
FAQs
::: faq
When should I use direct MCP instead of Querio?
Use direct MCP when you want to dig into data fast or sketch out a prototype without dealing with the extra setup of a semantic layer. You get immediate access to your ClickHouse schema, which makes this a solid choice for one-off analysis.
Move to Querio when you need shared metric definitions, stable logic across sessions, and auditable query history. :::
::: faq
How do I keep Claude from querying sensitive or raw tables?
Route requests through a governed semantic layer instead of giving Claude direct warehouse access. Use a dedicated read-only service account that can query only approved, non-sensitive analytics views.
On top of that, enforce row-level security and column-level masking. Then validate any generated SQL before it runs, so you can block unauthorized table access and risky query patterns. :::
::: faq
What should I check before trusting Claude’s SQL answers?
Before you trust Claude’s SQL, make sure the logic lines up with your governed business definitions and schema, not just the model’s read of the raw data.
Check the SQL for bad joins, missing filters, and wrong metric formulas. Then compare the output against a trusted baseline, like a dbt model, Looker dashboard, or Hex notebook, before you share the results. :::