Business Intelligence
BI as Code Tools: Can a Dashboard Change Without a PR?
Twelve BI as code tools checked on one question: can a dashboard or a permission change without a merged pull request? What each keeps in git, what goes live without review, and what each costs to start.
 Javier BonillaCo-founder & CTO
Ask any BI as code vendor one question: can someone change a dashboard or a permission without a merged pull request? On most tools, yes. Looker, Holistics, Rill and Evidence can keep dashboards and access rules as files, but whether a change has to pass review before it goes live depends on settings and branch rules you add yourself. Querio routes every promoted dashboard and context change through a pull request in your own repo.
Writing a metric in YAML is the easy part, and nearly every tool here does it. The repo is your source of truth only if the changes people rely on have to pass through it.
Can a change skip review in each tool?
| Tool | Kept as files in git | How a change goes live | What can stop a bad change | Price to start |
|---|---|---|---|---|
| Querio | Context, metrics, saved queries, dashboards, notebooks and permission policies, in your own GitHub repo | Promoting a dashboard or saving context opens a pull request; merging makes it live | Your repo's branch protections and reviewers; CI flags every dashboard, query and context file a renamed dbt model breaks | Free plan, $0, unlimited users |
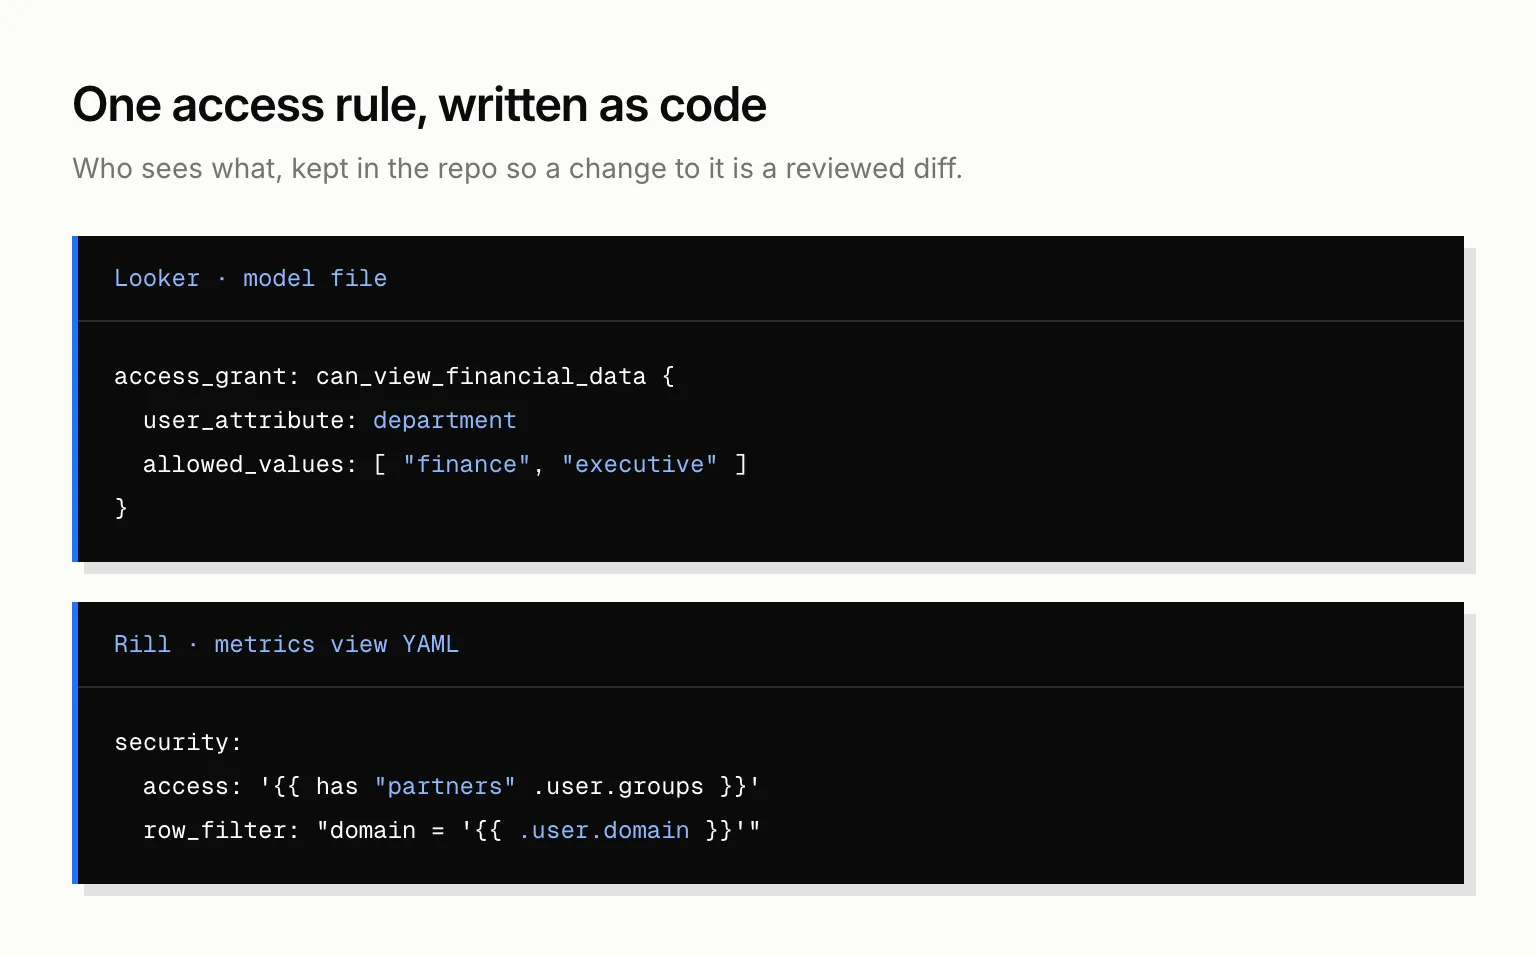
| Looker | LookML models, LookML dashboards, access grants | Merge to the production branch and deploy; an admin can require pull requests | Looker CI validators (SQL, Assert, Content, LookML, Style) | Contact sales |
| Lightdash | Metrics in dbt YAML; charts and dashboards as YAML | CLI upload, or Git-managed mode with a view-only UI | lightdash validate in CI; preview projects |
Open source self-hosted; Cloud Pro from $3,000/month |
| Holistics | Models, metrics, dashboards and row-level permissions in AML | Publish from development to a read-only production branch | Report Validation before publish | Entry $800/month, billed yearly |
| Omni | Model files; documents in git in beta | Branch Mode, with a button that opens a pull request | Required pull requests are a setting, off by default | No public price |
| Evidence | Markdown and SQL pages; page access in access.yaml |
Merge to the published branch (GitHub only) | Markdown and access.yaml checks on each pull request, with a preview link |
Team $2,500/month |
| Rill | Metrics views, dashboards, access rules and row filters in YAML | Deploys when you push to the connected GitHub branch | Your own branch protection; no review step of its own | Starter $20/seat/month plus usage |
| Cube | The data model | Development mode per branch, then Publish | Publish turns into "Pull request required" when your branch rules demand one | Free tier; $40 per developer/month |
| Power BI | Report and semantic model as PBIP and TMDL files, with row-level security roles | Fabric Git integration, in preview for reports and models | Whatever CI and deployment pipeline you build | Pro $14/user/month, billed yearly |
| Metabase | Metrics, questions, dashboards and models, through remote sync | A development instance pushes to a branch; a read-only production instance pulls what's merged | Review in your git host; production can't be edited | Pro $575/month for 10 users |
| Hex | Projects as YAML | Publishing merges to the publish branch | Required pull requests survive only as a legacy setting | Team $75 per editor/month |
| dbt Semantic Layer | Metrics in the dbt project's YAML; no dashboards | Through your dbt project | Your dbt project's own checks | Starter $100 per user/month |
Two gaps hide behind those rows. Metabase's remote sync leaves permissions and groups out of git, so who can see what is still set in the app. And Looker's user-defined dashboards, the ones people build in the browser, live in Looker, not in your LookML project.
The 12 tools
1. Querio
Querio is git-native analytics for data teams and their AI agents. Context files, metric definitions, saved queries, dashboards, automations, notebooks and permission policies are plain files in a GitHub repo you own, and they sync both ways with the app, the CLI and the MCP server.
Drafts don't need a reviewer. Dashboards are marked experimental, team or trusted, and experimental work stays in the app. Promoting a dashboard or saving context opens a pull request in your repo. Your own branch protections and reviewers apply, and merging makes the change live. Whoever can merge to main can promote a dashboard to trusted.
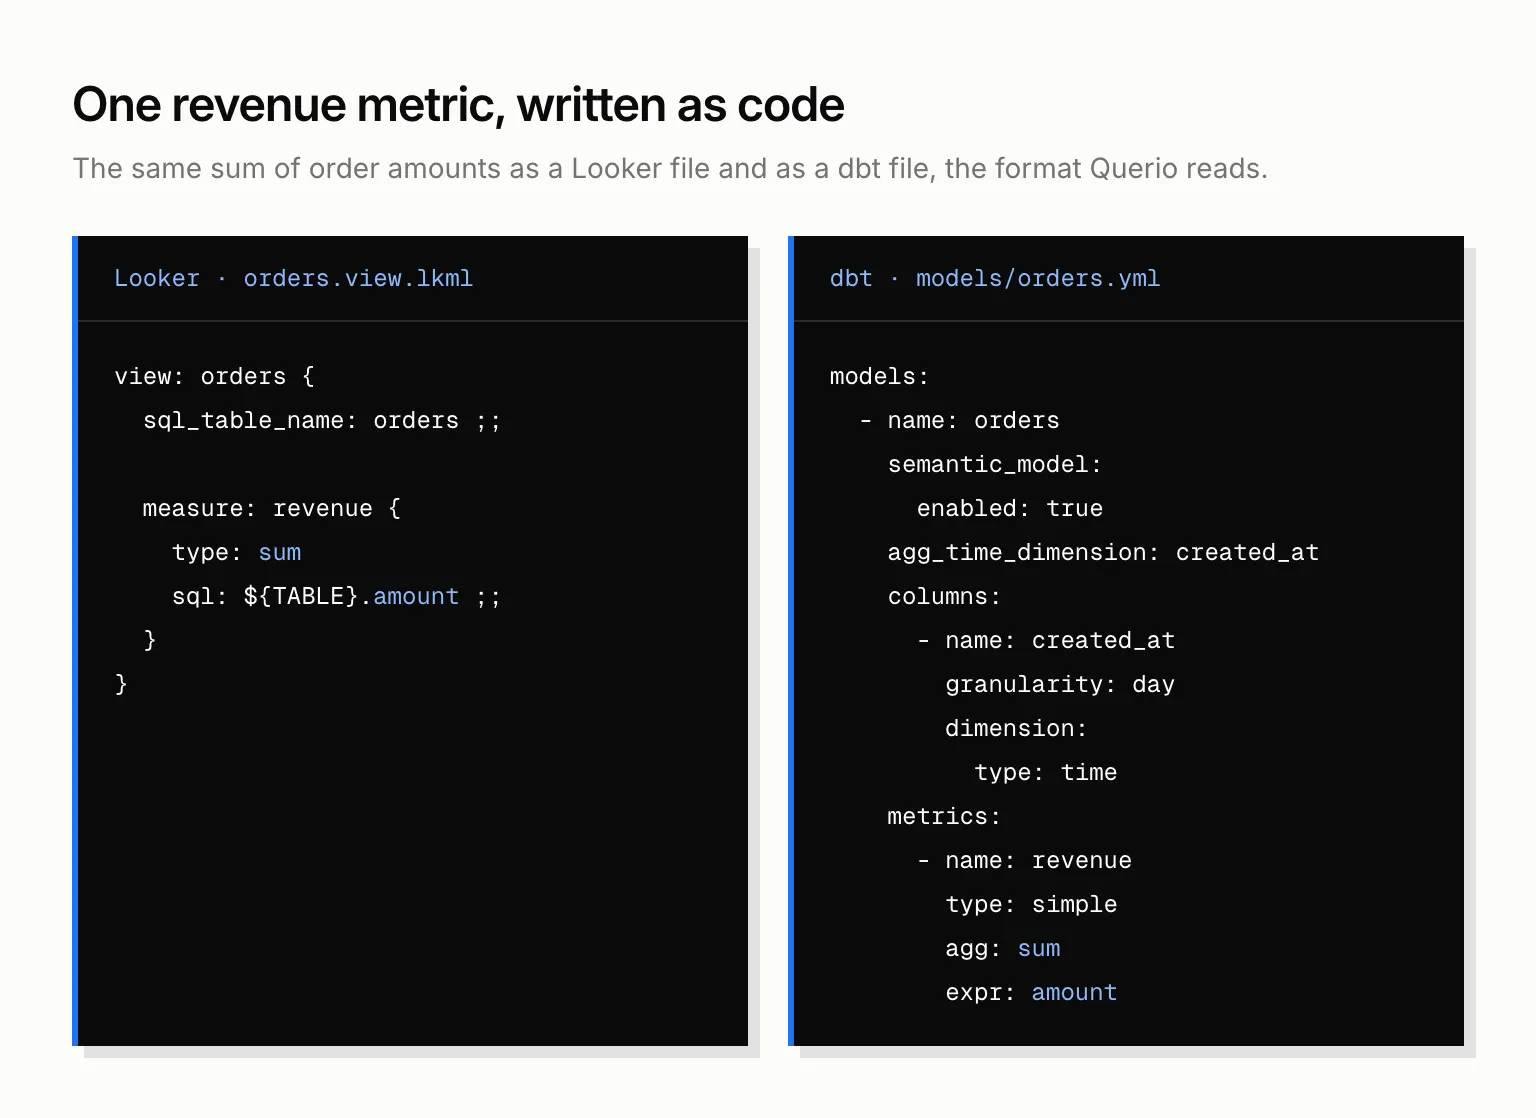
Rename a dbt model, and CI flags every dashboard, query and context file that uses it before the pull request can pass. Querio reads dbt's semantic_manifest.json, so your MetricFlow metrics stay in dbt with no second copy. Without dbt, Querio commits metrics as files in MetricFlow format.
Agents work in the same repo. Claude and ChatGPT reach it through the MCP server, Claude Code and Cursor through the CLI, and an agent sees only what its user sees. It can propose a context change, and a person saves it.
Price: Free is $0 with unlimited users and GitHub included. Core is $2,499 a month and adds GitLab and Bitbucket. Only AI model calls are metered, as credits.
2. Looker
LookML is the original BI as code. Models, LookML dashboards and access grants are .lkml files in the project's git repo, developers commit and merge from the Looker IDE, and Looker CI runs SQL, Assert, Content, LookML and Style validators.
Limit: pull requests are optional until an admin requires them.
Price: no public price; Looker sells through its sales team.
3. Lightdash
Lightdash reads metrics from your dbt YAML. Charts and dashboards come down as YAML with lightdash download and go back with lightdash upload, and lightdash validate fails a CI run when a chart breaks.
Limit: dashboards are files only if you choose Git-managed mode, which makes that content view-only in the app. The other mode is download, edit, upload.
Price: open source self-hosted, or Cloud Pro from $3,000 a month with no per-seat pricing.
4. Holistics
Holistics models, metrics and dashboards are AML files, and row-level permission rules sit in the dataset code. Production is read-only, and Report Validation checks for broken reports before you publish.
Limit: below Standard, Holistics hosts the repo, not you. Standard runs $1,000 a month, paid yearly.
Price: Entry is $800 a month billed yearly.
5. Omni
Omni syncs its model files with your git repository, and Branch Mode turns on once git is connected. Keeping documents in git is in beta.
Limit: pull requests aren't required by default. The requirePullRequest setting decides.
Price: no public price.
6. Evidence
Evidence pages are Markdown with SQL, and page access lives in access.yaml. Each pull request runs Markdown and access checks and posts a preview link.
Limit: GitHub is the only git provider. Row-level access rules come with Enterprise.
Price: Team is $2,500 a month with unlimited users.
7. Rill
Rill keeps metrics views, dashboards and access policies, row filters included, in YAML, and deploys from a connected GitHub repo.
Limit: every push to the connected branch is a deploy. Rill's deploy docs name no review step or check of their own, so your branch protection is the only gate.
Price: Starter is $20 per seat a month, plus usage.
8. Cube
Cube is a semantic layer first. Its data model lives in a repo, and development mode gives each branch its own API endpoints to test against.
Limit: Cube's docs don't describe keeping dashboards as files.
Price: a free tier, then $40 per developer a month.
9. Power BI
Save a report as a Power BI Project (PBIP) and the report and semantic model become text files, the model in TMDL, row-level security roles included.
Limit: Fabric's Git integration for reports and semantic models is still in preview, and review is the pipeline you build.
Price: Pro is $14 per user a month, billed yearly.
10. Metabase
Remote sync pushes your Library (metrics, segments, snippets) and synced collections' questions, dashboards and models to a git branch. A read-only production instance pulls only what's merged.
Limit: remote sync needs Pro or Enterprise.
Price: Pro is $575 a month with 10 users.
11. Hex
On the Team and Enterprise plans, Hex syncs projects to GitHub or GitLab as YAML, and publishing merges to the publish branch.
Limit: requiring pull requests before publish is a legacy feature, and Hex says most edits are meant to happen in Hex.
Price: Team is $75 per editor a month.
12. dbt Semantic Layer
The dbt Semantic Layer keeps metrics as YAML in your dbt project, next to the models they describe. It has no dashboards: the BI tool that reads it supplies them. Querio is one of those tools.
Price: included on dbt Starter at $100 per user a month, not on the free Developer plan.
Isn't BI as code too much for business users?
Plenty of data people say so. In one r/dataengineering thread, one commenter wrote "I've mostly seen non-tech people struggling with it," and a Lightdash user said "each chart can have up to 400-500 rows of yml."
They're right about editing. Nobody in sales should hand-write chart YAML. But the file is where the record lives, not where people work. They keep building in an app or asking an agent, and what changes is where the result lands: a commit someone reviewed, instead of a setting nobody can trace. Setting that up for your SQL and dbt first? Our guide to versioning analytics logic with git walks through it.
How we picked
These are the tools on Google's first page for "bi as code tools", "bi as code" and "dashboards as code", and the ones AI answers name when asked which BI tools keep metrics as code in git.
Left out: Streamlit, an app framework with no metrics model. Basedash, whose own BI as code post says it has no git integration. Apache Superset, which exports and imports YAML but has no git in the product.
FAQ
What is BI as code?
BI as code means your metrics, dashboards and access rules are text files in a git repo, changed by commits and reviewed in pull requests, instead of settings saved inside a BI tool.
Is dashboards as code the same thing?
It's one layer of it. Dashboards as code covers the charts and layouts. BI as code also covers the metric definitions underneath and the rules for who sees what. A semantic layer alone covers only the metrics.
Is there a free BI as code tool?
Yes. Querio's Free plan is $0 forever and includes the GitHub sync, the MCP server and the CLI. Lightdash has an open-source edition you host yourself.
Can AI agents work in a BI as code repo?
Yes, and it's the safer way to let them in. An agent edits a file, and the change shows up as a diff a person can review.