Business Intelligence
The Anatomy of a Daily Business Health Check (With AI Root-Cause Analysis)
Daily routine to detect and diagnose revenue changes using governed metrics, baselines, and AI-assisted root-cause analysis.

I use a daily business health check to decide what needs attention - not just report what changed. I start with complete data, approved metric definitions, and a matched baseline. Then I use AI to rank possible drivers, while keeping measured changes separate from proven causes.
In the article’s hypothetical example, a 20% drop in booked purchase value totals $20,000. Paid-search orders account for $15,000 of that loss - but that calculation doesn’t explain why orders fell.
Here’s the routine I follow:
- Check data readiness and compare completed reporting windows.
- Flag changes using dollar impact, percentage change, and order volume.
- Trace losses through orders, conversion, channels, and customer segments.
- Test possible causes against logs, releases, and payment records.
- Use Querio to schedule the analysis, share supporting queries, and assign owners and next steps.
I start with three to five key performance indicators and expand only when the checks lead to clear follow-up without adding noise.
AI in Root Cause Analysis: From Detection to Prevention
::: @iframe https://www.youtube.com/embed/E1r1gVOSiSc :::
Define Metrics and Reporting Windows
Use a fixed set of core metrics: recognized revenue, orders or transactions, conversion rate, qualified traffic, retention, and data readiness. For subscription businesses, track new bookings, active subscriptions, churn, expansion revenue, and collections. Report monthly retention over its monthly window, not as a daily metric. Consistent definitions and readiness checks help prevent false alerts and keep revenue-drift analysis reliable.
Document Each Metric
Give each metric a contract that spells out its business meaning, formula, source model, row grain, joins and join keys, inclusions and exclusions, business and technical owners, approved breakdown dimensions, and update time.
Document join cardinality so customer or campaign joins don't multiply revenue rows. For conversion metrics, keep both the numerator and denominator. Allow useful breakdowns by plan, acquisition channel, account segment, and cohort.
| Financial metric | What it measures | Definition authority |
|---|---|---|
| Recognized revenue | Revenue earned as performance obligations are satisfied | Finance-approved accounting policy, including ASC 606 |
| Bookings | Signed contract or committed sales value | Sales and finance-approved definition |
| Cash collected | Cash received, including payments for earlier invoices or future services | Finance-approved collections policy |
Recognized revenue, bookings, and cash collected are separate metrics. Querio stores approved definitions and analytical logic as SQL, Markdown, and Python files. Keep these files synced to GitHub alongside dbt models. SQL holds calculations, Markdown explains assumptions and ownership, and Python holds baseline or validation logic. Review definition changes through pull requests, and record the effective version in each report.
Set Baselines and Check Data Readiness
Set 8:00 a.m. ET as the reporting cutoff for the previous completed day. On October 3, 2026, that means October 2 activity - not a partial October 3 total.
Compare results against the median of the previous eight comparable weekdays. Document any adjustments for holidays, promotions, and outages. Require both percentage and absolute-impact thresholds, and use a longer lookback for low-volume segments. This baseline gives you a reference for detecting meaningful changes.
Before interpreting results, check source update times, warehouse update times, completed dbt models, schema and volume checks, distinct IDs, non-null fields, valid relationships, late-arriving data, and reconciliation to trusted totals. dbt freshness checks support warning and error thresholds, but freshness alone doesn't prove completeness.[1][2]
If a critical check fails, mark the result not ready for analysis. Keep data status separate from business status. With approved definitions and ready data, the daily check can compare changes and isolate drivers worth investigating.
Detect Changes and Investigate Revenue Drivers
Start by validating inputs. Then calculate the metric, compare it with the approved baseline, flag material changes, investigate drivers, and assign follow-up. Keep the decomposition reproducible. AI can draft diagnostic branches and summarize evidence, but it cannot turn a hypothesis into a verified cause. Once the metric is ready, isolate which channel, segment, or process changed.
Flag Changes Worth Investigating
Set business thresholds that combine dollar impact, percentage change, weekday-adjusted expectations, and minimum volume.
A policy could require both a $10,000 daily decline and a 15% drop before investigation.[4]
Each flag should include the current value, baseline, absolute and relative change, sample size, severity, and data-quality status. Report conversion changes in percentage points, alongside the relative change. If critical readiness checks fail, withhold business interpretation.[4] Then trace the change into orders, conversion, and segments.
Check Orders, Conversion, and Customer Segments
For transactional revenue, trace revenue through orders, eligible traffic, and conversion. Use the same order population and reporting window throughout.[3] Check traffic sources first, followed by customer segments, plans, devices, and regions. For each breakdown, show sessions, orders, conversion, AOV, revenue, and contribution.
Keep overlapping breakdowns separate. Paid-search losses and regional losses may refer to the same orders. Adding them together would double-count the impact.
For subscriptions, examine new subscriptions, renewals, expansion, contraction, churn, and billing events separately. Check failed payments, refunds, credits, and invoice timing before attributing a decline to customer behavior. An order-based decomposition does not explain recognized subscription revenue by itself. Connect billing and subscription changes to the approved accounting measure. Then rank the drivers by impact and decide what the team should check first.
Rank Findings and Assign Next Steps
Label each statement by evidence type. Rank issues by financial impact, persistence, evidence strength, and actionability. Attach the query, data snapshot, comparison window, and supporting artifacts. Inspectable SQL and Python let reviewers check the analysis behind the narrative.
Give each finding an owner, next check, review time, and escalation condition. Use measurable triggers.
Triggers could include conversion below 2.5% for two consecutive checks or checkout errors above 1%.[5]
| Evidence label | What it establishes | Required follow-up |
|---|---|---|
| Verified observation | A measured change reproducible from the source data | Confirm scope and business impact |
| Calculated contribution | A driver’s contribution under a documented decomposition | Reconcile to the total; disclose mix effects |
| Hypothesis | A plausible explanation, not a proven cause | Test timing, affected population, mechanism, and magnitude |
| Unknown | Evidence is missing or inconclusive | Assign the missing-data or validation check |
The next section applies this workflow to a 20% revenue decline.
Worked Example: A 20% Revenue Decline
::: @figure 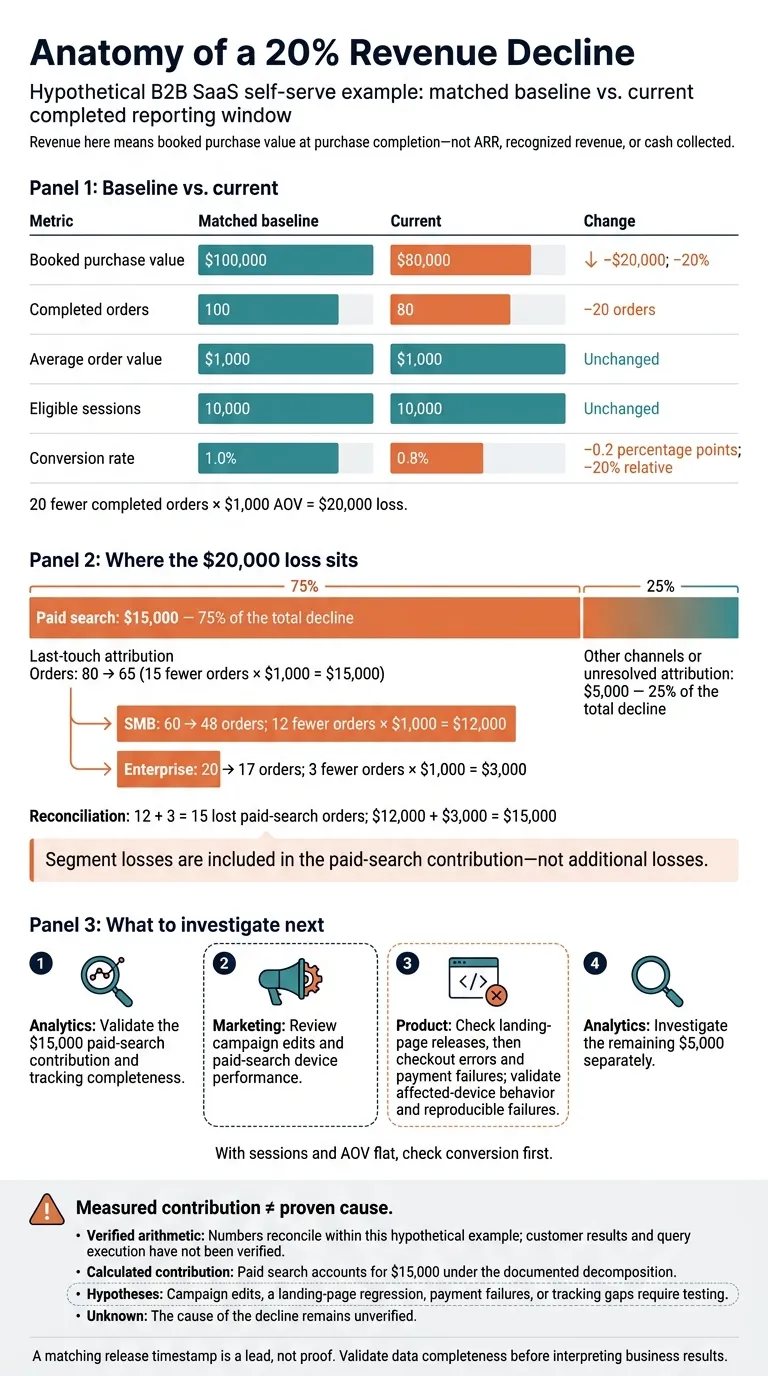 {Anatomy of a 20% Revenue Decline}
:::
{Anatomy of a 20% Revenue Decline}
:::
In this example, a B2B SaaS self-serve purchase decline triggers a daily check that traces the loss to its drivers. Revenue means booked purchase value at purchase completion, not ARR or cash collected. Compare the current window with a matched baseline. This hypothetical example narrows the drop to the channel and segments driving it.[9]
Trace the Decline to Paid-Search Orders
Booked purchase value falls from $100,000 to $80,000, while orders fall from 100 to 80. Average order value stays at $1,000. Eligible sessions remain 10,000, so conversion drops from 1.0% to 0.8% - down 0.2 percentage points, or 20% relative to baseline. Fewer completed orders explain the $20,000 gap; the cause is still unverified.[7]
Within total orders, under last-touch attribution, paid-search orders fall from 80 to 65. At $1,000 per order, those 15 fewer orders explain $15,000, or 75% of the decline. Paid-search SMB orders fall from 60 to 48, and enterprise orders from 20 to 17. These segment losses reconcile to the channel’s 15-order loss; they are not additional contributions or proof of cause. The remaining $5,000 comes from other channels or unresolved attribution.[6][8]
The next step is to package those findings into a daily summary with evidence and open questions.
Write the Daily Summary With Supporting Evidence
Attach the SQL or Python used for each finding, in Snowflake or BigQuery. The table below lists the evidence behind each finding. Verified here means the numbers reconcile within the example, not that customer results or query execution have been verified. A landing-page regression remains a hypothesis.[9][10]
| Finding | Evidence or check | Hypothesis or open question | Next action |
|---|---|---|---|
| Verified arithmetic: Booked value down $20,000; 20 fewer orders | Sum booked value; count distinct completed orders | Have any orders arrived late? | Check data recency and reconcile source records |
| Verified arithmetic: AOV unchanged at $1,000 | Booked value ÷ orders | Stable AOV may hide pricing or plan-mix changes; inclusion rules need validation | Check mix and treatment of discounts, refunds, and taxes |
| Verified arithmetic: Sessions flat; conversion down 0.2 percentage points | Eligible sessions; matched orders ÷ sessions | Funnel performance or traffic quality changed; affected device and step unknown | Compare device conversion and stage drop-offs |
| Calculated contribution: Paid search explains $15,000; SMB lost 12 orders, enterprise lost 3 | Orders and value by channel and segment | Campaign edit or landing-page regression; mechanism and remaining $5,000 unresolved | Review campaign edits, page releases, and segment conversion |
| Unknown: Checkout and tracking status | Payment failures; event-to-order reconciliation; source completeness | Payment failures or tracking gaps may distort results | Inspect logs, duplicate or missing events, and source fields |
That summary then tells the team what to inspect first.
Prioritize the Team’s Follow-Up
With sessions and AOV flat, conversion is the first check, ahead of a broad acquisition or pricing review. The daily check turns one revenue drop into ranked, owner-assigned follow-up work:
Start with Analytics, which validates the $15,000 paid-search contribution and tracking completeness. Next, Marketing reviews campaign edits and paid-search device performance.
Then Product checks landing-page releases, followed by checkout errors and payment failures. A matching release timestamp is a lead, not proof; the team must validate affected-device behavior and reproducible failures. Finally, Analytics investigates the remaining $5,000 separately.
Carry these findings, open questions, and owner assignments into the Querio workflow.
Run the Daily Check in Querio
Connect Warehouse Data and Review the Analysis
Turn the revenue-decline workflow into a daily routine. Connect Querio to Snowflake, BigQuery, Redshift, or PostgreSQL through live, read-only warehouse access - no CSV exports needed. Store approved metric logic in Querio’s context layer as SQL, Markdown, and Python synced to GitHub. Give the warehouse role access only to the required schemas and tables.
Before reading the results, check refresh status, window completeness, and basic data quality. Note any changes to pipelines, tags, payment feeds, or order statuses. If the data fails these checks, mark the check not ready for analysis. Otherwise, run the approved baseline.
Analysts should review and edit generated SQL and Python, checking joins, filters, and time zones. Querio notebooks update automatically when the logic changes. Once data, definitions, and access are governed, schedule the check after each warehouse refresh.
Schedule Reports and Govern Follow-Up Questions
Send the results to the right owners, with the evidence attached. Use Querio automations to schedule a saved analysis or prompt-driven investigation after expected warehouse refreshes. Deliver one prioritized Slack or email update with notebook links, evidence level, an owner, and the next check. Keep restricted row-level data out of shared summaries, and keep restricted evidence in permissioned notebooks.
Let permitted business users ask follow-up questions using the same approved definitions and access controls. A designated analyst or data owner must approve changes to reusable context, including joins, thresholds, and metric logic. Record the reviewer, effective date, and affected reports so a one-off question cannot silently change future reports.
Conclusion: Start Small and Measure Reliability
Aim for a repeatable daily routine built from one good investigation - not a larger stream of alerts. Start with three to five material metrics and the revenue-decline diagnostic path. Before launch, validate definitions, permissions, readiness, baselines, generated code, and follow-up ownership.
Track alert quality, investigation time, confirmation rate, resolution time, and avoided ad hoc requests. Expand only when investigations are repeatable, owners close follow-up work, and ad hoc requests decline without adding noise or weakening analyst oversight.
FAQs
::: faq
How do I tune alert thresholds to reduce false positives?
Backtest candidate configurations against 6 to 12 months of historical data instead of guessing. Compare alert volume with known past incidents to check whether your team can handle the notification load.
Set minimum volume thresholds for each segment to filter out noise from small datasets. For non-urgent metrics, require deviations to last across consecutive intervals before triggering an alert. Account for holidays and product launches to avoid unnecessary alerts, and group cascading alerts into single incidents to reduce notification fatigue. :::
::: faq
What evidence would confirm an AI-suggested root cause?
Verify the finding against your governed data foundation, not just the initial alert. Review the underlying SQL or Python to confirm it uses approved definitions for metrics such as revenue or conversion.
Compare the anomaly with known business events, including promotions, releases, or pricing changes, to rule out expected fluctuations. Check whether the data is up to date and whether row counts are off. A pipeline issue can look like a business problem. :::
::: faq
How do I validate a health check before automating it?
Backtest the configuration using 6–12 months of historical data to check alert volume and whether alerts line up with known incidents. Store metric definitions in version control - for example, in dbt models - so the logic is easy to inspect.
Compare the results with trusted dashboards or approved SQL. Check how current the data is and verify row counts. Adjust volume floors and persistence windows, then review trial alerts. Assign owners for metric definitions, the review schedule, and rollback procedures. :::