Business Intelligence
AI Analytics for E-Commerce: Reconciling Shopify, Meta & GA4 Numbers
Explain revenue gaps across Shopify, Meta, and GA4 with metric ownership, warehouse reconciliation, timezone and attribution checks.

If Shopify, Meta, and GA4 show three different revenue totals for the same weekend, that is normal. I’d treat Shopify as the source for orders and revenue, Meta as the source for ad-attributed results, and GA4 as the source for sessions and site behavior. Then I’d use the warehouse to explain every gap by checking time zones, attribution windows, refunds, tax, shipping, consent loss, and missing transaction_id matches.
In plain terms: these tools do different jobs, so they answer different questions. Shopify logs what was sold. Meta gives ad credit based on its own rules, such as a 7-day click window. GA4 tracks browser events and often misses some purchases because of consent banners, ad blockers, and browser limits. In many stores, 15% to 30% of revenue may end up unattributed before modeling, and Meta match rates can vary from 40% to 85% depending on setup and device mix.
If I were checking a mismatch, I’d start here:
- Shopify = orders, net revenue, refunds
- Meta = spend, ROAS, CPA, ad-attributed conversions
- GA4 = sessions, funnels, on-site behavior
- Warehouse = blended CAC, conversion rate, contribution margin, LTV
And I’d run these checks first:
- Compare store, ad account, and GA4 property time zones
- Match GA4
transaction_idto Shopifyorder_id - Compare Shopify net sales to the purchase value sent to Meta/GA4
- Check for late refunds, duplicate transaction IDs, and referral exclusion issues for PayPal and Stripe
| Platform | Best used for | Common reason numbers differ |
|---|---|---|
| Shopify | Orders, revenue, refunds | Does not handle channel attribution well |
| Meta | Ad credit, ROAS, CPA | Counts conversions by its own window and may include modeled or view-through credit |
| GA4 | Sessions, funnels, behavior | Misses some purchases due to browser-side tracking limits |
| Warehouse | Cross-platform business metrics | Depends on clean joins and fixed metric rules |
The short version: I would not try to force these platforms to match line by line. I would give each metric one owner, calculate shared business metrics once in the warehouse, and let AI query that governed model so every mismatch has a clear SQL-backed explanation.
Why Shopify, Meta, and GA4 report different numbers
::: @figure 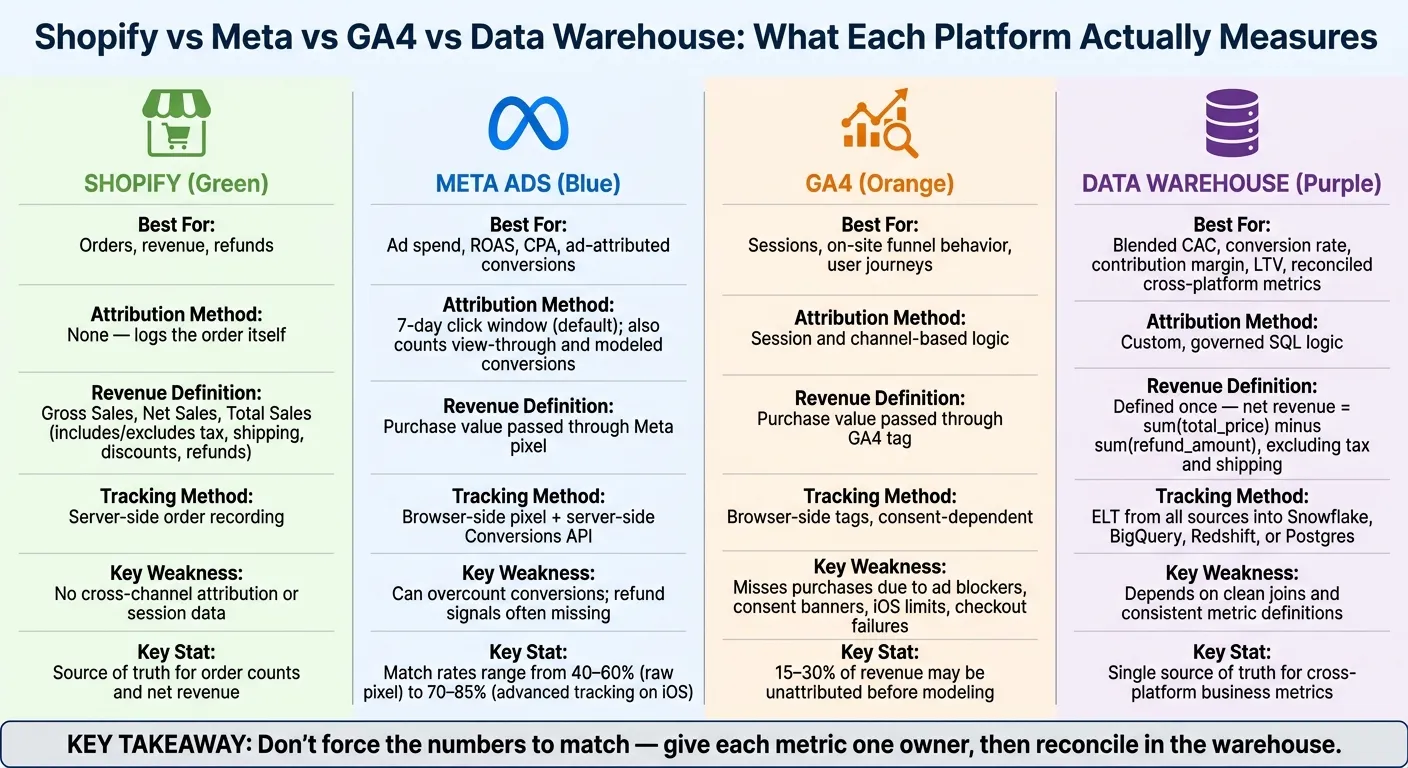 {Shopify vs Meta vs GA4 vs Warehouse: What Each Platform Actually Measures}
:::
{Shopify vs Meta vs GA4 vs Warehouse: What Each Platform Actually Measures}
:::
Shopify, Meta, and GA4 show different numbers because they’re not measuring the same thing in the same way. Each platform tracks different events, applies its own credit rules, and closes reporting on its own schedule. Some gaps are normal. Others point to tracking loss.
The goal isn’t to force the numbers to match. The goal is to explain why they differ using one clear set of rules. You’ll often spot these differences first in daily reporting: revenue gaps, Meta showing more conversions than expected, or GA4 missing purchases. Day-level reporting can drift even more because platforms use different time zones and refresh data at different speeds.
Attribution windows and credit rules produce different conversion totals
Meta and GA4 assign credit based on their own attribution settings. Shopify logs the order itself.
That difference matters. Meta might credit a purchase to an ad click that happened several days earlier under a 7-day click window. GA4 may assign that same order using its own session and channel logic. Shopify, meanwhile, simply records that the order happened.
So when totals don’t line up, it doesn’t automatically mean one platform is wrong. It usually means each one is answering a different question.
Revenue definitions shift with refunds, discounts, tax, and shipping
Revenue can change depending on what each system includes.
Shopify reports Gross Sales, Net Sales, and Total Sales, and those figures treat discounts, refunds, tax, and shipping differently. Meta and GA4 usually show the purchase value passed through the pixel or tag, which may not match Shopify’s revenue setup.
Refund timing adds another layer. If a refund is recorded days later, Shopify updates when that refund happens. Meta and GA4 often don’t get an equal signal back. Over a month with a meaningful level of returns, that can create a steady gap between platform reporting and the numbers finance uses.
Tracking loss, consent gaps, and cross-device session matching failures hide real purchases
Shopify records orders server-side. GA4 and Meta rely on browser-side tags and consent.
That makes GA4 and Meta more exposed to missed data. Blocked scripts, consent gaps, ad blockers, iOS privacy limits, and checkout confirmation failures can all reduce what those platforms can see. Meta match rates on iOS-heavy audiences are roughly 70% to 85% with advanced tracking, compared with 40% to 60% with a raw Meta pixel [1]. Across a typical e-commerce store, attribution match rates can leave 15% to 30% of revenue unassigned to any channel before modeling is applied [1].
That’s why a warehouse-level view matters. Looking at one dashboard at a time only tells part of the story.
The table below shows where each system is strong and where it starts to fall apart:
| System | Reliable for | Breaks down on |
|---|---|---|
| Shopify | Order counts, revenue, refunds | Cross-channel attribution, session data |
| Meta Ads | Ad-attributed conversions, ROAS | Cross-platform measurement, refund signals |
| GA4 | Sessions, on-site behavior, funnel analysis | Full purchase capture, financial accuracy |
| Data Warehouse | Unified, reconciled metrics across all sources | Raw campaign operations |
With those failure points mapped, the next step is to look at the mismatch patterns that tend to appear first in daily reporting.
Common mismatch patterns to check first
Start with three common causes: time zone cutoffs, attribution rules, and browser-side tracking loss. These are behind most of the day-to-day gaps teams run into. Before you label the issue a data problem, do the simple warehouse checks first.
| Mismatch Driver | First warehouse check | Likely cause |
|---|---|---|
| Time zone cutoffs | Compare store, ad account, and property time zone settings | Daily total mismatch |
| Attribution rules | Join Meta conversions against Shopify order_id by date range |
Meta overcounts orders |
| Revenue definition | Compare Shopify Net Sales against pixel-passed purchase value | Revenue gap despite matching order counts |
| Tracking gaps | Join GA4 transaction_id against Shopify order_id; flag nulls |
Underreported purchases |
Daily revenue gaps caused by timezone settings and reporting lag
When the gap shows up on just one day, check time zones before you look at performance. Shopify uses the store’s time zone. Meta uses the ad account’s time zone. GA4 uses the property-level time zone.
That means the same order can land on different calendar days across tools. A one-day mismatch can look alarming, but sometimes it’s just a cutoff issue. Compare trailing 7- or 14-day closed periods, and make sure all three time zones match before you make any call about channel efficiency.
Meta shows more conversions than Shopify has orders
If the time zones match, move to attribution rules. This is often where the story changes.
Meta can count view-through conversions, which means it may credit a purchase that happened after an impression instead of a click. It also adds modeled conversions when signals are missing. On top of that, more than one ad platform can claim the same purchase. So when you add up platform-reported conversions, the total can end up higher than actual order volume.
Use Shopify’s backend order table as the source of truth for order counts.
GA4 shows fewer purchases than Shopify
If Meta still looks high, check whether GA4 is missing purchase events. In many setups, GA4 undercounts Shopify.
Start with two warehouse checks:
- Join GA4’s
transaction_idto Shopify’sorder_idto find orders that have no matching GA4 event. - Verify that PayPal and Stripe are included in GA4’s referral exclusion list.
Then check for duplicate transaction_id values in GA4. Those duplicates can inflate event counts and hide the under-reporting problem [3].
Use warehouse joins to pin down the cause before you trust any dashboard total.
Build a reconciled source of truth in the warehouse
Stop patching dashboards. Bring raw Shopify, Meta, and GA4 data into the warehouse first, then define each core metric one time. Use an ELT loader to move data into Snowflake, BigQuery, Redshift, or Postgres. The rule here is simple: land raw data first, transform later. Keep those raw tables unchanged so every delta can be traced back to a source key.
Once the raw data is in place, assign metric ownership before you add any reconciliation logic.
Assign metric ownership by use case, not by tool UI
Ownership should follow what each platform is meant to measure.
Shopify owns order counts and net revenue. Meta owns ad spend. GA4 owns sessions and on-site funnel behavior. Any metric that crosses systems, like blended CAC or contribution margin, should belong to the warehouse. Compute it once there, then use that same definition everywhere.
| Core Metric | Source of Truth | Raw Inputs | Warehouse Logic |
|---|---|---|---|
| Net Revenue | Shopify | shopify.orders, shopify.refunds |
sum(total_price) - sum(refund_amount), excluding tax and shipping |
| Ad Spend | Meta | facebook.ads_insights |
sum(spend) grouped by campaign_id and date |
| Sessions | GA4 | ga4.events |
count(distinct session_id) where event_name = 'session_start' |
| Blended CAC | Warehouse | ad_spend_fact, orders_fact |
total_ad_spend / count(distinct new_customer_id) |
| Contribution Margin | Warehouse | orders_fact, shipping_costs, ad_spend_fact |
net_revenue - (cogs + shipping_fees + ad_spend + support_costs) |
| Conversion Rate | Warehouse | sessions_fact, orders_fact |
(total_orders / total_sessions) * 100 |
Build reconciliation tables analysts can trust
With dbt, turn raw tables into stable fact tables like orders_fact, refunds_fact, sessions_fact, and ad_spend_fact. Then create a reconciliation table that compares platform totals with warehouse totals and shows daily deltas by source.
Add dbt tests from day one. A uniqueness test on order_id catches duplicate orders. A not-null test on campaign_id flags missing campaign data. Freshness checks surface late refunds before they skew margin calculations. These tests run on their own and catch schema drift or missing events before they end up in a dashboard.
After that, lock your metric definitions in a single semantic layer so every dashboard and every AI answer pulls from the same logic.
Store business logic in a governed semantic layer
Fact tables alone won't solve the problem. If each tool recalculates CAC on its own, definitions start to drift.
Put definitions for metrics like contribution margin and CAC in the semantic layer, not inside each dashboard query. Then when the definition changes, you update it once and that change flows everywhere. That's how downstream reports stay aligned.
With the warehouse model locked, AI can investigate deltas straight from live tables instead of relying on dashboard screenshots.
Use AI analytics to investigate discrepancies and speed up reporting
Once your warehouse model and metric ownership are in place, AI can help turn mismatches into a documented, auditable answer.
A day-to-day workflow with Querio, dbt, and the warehouse
After definitions are set, the next job is figuring out how analysts dig into deltas without leaving the warehouse. With Querio connected to Snowflake, BigQuery, Redshift, or Postgres, teams can ask questions in plain English and get SQL that runs against dbt models. The agent returns a step-by-step breakdown in a notebook, using the governed definitions stored in the semantic layer.
From there, the team can trace the delta in a practical way. Did refunds arrive after Meta's attribution window closed? Did a UTM tagging gap lead GA4 to drop sessions from a certain campaign? Did a timezone mismatch shift Thursday's orders into Friday's Meta report? Each idea can live in its own cell. When the SQL changes, charts update automatically, so you don't have to run everything again from scratch each time you tweak a filter.
That notebook then becomes the record of what changed, why it changed, and how the team explained it. It's a reusable notebook that is schedulable, shareable, and auditable.
Why inspectable logic matters more than one-click answers
Fast answers don't help much if nobody can inspect the SQL, joins, and date filters behind them. If the join logic is off, or the attribution window is shifted by a day, a polished answer can do more harm than silence.
Querio surfaces every answer as real, editable SQL and Python. Your team can open any cell, review the join conditions, confirm the refund exclusion logic, and verify that the date filter matches your closed attribution window. That's what lets a data leader hand a reconciled number to finance without needing another meeting to argue over method.
The governed context layer keeps metric definitions versioned with dbt, so every answer uses approved logic. When a definition changes, it changes once, and every downstream answer updates with it automatically.
The reporting workflow teams should build around
Finance reporting should be anchored in Shopify-derived warehouse models. Meta attribution should be used as a campaign diagnostic lens, not as a revenue source. GA4 should be used for on-site funnel analysis and session behavior. And when numbers need to cross systems, like CAC or conversion rate, they should be calculated once in the warehouse and pulled from that single definition everywhere.
What makes this stick is governed self-serve: dbt models that version business logic, a semantic layer that stores canonical definitions, and an AI analytics layer like Querio that lets marketers and operators ask questions against live data without exporting a CSV or waiting on an analyst. As Trackingplan put it:
"If your current analytics workflow ends at 'someone should look into this,' you're still in the passive era." [2]
The fastest teams did three things well:
- They agreed on what the numbers meant.
- They built that agreement into the warehouse.
- They gave everyone a way to query one governed source of truth.
FAQs
::: faq
Which number should I trust most?
Trust the number you can trace back to one governed definition and a live query you can inspect in your source-of-truth warehouse.
In plain English: the number should come from shared metric logic and transparent SQL or Python that you can audit and reproduce. That’s how you keep late bookings, refunds, pixel gaps, and attribution timing differences lined up the same way across Shopify, Meta, and GA4. :::
::: faq
How do I find missing purchases in GA4?
Start by auditing your event stream to make sure tracking is set up the same way across your website and app. Then use your warehouse - such as BigQuery, Snowflake, or Redshift - to verify order completion events and look for missing user IDs.
Next, inspect raw event data for duplicates or tracking gaps that may point to pixel loss or failed webhooks. After that, compare those logs with Shopify order records to spot mismatches. :::
::: faq
What should live in the warehouse?
Store raw, durable inputs and modeled, queryable tables that define the business concepts used to reconcile systems. That means shopper events, marketing spend, and finance and accounting outcomes, loaded with as little transformation as possible.
From there, build curated fact and dimension models for sessions, users, orders, order lines, products, spend, and lifecycle states. BI and AI answers should run on these governed warehouse models through a shared semantic layer, with inspectable SQL and Python against live data. :::