A Practical Explainer: What Is the T Test Used For
Discover what is the t test used for in business with our practical guide. Explore one-sample, two-sample, and paired t-tests, plus A/B testing examples.
https://www.youtube.com/watch?v=AGh66ZPpOSQ
published
Outrank AI
what is the t test used for, t-test explained, hypothesis testing, statistical analysis, a/b testing
dd9ccf81-07dd-4d70-a1aa-d056306099f7

You've probably been in this meeting. The experiment shipped last week, the dashboard shows one version with a slightly higher average outcome, and now someone asks the question that matters: should we roll it out?
That's the moment a t-test becomes useful. Not because statistics are interesting on their own, but because teams need a disciplined way to tell the difference between a real change and ordinary fluctuation. In product work, growth work, and operational reporting, you're almost never deciding with perfect certainty. You're deciding under noise.
The t-test has been doing that job for a long time. It was first described in 1908 by William Sealy Gosset, who published under the pseudonym “Student” while working for a brewery, which is why many people still call it Student's t-test. It became especially influential because it works well with small samples, particularly when sample sizes are under 30 or so, by using the t-distribution to account for uncertainty instead of leaning on large-sample assumptions, as explained in the NCBI overview of Student's t-test.
If you want a quick refresher on the broader probability ideas underneath hypothesis testing, Maeve's AI-powered probability statistics study is a useful companion. And if you want to place the t-test in the bigger picture of decision-making with data, Querio's guide to descriptive vs inferential statistics with examples helps clarify where this test fits.
Table of Contents
Introduction Making Confident Decisions with Data
A product manager launches two landing page variants. Version B shows a slightly better average time on page. The design team likes it. Marketing wants it live. The data team hesitates.
That hesitation is healthy. A small observed difference doesn't automatically mean the change worked. User behavior bounces around from day to day, cohort to cohort, and segment to segment. Some variation is the product effect you care about. Some is just randomness.
The practical use of a t-test is simple: it helps you decide whether a difference in averages is large enough, relative to the variation in the data, to treat as evidence instead of noise. That's the core answer to the question “what is the t test used for?” It's used for decision-making when you're comparing means and need a principled way to judge whether the difference is likely meaningful.
For business teams, that often translates into questions like these:
Product experiments: Did the new onboarding flow change average completion time?
Operations: Is the average support response time different from the target you promised customers?
Customer research: Did one user group report a higher average satisfaction score than another?
Feature changes: Did average engagement for the same users shift after a release?
The t-test doesn't tell you whether a decision is valuable. It tells you whether the observed change is credible enough to discuss as a real effect.
That distinction matters. Statistical evidence is not the same as business value. A result can be statistically convincing and still not matter operationally. The reverse can also happen. The effect might matter, but your sample is too noisy to support a clear conclusion yet.
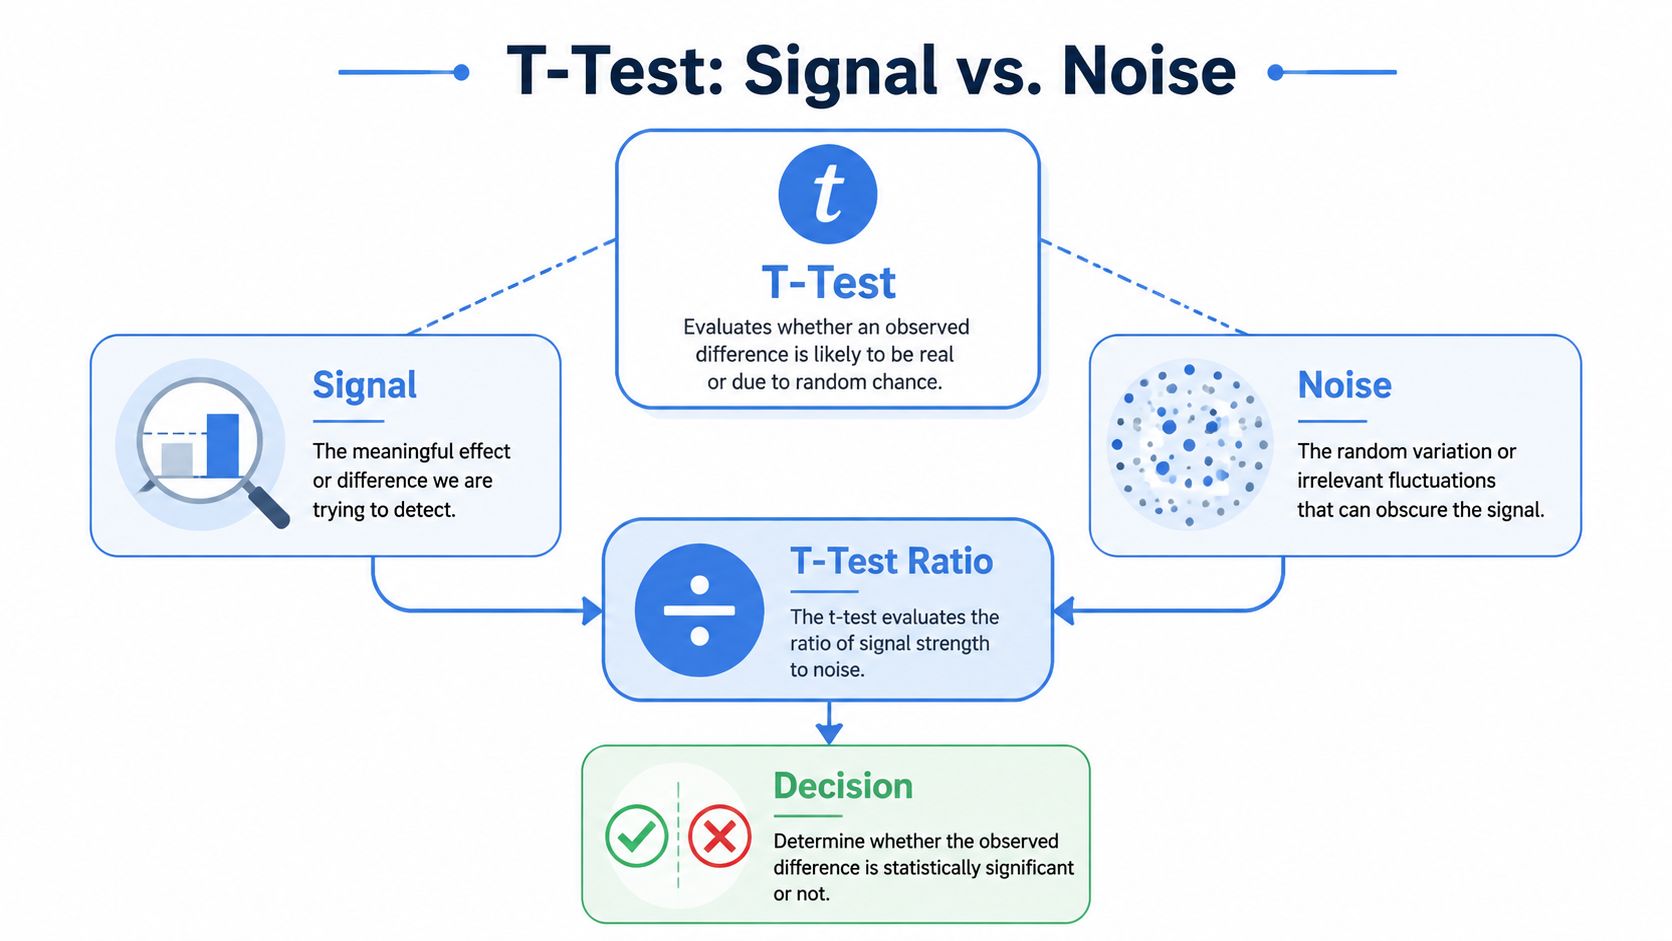
The Core Idea Behind the T-Test Signal vs Noise
Most confusion about the t-test comes from one place. People think it asks, “Are the averages different?” That's too shallow. The core question is, “Is the difference in averages big enough compared with the amount of variation in the data?”
That's a signal-versus-noise problem.
Why averages alone are not enough
Suppose two groups have different average values. If individual observations within each group are tightly clustered, that difference is easier to trust. If observations are scattered all over the place, the same raw gap is less persuasive.
That's why the t-test uses more than the means. It also uses the standard deviation, the sample size, and the resulting standard error. The standard error captures how much uncertainty there is around the estimate. When the difference between means gets larger, the t-statistic grows. When within-group noise increases, the t-statistic shrinks. The Scandiweb explanation of t-tests describes this as the test being sensitive to effect size relative to noise, not just the raw difference.
A useful analogy is audio. If someone whispers in a silent room, you can still hear them. If they say the same thing in a crowded café, you might miss it. The words are the signal. The background sound is the noise. The t-test asks whether your data signal rises clearly enough above the background variation.
For readers who want to build intuition before running formal tests, Querio's article on exploratory data analysis is a good reminder that plotting distributions and checking spread should come before hypothesis testing.
Here's a short visual explanation if you prefer hearing the intuition rather than reading it:
Why paired comparisons can be more sensitive
There's another subtle point that matters in product work. Sometimes you compare different people in two groups. Other times you compare the same people before and after a change. Those are not the same analytical problem.
When measurements are paired on the same units, a paired t-test can be more powerful because it removes a lot of unit-level noise. Instead of asking whether two messy groups differ, it asks whether each person's own before-and-after difference is consistently above or below zero. That often makes the signal clearer.
Practical rule: If each “after” observation naturally belongs to a specific “before” observation, treat the pairing as information, not as a nuisance.
Choosing the Right Tool The Three Main Types of T-Tests
People often ask for “a t-test” as if there's only one. In practice, there are three common versions, and choosing the right one depends on the structure of your question.
A fast way to choose
Use this rule of thumb:
One group vs a known target: one-sample t-test
Two separate groups: independent two-sample t-test
The same units measured twice: paired t-test
The choice isn't about preference. It's about matching the test to the data-generating process.
One-sample t-test
Use this when you have one sample and want to compare its average to a known benchmark or target.
A business example: your operations team wants to know whether the average first-response time this week differs from your internal SLA target. You have one set of observed response times and one benchmark value. That's a one-sample question.
This version is especially useful when teams have clear thresholds and need to check whether observed performance is meaningfully above or below them.
Independent two-sample t-test
This is the classic A/B testing version for two different groups. One group sees experience A. Another sees experience B. You compare their average outcomes.
Use it when the observations in one group are independent from the observations in the other. Typical examples include:
different users assigned to two landing page variants
two acquisition channels with separate user sets
treatment and control groups in an experiment
This is often what people mean when they ask what the t test is used for in experimentation. But note the word average. If your actual business question is about conversion rate or retention rate, you may need a different method, which we'll cover later.
Paired t-test
Use this when the same unit appears twice. That could be the same user before and after a feature launch, the same employee before and after training, or the same account measured under two conditions.
The key business value is that the paired design controls for stable differences between units. If one customer is always a heavy user and another is always light, pairing keeps those baseline differences from muddying the comparison.
Here's the selection guide in one place.
Test Type | Business Question | Example |
|---|---|---|
One-Sample | Is our group average different from a target? | Is average support response time different from our SLA benchmark? |
Independent Two-Sample | Do two separate groups have different averages? | Did users in Variant A and Variant B show different average time on page? |
Paired | Did the same units change after an intervention? | Did the same cohort's average engagement change after a product update? |
A few readers get stuck on whether they can keep applying t-tests as the number of groups grows. That's where discipline matters. A t-test is typically used when comparing two or fewer groups. When you have more than two groups, standard guidance points you toward ANOVA instead, rather than stacking multiple t-tests and creating a mess of conflicting conclusions.
Choosing the test is really a modeling decision. You're telling the analysis what kind of comparison the business is trying to make.
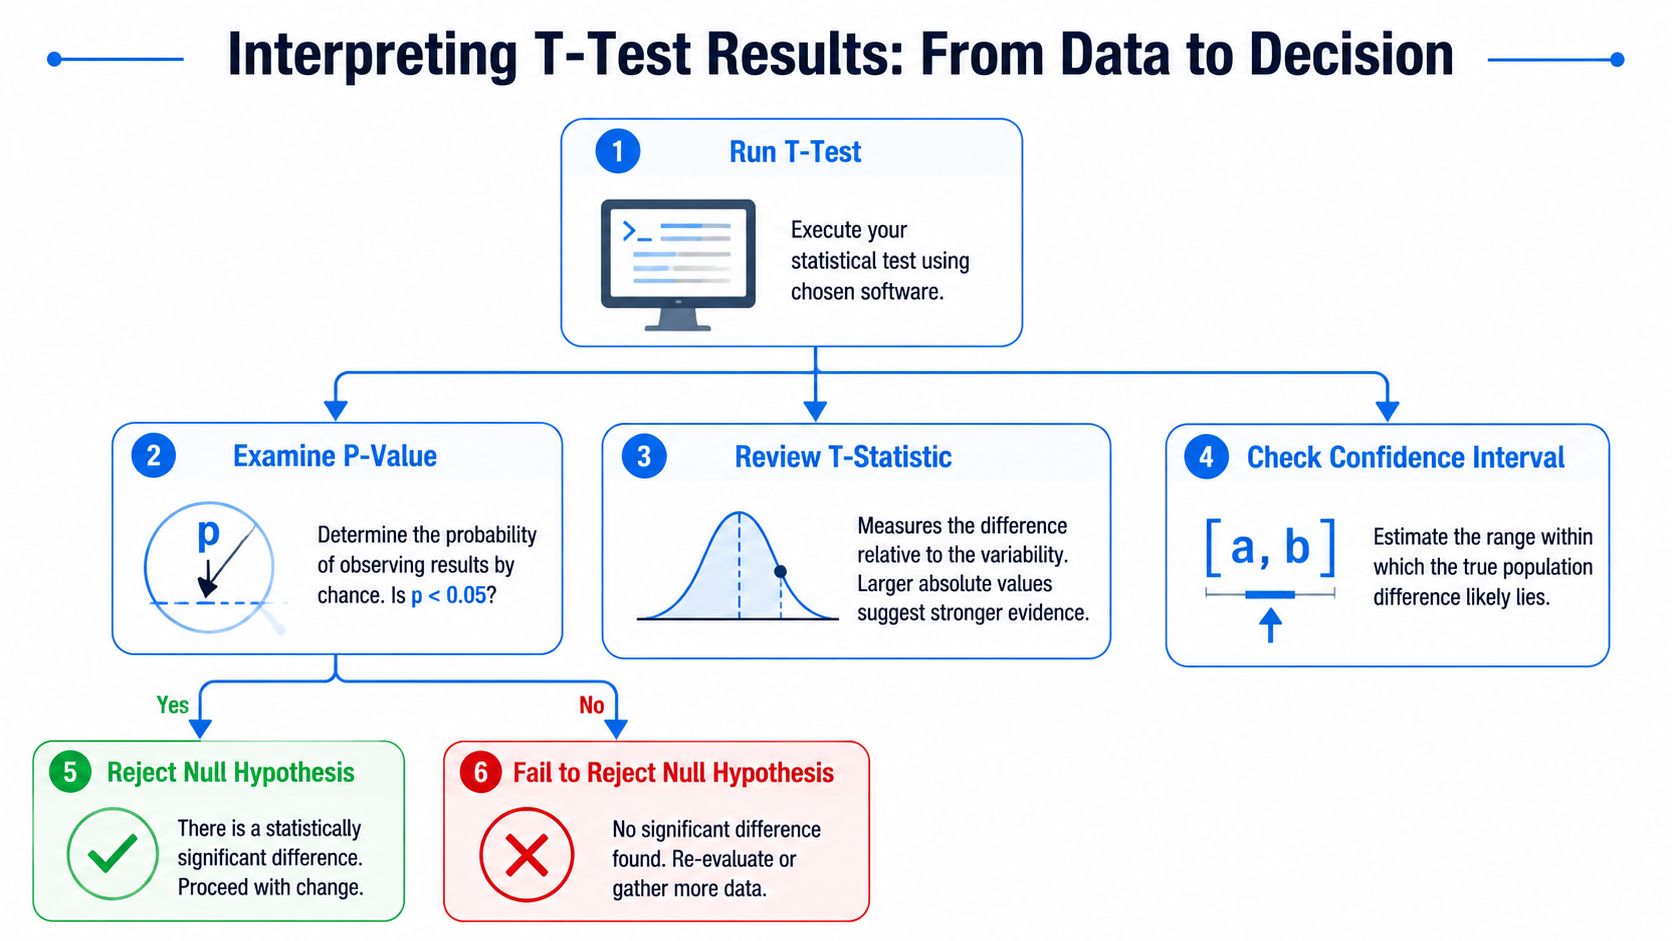
How to Interpret Your T-Test Results
Running the test is the easy part. Interpreting it without overclaiming is where good analysts separate themselves.
Start with the business question
Before you look at any output, restate the decision in plain English. For example: “Do we have enough evidence to say the new experience changed average time on page?”
That wording matters because a t-test is designed to assess whether an observed difference in means is likely due to chance. Many standard workflows use an alpha level of 0.05, which means accepting a 5% risk of concluding that two population means differ when they do not, as described in the JMP guide to t-tests.
That sounds abstract, so use a courtroom analogy. The null hypothesis is the claim that there's no real difference. The p-value tells you how surprising your observed data would be if that no-difference story were true. A small p-value means the evidence is getting hard to reconcile with the null.
How to read p-values t-statistics and intervals
Start with the p-value, but don't stop there.
If the p-value is below your alpha threshold: you have evidence against the null hypothesis.
If it isn't: you haven't shown enough evidence to reject the null.
What it doesn't mean: it doesn't tell you the probability that your feature is good, or the probability that the null is true.
The t-test also produces a t-statistic. That number comes from the group means, standard deviations, and sample sizes, and is compared with a critical value from the t-distribution to judge significance. In plain language, it summarizes how large the observed difference is relative to the uncertainty around it.
A confidence interval is often easier to explain to stakeholders. It gives a plausible range for the true difference. If that range is tightly centered around a practically meaningful improvement, the case for action is stronger. If the interval is wide and includes tiny effects, your team should be more cautious even if the p-value crosses the usual threshold.
Querio's guide on how to interpret charts and graphs is useful here because many misreads happen when teams focus on a single number and ignore the uncertainty shown around it.
A clean interpretation usually sounds like this:
State the comparison clearly. Which two averages are being compared?
Report the direction. Which group's average is higher or lower?
Summarize the evidence. Did the test provide enough evidence to reject the no-difference baseline?
Translate to action. Does the size and uncertainty of the effect justify shipping, waiting, or collecting more data?
A statistically significant result means “the signal is unlikely to be random noise.” It does not mean “the decision is automatically worth making.”
T-Tests in Action at a Modern Data Team
Theory sticks when you can see it inside everyday work. Here are three situations where a modern product or data team might use a t-test.
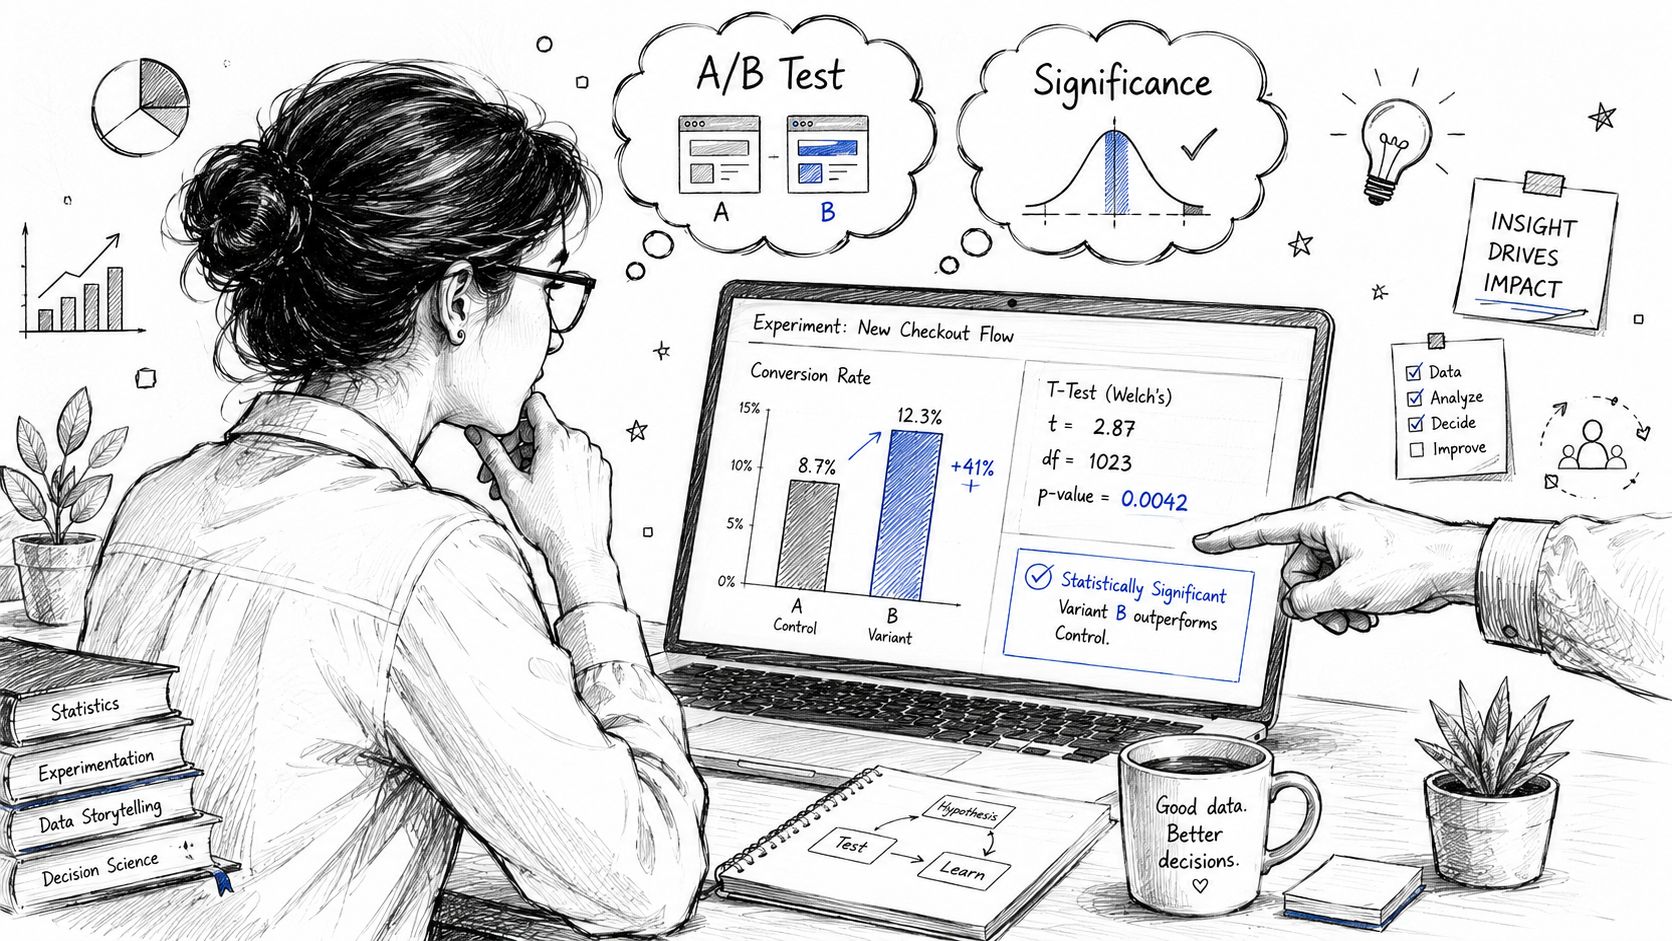
A-B test on average time on page
A growth team is testing two hero layouts on a pricing page. Their business question isn't “Which one looks better?” It's “Did one version change the average amount of time users spend engaging with the page?”
Because users are split into two separate groups, the right choice is an independent two-sample t-test. If the evidence supports a difference, the team can say the observed gap in average time on page is unlikely to be random variation alone.
Notice what this example is not asking. It is not asking whether conversion rate changed. If the KPI were conversion, the t-test would no longer be the obvious tool.
Before and after engagement for the same users
A product team ships a new workspace layout and tracks a specific cohort of users before and after the release. The question is whether their average engagement changed.
This is a paired t-test problem because each user contributes two related measurements. Instead of comparing one noisy group to another noisy group, the analysis focuses on each user's own change. That usually matches the business logic better too. Product managers care whether users improved relative to their own baseline, not whether two arbitrary aggregates differ.
One practical workflow is to inspect the paired differences first, then run the test. In tools like Python, R, or warehouse-connected notebook environments, teams often do this in the same analysis notebook so the assumptions, plots, and statistical test live together.
Checking a service target against a benchmark
An engineering or support team wants to know whether average API latency or average response time differs from an internal benchmark. They're not comparing two experimental groups. They're comparing one observed sample against one target.
That's where a one-sample t-test fits. The result helps answer a managerial question: are we operating in line with our standard, or is the observed average drifting enough that we should intervene?
This is also where self-serve analytics tooling can help. A platform like Querio lets teams ask warehouse data questions in plain language and work through SQL or Python-based analysis on live data, which is useful when the same operational question needs repeatable testing rather than one-off spreadsheet work.
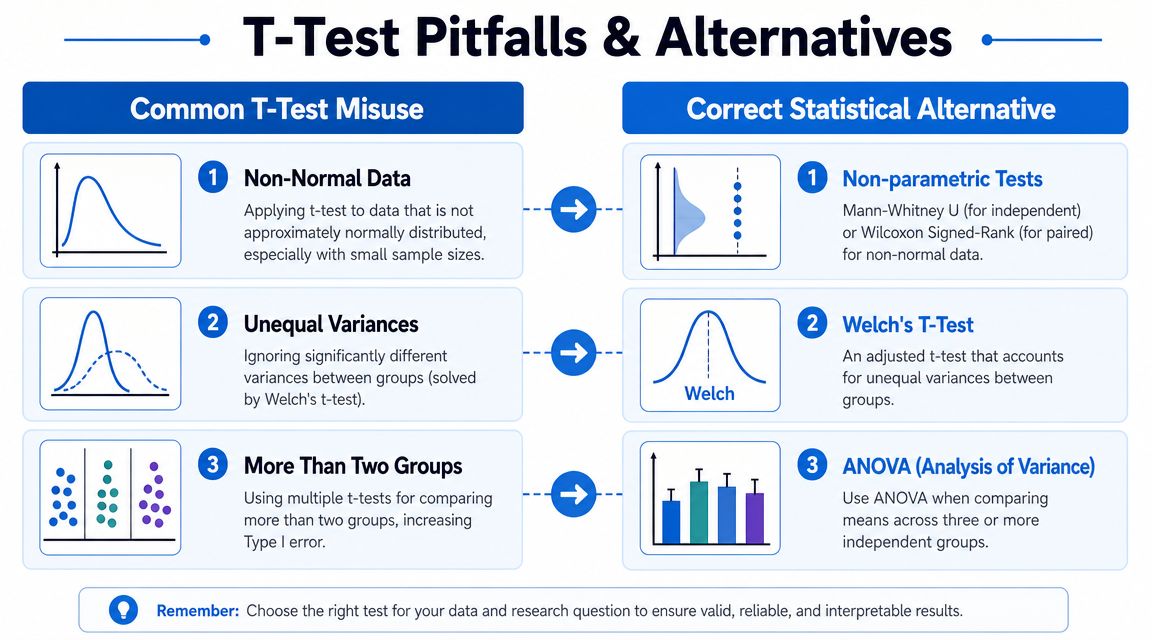
Common Pitfalls and When to Use an Alternative Test
Many otherwise smart teams frequently err. They learn one familiar test, then apply it to every metric they can find.
The biggest misuse in product analytics
The t-test compares means of numeric variables. That's its lane.
But many product decisions revolve around proportions, retention, conversion, and long-tailed revenue. Standard references note that t-tests are not the right fit for proportions, more than two groups, non-normal data, or complex designs, and the GraphPad guide on t-tests highlights how often this becomes a practical misuse in A/B testing and dashboarding.
That creates a recurring business mistake. A team asks, “Did signup conversion change?” Then someone reaches for a t-test because it's familiar. But conversion is usually a proportion question, not a mean-comparison question. If your metric is binary at the outcome level, you should choose a method designed for proportions instead.
When the business metric isn't an average, asking for a t-test is often the wrong first move.
Other situations where a t-test can mislead you
A few other warning signs should slow you down.
More than two groups: If you're comparing several variants at once, use ANOVA rather than stacking multiple t-tests.
Highly skewed data: Revenue per user, spend, or time-until-event metrics often have heavy tails. A mean-based t-test can become hard to interpret if the data shape is extreme.
Unequal variances: Some two-group comparisons call for a variant like Welch's t-test rather than the equal-variance version.
Non-normal small samples: If the sample is small and the distribution is visibly strange, non-parametric alternatives may fit better.
A useful habit is to phrase the question before naming the test:
What is the unit? User, session, account, ticket?
What is the metric type? Continuous, binary, count, or time-to-event?
How many groups are being compared?
Are the observations independent or paired?
If your team is regularly making these choices inside dashboards or ad hoc notebooks, it helps to understand adjacent methods too. Querio's explanation of multiple regression is relevant because many real business decisions involve controlling for several factors at once rather than comparing one simple mean against another.
Conclusion From Hypothesis to Insight
The t-test is one of the most practical tools in statistics because it gives teams a repeatable way to evaluate whether a difference in averages is likely to reflect a real signal rather than random variation. That's why it has lasted. Not because the formula is elegant, but because the decision problem is universal.
For product managers, founders, analysts, and data leaders, the crucial skill isn't just knowing how to run a t-test. It's knowing when the business question is a mean-comparison question, how to interpret the result without overstating it, and when to choose something else.
Teams that build that judgment move faster with less confusion. They stop arguing over noisy dashboards and start testing ideas with a shared standard for evidence.
Querio helps teams turn that standard into daily practice. If your product, data, or ops team is overloaded with ad hoc analysis requests, Querio lets users work directly on warehouse data through natural-language queries, SQL, and Python-based workflows so statistical questions can move from hypothesis to usable analysis without waiting in a queue.

