What is Diagnostic Analytics? Uncover Data's 'Why'
Learn what is diagnostic analytics. Go beyond surface data to uncover the 'why' behind metrics and drive real growth with advanced techniques.
https://www.youtube.com/watch?v=VZphRJjHW0k
published
Outrank AI
diagnostic analytics, root cause analysis, data analytics, business intelligence, data-driven decisions
ee8aab5b-d205-4708-9373-74892e46e983

At its core, diagnostic analytics is the practice of figuring out why something happened in your data. While descriptive analytics tells you what happened—like a sudden drop in sales—diagnostic analytics plays detective, digging through historical data to uncover the root cause.
From What Happened to Why It Happened
Think of it this way: your weekly report shows a spike in user sign-ups. That’s the "what," and it's great news. But the most valuable question you can ask next is, "Why?" Was it the new marketing campaign? A feature that went viral on social media? A competitor’s service outage?
Answering that "why" is the entire point of diagnostic analytics. It’s the crucial bridge between seeing a number on a dashboard and truly understanding the story behind it.
Shifting From Reporting to Investigating
Without this investigative step, teams get stuck in a reactive cycle of just reporting on metrics. They see a change, pull a surface-level report, and are left to guess at the cause. This guesswork often leads to flawed strategies and missed opportunities.
Adopting a diagnostic approach allows you to move past simple reporting and tackle the tough questions with confidence:
Why did our user engagement suddenly drop last Tuesday?
Why did Q3 sales spike in the Southeast region but not elsewhere?
What caused the 15% increase in customer churn last month?
Diagnostic analytics transforms your data from a simple rearview mirror into a detailed accident report. It doesn't just show you the past; it explains it, enabling you to prevent future problems and capitalize on hidden opportunities.
Placing Diagnostic Analytics in Context
To really get a handle on its value, you need to see where diagnostic analytics fits into the bigger picture. Data analytics is best understood as a four-step journey, with each step building on the last to answer a more complex question.
We cover the first step in our guide to what is descriptive analytics, but this progression is key to understanding the entire field.
This map visualizes how the four types work together, moving from simply understanding the past to actively shaping the future.
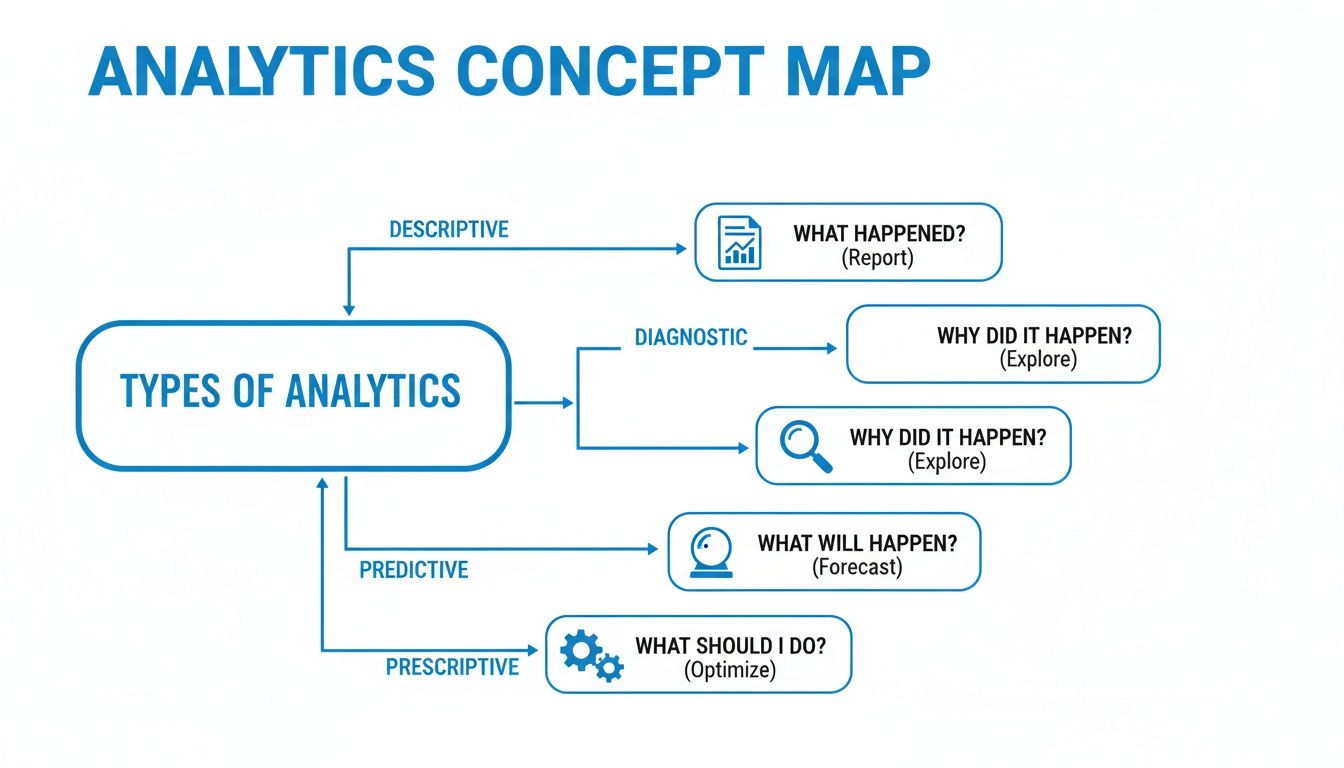
As you can see, diagnostic analytics is the critical second stage. It’s the magnifying glass that helps you connect the dots between what happened and what you should do next.
The Four Types of Data Analytics at a Glance
Here’s a quick breakdown of the four types of analytics to see how they compare. Each one answers a different fundamental question for the business.
Analytics Type | Core Question | Purpose | Business Example |
|---|---|---|---|
Descriptive | What happened? | To summarize historical data into understandable reports. | A dashboard shows that website traffic decreased by 20% in May. |
Diagnostic | Why did it happen? | To find the root causes and factors behind a past event. | Analysis reveals the traffic drop coincided with a Google algorithm update. |
Predictive | What will happen? | To forecast future outcomes based on historical patterns. | Models predict a continued traffic decline if no SEO changes are made. |
Prescriptive | What should we do? | To recommend specific actions to achieve desired outcomes. | The system suggests updating specific pages to recover lost rankings. |
Together, these four types create a powerful framework for making smarter, data-informed decisions instead of just reacting to events.
Moving from Reporting Metrics to Understanding Them

If you're on a data team, you've probably felt it: the constant pull to be a human API for the rest of the company. You're stuck in a reactive loop, fielding an endless stream of "what happened" questions and pulling one-off reports.
This cycle is a trap. It keeps you from doing your most valuable work—the deep, investigative analysis that actually moves the needle. Instead of finding strategic insights, your days are consumed by ad-hoc requests, creating a bottleneck that slows down decision-making for everyone.
This is where knowing what is diagnostic analytics becomes so important. It’s the key to breaking that cycle and shifting from simply tracking metrics to truly understanding what drives them.
From Human API to Strategic Partner
When you move past basic reporting, you stop just observing changes and start digging into why they happened. For instance, instead of just flagging a 10% drop in monthly sales, a diagnostic approach pushes you to find the root cause. Was it a competitor's new promotion? A bug in the checkout process? Or just a predictable seasonal dip?
Answering that question fundamentally changes the data team's role. You go from being a service desk that spits out numbers to a strategic partner that provides clarity. That shift empowers the whole organization to make smarter decisions, faster.
By focusing on the 'why,' you move from a state of data reaction to one of data-driven action. This is where diagnostic analytics provides its greatest value—turning raw information into a clear path forward.
Uncovering Problems and Opportunities
This kind of investigation isn't just about damage control; it's also a powerful way to spot hidden opportunities. Let's say your team notices a surprising spike in the adoption of a new feature. A simple report would just state the fact, but a diagnostic dive would tell you why it's happening.
Maybe you discover the spike was triggered by:
An influential blogger who wrote a glowing post about the feature.
A specific customer segment that found a brilliant, unexpected use for it.
A new integration that suddenly made the feature much more powerful.
Once you know the root cause, you can capitalize on it. You can build relationships with more bloggers, target similar customer segments, or explore more integrations. The insights you gain are immediately actionable.
The Limits of Surface-Level Views
Relying only on high-level dashboards is like trying to diagnose a car engine by only looking at the speedometer. You can see how fast you're going, but you have no idea what's happening under the hood.
This lack of visibility makes it nearly impossible to solve performance issues at their source. For leaders who are serious about understanding why performance is low, a glance at top-level metrics just won't cut it—it’s like grading only a tiny fraction of support calls and expecting to understand overall quality. Diagnostic analytics gives you the tools and the mindset to pop the hood, look inside, and see how all the pieces connect.
Core Techniques for Finding the Root Cause
Knowing that a metric changed is one thing, but uncovering why it changed is a completely different ballgame. This is where diagnostic analytics truly shines, turning your raw data from a simple report into a detailed investigative file. These methods are what empower you to dig past surface-level numbers and start connecting the dots.
Let’s say your SaaS company sees a sudden dip in user retention right after shipping a new feature. A descriptive report just tells you the numbers dropped. A diagnostic approach, on the other hand, gives you the tools to find the real culprit.
Root Cause Analysis: The Five Whys
One of the most effective and straightforward methods is Root Cause Analysis (RCA). My favorite framework for this is the “Five Whys,” a simple but powerful technique where you just keep asking "why" until you get past the symptoms and land on the core issue.
Let's apply it to our SaaS company's retention problem:
Why did our retention drop? New users are churning within their first week.
Why are they churning so fast? User feedback is full of complaints about a frustrating onboarding experience.
Why is the onboarding frustrating? They keep mentioning they get "stuck" at one particular step.
Why are they getting stuck? The tutorial for the new feature won't load on their phones.
Why isn't it loading? Ah, a bug in the last release breaks the tutorial script specifically on iOS.
Boom. In just five simple questions, the team went from a vague problem ("low retention") to an actionable root cause (an iOS bug). This is the essence of diagnostic work.
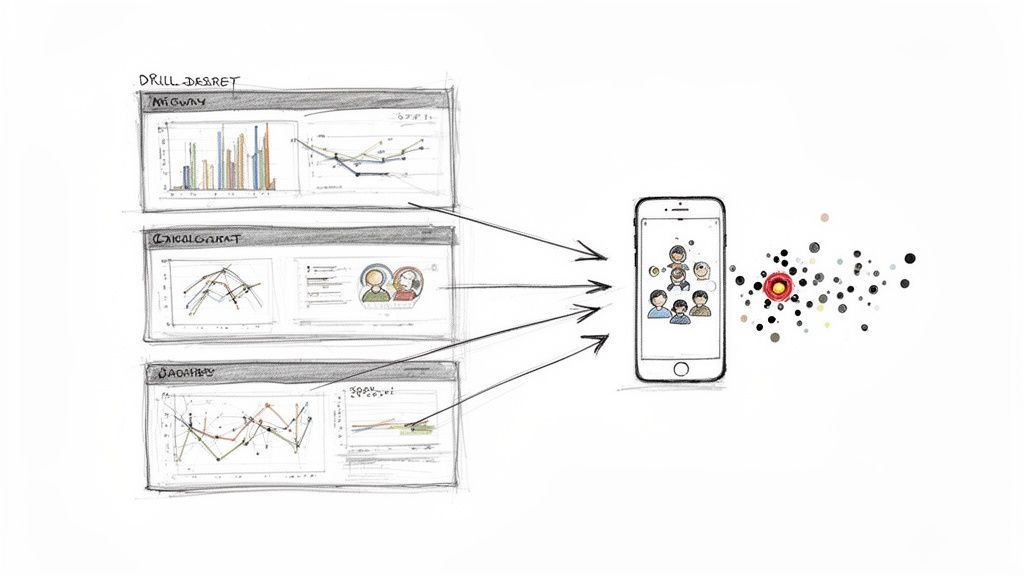
Drilling Down into Your Data
Another must-have technique is the drill-down. I like to think of data as a set of Russian nesting dolls. You start with the biggest doll—a top-line KPI like “Monthly Active Users” (MAU)—and then you open it up to find the smaller, more detailed dolls inside.
Imagine a product manager sees that MAU has gone flat. Instead of guessing, they start drilling down:
Drill-Down 1: By Region. They see MAU is actually growing in North America but has fallen in Europe. Interesting.
Drill-Down 2: By Device. Looking closer at the European data, they find the drop is happening only on Android devices.
Drill-Down 3: By User Cohort. Digging even deeper, the drop is concentrated among users who signed up in the last 30 days.
This process quickly narrows the problem from "something is wrong" to "something is wrong with the Android experience for new European users." A related move, drill-through, lets you click on a summary number and jump directly to the raw, row-level data behind it, showing you the actual user records. Both are fundamental for turning broad observations into specific evidence. To get a handle on the broader data landscape before you start drilling, check out our guide on exploratory data analysis.
A key hallmark of diagnostic analytics is its ability to drill down into data patterns, providing the 'why' insights that fuel strategic decisions. The broader data analytics market, heavily influenced by these diagnostic components, is projected to grow from USD 104.39 billion in 2026 to a massive USD 495.87 billion by 2034. For leaders seeking to understand the 'why' behind performance dips, a guide on high-impact evaluation and feedback can be crucial in moving from simply reporting metrics to understanding them.
Finding Hidden Patterns and Outliers
Finally, two more advanced techniques help you spot connections you might have otherwise missed: correlation analysis and anomaly detection.
Correlation analysis is all about finding relationships between different variables. For instance, you might ask: does a spike in customer support tickets correlate with a drop in our Net Promoter Score (NPS)? If you find a strong link, you know you've found a thread worth pulling.
Anomaly detection, which often uses machine learning, automatically flags data points that don't fit the expected pattern. This could be a sudden, weird spike in server errors or a dip in sign-ups on what should have been a busy Tuesday. These outliers are often the first sign that something is amiss, making them an excellent starting point for a deeper diagnostic investigation.
Real-World Examples of Diagnostic Analytics
The theory behind diagnostic analytics is interesting, but seeing it in action is where things really click. Knowing what is diagnostic analytics is one thing; watching it solve a million-dollar problem is something else entirely. These stories show how a good investigation can turn a vague, costly issue into a clear, solvable one.
Let's walk through a few scenarios where a team spotted a problem (the "what"), dug in to find out why it was happening, and used that diagnosis to implement a targeted fix.
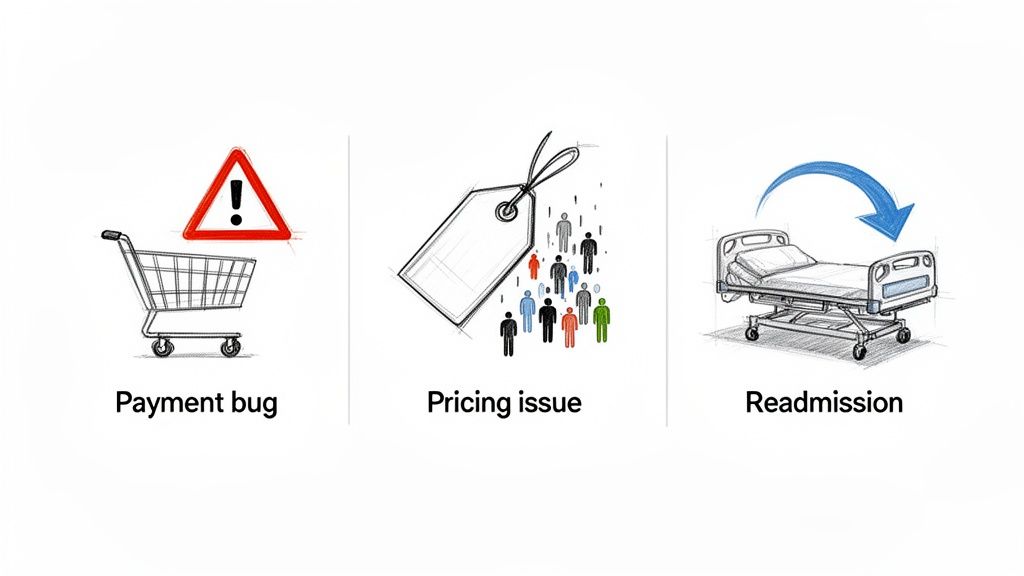
The E-commerce Conversion Rate Mystery
Imagine you run an online fashion store. You check your weekly dashboard, and your stomach drops: the checkout conversion rate has plummeted by 20%. That’s not just a number on a screen; it's thousands of dollars in lost sales, every single day. Descriptive analytics raised the alarm, but now your team has to play detective to figure out why.
Their diagnostic investigation kicks off with a series of drill-downs:
Segmentation by Time: The nosedive started abruptly on Tuesday morning.
Segmentation by Device: No clues here. Both mobile and desktop sales were hit.
Segmentation by Browser: Bingo. The conversion rate for Chrome users was perfectly fine, but for Safari and Firefox users, it had fallen to nearly zero.
Armed with this critical piece of information, the engineering team knew exactly where to look. They quickly found the culprit: a recent update to a third-party payment gateway had a bug that only affected Safari and Firefox, breaking the payment form. The problem had nothing to do with their products, marketing, or site design—it was a tiny but devastating technical glitch.
By diagnosing the issue down to the browser level, the team didn't waste a second on broad, ineffective "fixes" like overhauling the homepage or tweaking ad spend. They simply rolled back the buggy update, and the conversion rate shot right back to normal.
The SaaS Startup's Sudden Churn Spike
Over at a fast-growing SaaS startup, panic set in when the monthly churn rate—a key metric for any subscription business—jumped from a stable 4% to over 15%. This kind of spike is an existential threat. Knowing the "what" (churn is up) was useless; they needed the "why," and they needed it fast.
The product team launched a diagnostic deep dive, correlating the churn data with user behavior and account details.
Diagnostic analytics moves beyond simple reporting to uncover the root causes behind business phenomena. By connecting disparate data points, it provides the "why" that is essential for effective problem-solving and strategic decision-making.
Using cohort analysis, they found the spike was concentrated in one specific group: customers who had been on their "Pro" plan for more than a year. Why were these long-term, loyal users suddenly canceling? The team then cross-referenced the churn dates with company announcements and found the trigger: a recent pricing update.
It turned out that a poorly worded email sent to existing customers made it sound like their rates were about to double. While the new pricing was meant for new sign-ups, the miscommunication sent loyal users into a panic, leading directly to a wave of cancellations. The root cause wasn't the product; it was a simple communication blunder. With this diagnosis in hand, the company immediately launched a clarification campaign, grandfathered in the rates for their loyal users, and stopped the bleeding.
The Healthcare Readmission Puzzle
Diagnostic analytics isn't just for tech companies, either. Consider a large hospital system trying to figure out why certain patient groups had much higher readmission rates, even for the same medical procedures. During the COVID-19 pandemic, for instance, diagnostic analysis helped hospitals understand why some regions saw 25-30% higher readmission rates. They traced it to a mix of socioeconomic factors and supply chain disruptions, allowing for targeted interventions that ultimately cut costs. To dig deeper into this, you can read the full research on healthcare industry trends.
By analyzing patient records, demographic data, and post-discharge notes, the hospital's data team spotted a strong correlation. Patients from low-income areas with limited access to transportation were far more likely to be readmitted. They were missing crucial follow-up appointments and weren't picking up their prescriptions—not because they didn't care, but because they physically couldn't get there.
The diagnosis was clear: the problem wasn't medical, it was logistical. In response, the hospital partnered with local transport services to offer free rides to appointments. The result? Readmission rates dropped dramatically, and patient outcomes improved.
How Modern Tools Accelerate Your Diagnostic Workflow
If you've been in the business world for a while, you probably know the drill. The marketing team spots a weird drop in leads, a product manager sees engagement dip, and the first thing they do is file a ticket. That ticket lands in a long queue for an already swamped data team.
This old way of working effectively turns your data experts into a "human API." They spend their days fielding requests and pulling reports instead of digging for the strategic gold they were hired to find. It’s a frustrating bottleneck for everyone. Business teams wait days, sometimes weeks, for answers, while the data team is stuck in a reactive loop, unable to get ahead.
But things are finally changing. A new generation of analytics platforms is designed to break this cycle by putting the power of diagnostics directly into the hands of the people asking the questions.
The Shift to Self-Serve Analytics
The real game-changer is empowering your product managers, marketers, and execs to find their own answers. Imagine a product manager notices that user signups from a recent campaign are lower than expected. Instead of opening a ticket and waiting, they can just ask a simple question in plain English, like, "Why did signups from our latest campaign underperform?"
Tools like Querio are built for this. They plug right into your data warehouse and use AI to translate that simple question into a complex query, running the analysis and delivering the answer in seconds. The platform doesn't just give you a number; it serves up a detailed breakdown, showing you the key drivers behind what happened. That immediate feedback loop is what makes all the difference.
This move toward self-service isn't just about making life easier. It delivers serious returns, with some studies showing it can boost analytics ROI by as much as 40%. In specialized fields like healthcare, where the analytics market is projected to hit USD 55.99 billion by 2026, secure, warehouse-native tools are quickly becoming the industry standard. You can discover more insights about the healthcare analytics market to see how this trend is playing out.
Features That Empower Investigation
This isn't just about asking a single question. The best tools give you an entire toolkit for investigation, with features built specifically to make the diagnostic workflow faster and more intuitive.
Take a look at how Querio's interface lets you ask questions and get instant, visual answers without writing a single line of code.
As you can see, a straightforward question instantly generates a chart. This is the starting point, allowing anyone to spot a trend and begin their diagnostic journey immediately.
Here are some of the key features that make this possible:
Natural Language Querying: Lets non-technical folks ask questions in plain English, completely removing the SQL barrier.
Intuitive Drill-Ins: Allows you to click on any part of a chart or a metric and instantly break it down by region, device, user cohort, or any other dimension. This helps you quickly pinpoint the source of an issue.
Collaborative Boards: These are shared canvases where teams can build and discuss their findings. A product manager can uncover an insight, share it on a board, and loop in an engineer with all the context in one place.
Custom Python Notebooks: For the really deep, complex questions, data pros can still access a full coding environment to run advanced analysis, all while keeping their work connected to the same collaborative platform.
Modern analytics tools don't just create dashboards; they create environments for curiosity. They are designed to make the next question easier to ask than the last, fostering a true self-serve data culture.
By blending the accessibility of natural language with deep analytical capabilities, these platforms completely change the data team's role. They’re no longer a service desk. Instead, they become strategic partners who build and maintain the self-serve infrastructure that empowers the entire organization. To get a better sense of how to build these visual tools, check out our guide on data visualization and dashboards.
This is the speed and agility businesses need today—the ability to find answers and act on them before the opportunity is gone.
Building a Diagnostic Analytics Strategy for Your Team
Putting diagnostic analytics into practice is about much more than just adopting a new piece of software. It’s a fundamental shift in how your team approaches data—moving from simply reporting what happened to truly investigating why it happened. To make that shift stick, you need a clear, actionable roadmap that helps everyone consistently turn observations into game-changing business insights.
This journey doesn't start with spreadsheets or dashboards. It starts with asking the right questions. Before you even think about diving into the data, your team needs to agree on what critical business questions you're trying to answer. Which metrics are your north stars, and what kind of change in those numbers would be a big enough deal to launch an investigation?
Getting Your House in Order First
Once you know what to ask, you need to be sure you have what it takes to find the answers. Think of it like a detective heading to a crime scene; you can't solve the case without the right tools and organized evidence. This boils down to two key steps.
Ensure Data Readiness: Your analysis is only as good as the data you're working with. If your data is messy, siloed, or hard to access, you've already lost. Getting this right is the biggest hurdle for most teams, but it's non-negotiable. You can find some practical advice in our guide on how to improve data quality.
Choose the Right Tools: The best tools are ones that encourage self-service and collaboration. They should empower the people with the business questions—your product managers, marketers, and founders—to explore data themselves without needing to write a line of code. This breaks down the bottleneck that traditionally exists between business users and data analysts.
The most powerful strategy isn't about having the most data; it's about creating the straightest path from a business question to a data-backed answer. Success depends on making investigation easy and rewarding for everyone involved.
Fostering a Culture of Curiosity
A great strategy is worthless if your company culture doesn't support it. You have to actively foster a culture of curiosity where asking "why?" is not only accepted but expected. When a metric suddenly drops, the team's first reaction shouldn't be to assign blame; it should be to rally together and start digging.
Leaders are the key to making this happen. They need to lead by example, celebrating the "aha!" moments discovered through analysis and demonstrating that real insights—not just gut feelings—are what drive the most important decisions. This gives your team the psychological safety to explore, ask questions, and even be wrong sometimes.
Turning Insights into Action
Finally, the most important part of your strategy is closing the loop between analysis and action. The whole point of diagnostic analytics isn't just to generate interesting charts, but to drive real business outcomes. This requires a formal process for putting those hard-won insights to work.
Start with a Pilot Project: Don't try to boil the ocean. Pick one specific, high-impact problem to tackle first, like a sudden drop in user retention or a dip in trial conversion rates. This lets you test and refine your process on a manageable scale.
Establish a Clear Feedback Loop: Set up a system for sharing findings. This could be a dedicated Slack channel for insights, a weekly "data deep-dive" meeting, or a set of collaborative dashboards where everyone can see the latest discoveries.
Assign Ownership for Action: An insight without an owner is just trivia. Once a root cause is identified, someone needs to be accountable for implementing the fix or the new experiment. Make sure every investigation ends with a clear owner and a documented set of next steps.
By methodically building this framework, you can embed diagnostic analytics deep into your team's DNA. It’s how you transform from a team that just reports the news to one that actively shapes it.
Frequently Asked Questions About Diagnostic Analytics
As teams start to work with diagnostic analytics, a few key questions almost always surface. Let's clear those up so you have a solid foundation to build on.
What Is the Main Difference Between Diagnostic and Descriptive Analytics?
Think of it this way: Descriptive analytics gives you the headline, while diagnostic analytics writes the full story.
A descriptive report might show that sales dropped by 15% last month. That's the "what." Diagnostic analytics is the investigation that follows, aiming to uncover the "why." It's how you’d discover that the drop wasn't random—it was driven by a new competitor running a promotion that specifically targeted your core customer base.
How Does AI Help with Diagnostic Analytics?
AI is like having a whole team of data detectives working for you 24/7. Instead of a person manually poring over endless spreadsheets to connect the dots, an AI-powered system can test hundreds of potential causes at once and flag the most likely culprits in seconds.
This completely changes the pace of investigation. Teams can go from spotting a problem to understanding its cause in minutes, not days. That speed allows you to be far more agile and make smarter decisions, faster.
This becomes even more powerful with tools that use natural language, like Querio. You can simply ask questions like, "Why did user sign-ups dip last week?" and the AI does the heavy lifting to find the answer.
Can Non-Technical Teams Perform Diagnostic Analytics?
Yes, and this is a huge shift from how things used to be. In the past, you needed a data specialist to run these kinds of investigations. Now, modern self-serve analytics platforms put that power into the hands of the people who need the answers most—product managers, marketers, and business leaders.
Intuitive tools with guided drill-downs and simple English queries handle all the technical work behind the scenes. This opens the door for anyone to dig into the data and find the "why" behind the numbers, all without writing a single line of code. It helps build a culture where everyone feels comfortable asking questions and finding their own answers.
Ready to empower your entire team to find the "why" in your data? See how Querio's AI-powered platform makes diagnostic analytics fast, easy, and accessible for everyone. Explore Querio's self-serve analytics today.

