Scatter Plot in Tableau: A Practical Guide (2026)
Learn how to create and interpret a powerful scatter plot in Tableau. This practical guide covers data prep, advanced tips like clustering, and common fixes.
https://www.youtube.com/watch?v=lCKZinAH6bc
published
Outrank AI
scatter plot in tableau, tableau tutorial, data visualization, business intelligence, data analysis
94b76e56-e80a-4c92-a17b-1f14a374f439

You have a spreadsheet open with two columns that should be related. Maybe it's sales and profit, acquisition spend and retention, or feature usage and conversion. You know there's a story in the data, but the table won't show it. A bar chart won't help much either. It compares categories well, but it won't tell you whether two measures move together, split into segments, or hide a handful of points that deserve immediate attention.
That's where a scatter plot in Tableau earns its place. It turns a pair of measures into something you can reason about quickly. Instead of asking only what happened, you can start asking better questions. Which customers behave differently from the rest? Which products sell well but destroy margin? Which region breaks the pattern?
For product managers, founders, and analysts, that shift matters. A good scatter plot doesn't just display data. It helps you choose a hypothesis worth testing next.
Table of Contents
Why Scatter Plots Are Your Secret Weapon for Data Discovery
A scatter plot works best when the question is relational. Not “how much did we sell,” but “when sales increase, what happens to profit?” Not “which feature is popular,” but “does usage of this feature correspond to renewal behavior?”
In Tableau, that workflow is intentionally simple. Scatter plots are automatically generated when you place one measure on Columns and another on Rows, because Tableau's VizQL engine translates those drag and drop actions into queries that render the view quickly. Tableau's own example shows that plotting Sales against Profit in the Sample Superstore data reveals a ~0.47 Pearson correlation coefficient across nearly 10,000 data points in real time, which is why the chart is so useful for rapid exploration in practice (Tableau scatter plot examples).
That matters because early analysis usually fails in one of two ways. Teams either stay in tables too long, or they jump to polished dashboards too early. A scatter plot sits in the middle. It's rough enough for discovery and structured enough to support a serious decision.
What bar charts usually miss
Bar charts answer category comparison questions well. Scatter plots answer relationship questions. That difference is practical:
Correlation: Do two measures move in the same direction, opposite directions, or not at all?
Clusters: Do natural groups appear without you forcing predefined segments?
Outliers: Which points break the expected pattern and deserve investigation?
Trade-offs: Where does growth come with margin loss, or engagement come without retention?
A useful scatter plot doesn't impress stakeholders with complexity. It reduces the number of wrong explanations you carry into the next meeting.
This is why analysts keep coming back to them. When you're unsure what's driving a business outcome, a scatter plot often gives you the first honest answer.
From Data to Dots Creating Your First Scatter Plot
The easiest way to build a bad scatter plot in Tableau is to start dragging fields before deciding what each axis means. The chart is simple. The thinking behind it isn't.
Start with the business question
Use the Sample Superstore dataset if you want a familiar practice case. A sensible first question is: Does higher sales value lead to higher profit? If that's your question, Sales is the likely driver and Profit is the outcome.
Put Sales on Columns and Profit on Rows.
That placement isn't cosmetic. It protects your interpretation. A documented Tableau pitfall is axis confusion. The x-axis should represent the independent variable and the y-axis should represent the dependent variable. Approximately 35% of scatter plot misinterpretations in business settings stem from this axis role confusion, which leads teams to infer the wrong causal direction (Concord on building a scatter plot in Tableau).
If you're new to the view-building mechanics, this short walkthrough on how to create a scatter plot is a good companion. The bigger point is that the chart should reflect the question, not just the available fields.
Build the view and control the level of detail
Once you place both measures, Tableau generates the axes. However, the fundamental decision is what an individual dot represents.
If you stop after adding two measures, Tableau may aggregate the data more than you want. That's not wrong. It's just answering a different question. An aggregated view might tell you about category or region level relationships. A disaggregated view tells you about orders, users, or accounts.
Use the Marks card to define the level of detail:
Start with two measures on Columns and Rows. This creates the coordinate system.
Choose a dimension that should define one mark. In Superstore, Order ID or Customer Name can work depending on the question.
Drag that dimension to Detail so Tableau draws separate points at that granularity.
Check the result before styling it. If you color too early, you can hide a modeling mistake behind an attractive chart.
A practical habit helps here. Ask one blunt question before touching color or size: what exactly does one dot mean?
Practical rule: If you can't explain what a single mark represents in one sentence, the chart isn't ready for interpretation.
Once the base view is stable, you can refine it. Region on Color is usually a better first enhancement than adding both Region and Category and Segment at the same time. Keep the chart readable before you make it expressive.
Later, when you want a visual walkthrough of the Tableau interface, this video is useful:
A first-pass checklist that actually works
Before moving on, verify these points:
Axes match the question: Driver on x, outcome on y.
Each point has a clear meaning: Order, customer, account, or another defined unit.
Aggregation is intentional: You chose the level of detail instead of accepting Tableau's default blindly.
Encodings are minimal: One extra dimension is enough for the first read.
That's the difference between a chart you built and a chart you can defend.
How to Read the Story Your Scatter Plot Is Telling
Many teams do not struggle to create a scatter plot in Tableau. They struggle to read it without forcing a conclusion too early.
The first pass should be visual, not narrative. Resist the urge to explain every point. Start by asking what kind of structure exists in the cloud of dots.
Look for structure before you look for labels
A scatter plot usually tells one of four broad stories. The shape comes first. The business meaning comes second.
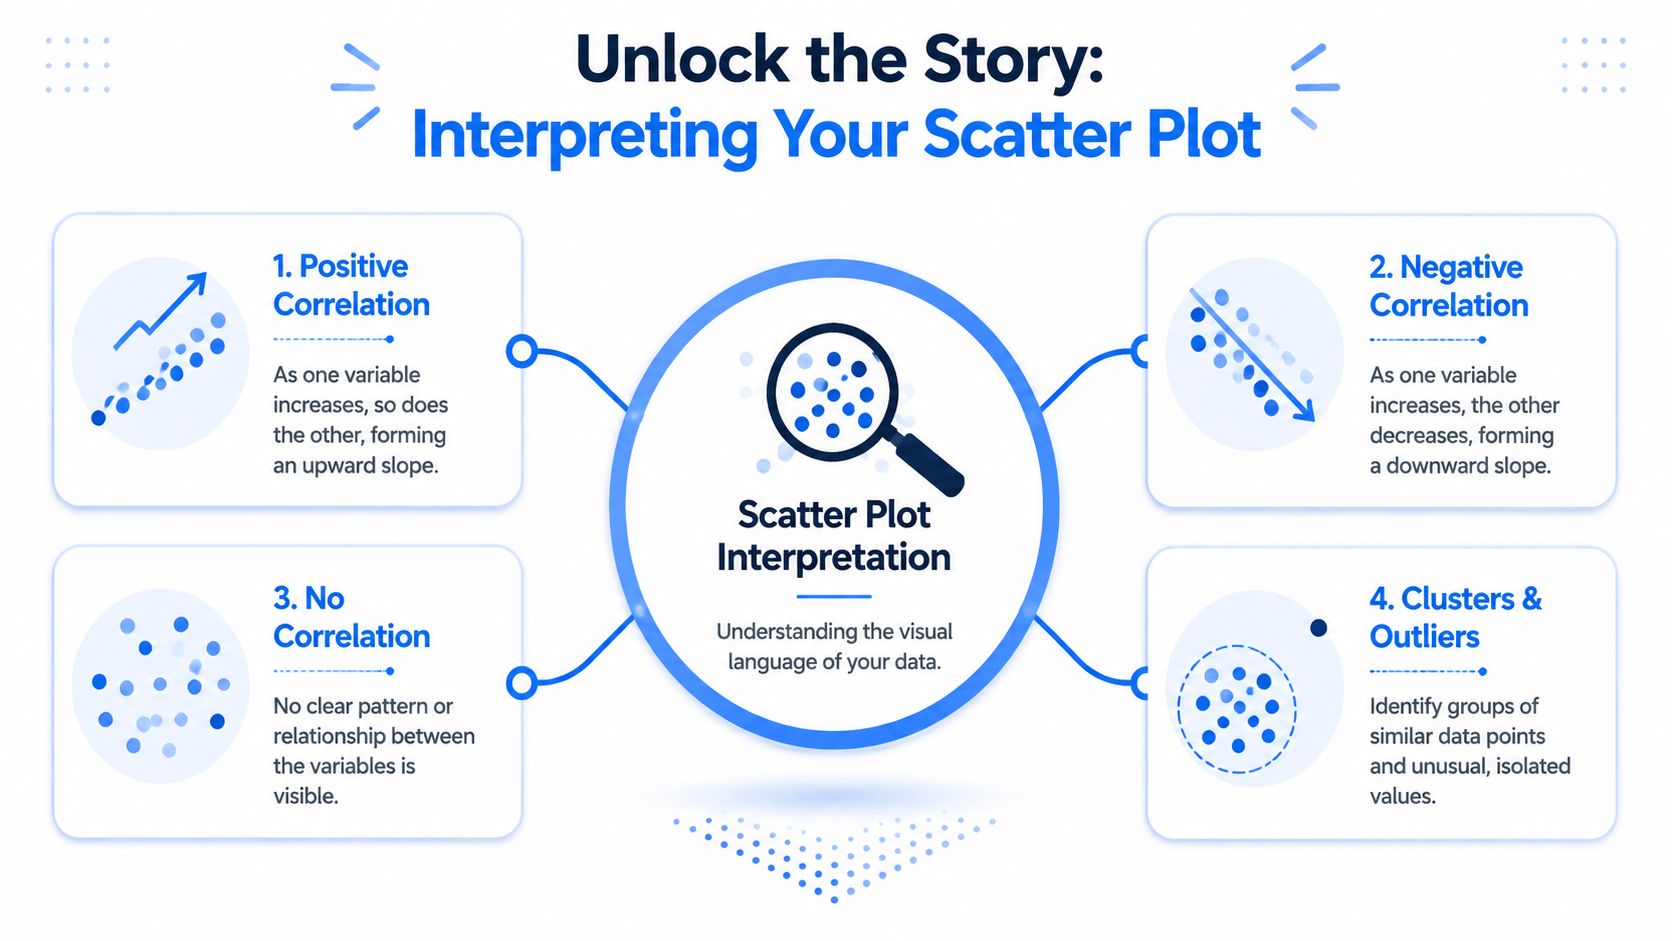
In practice, look for these signals:
An upward drift: As the x-value rises, the y-value tends to rise too. That suggests a positive relationship.
A downward drift: More of one variable tends to come with less of the other. This often points to trade-offs.
A loose cloud: The points don't form a reliable directional pattern. There may be little relationship, or you may need segmentation.
Distinct pockets: Separate groups suggest that one hidden dimension is shaping behavior.
Lonely points: Outliers often matter more than averages because they reveal exceptions, failures, or unusual wins.
Design discipline matters here. If your chart is overloaded with visual encoding, interpretation gets muddy fast. For a solid grounding in clean analytical views, review these data visualization best practices.
Turn patterns into business questions
The chart itself is not the answer. It's a filter for better questions.
Suppose you're looking at Sales versus Profit in a retail dataset. A cluster in the upper right suggests products or accounts that are both high revenue and high margin. A concentration near high sales but weak profit points to discounting, returns, freight issues, or an unfavorable mix. A set of negative-profit points demands a different kind of follow-up. Why are these deals being approved at all?
A good analyst moves from pattern to hypothesis quickly:
Visual pattern | Likely interpretation | Useful next question |
|---|---|---|
Tight upward grouping | Stronger positive relationship | Which segment drives it most? |
Wide, messy spread | Weak or mixed relationship | Are categories masking different behaviors? |
Separate clusters | Distinct subgroups | What dimension explains the split? |
Isolated extreme point | Outlier | Is this error, one-off event, or strategic exception? |
Don't treat the densest area as the whole story. Dense regions tell you what's common. Outliers tell you what might be costly, fragile, or unusually valuable.
The strongest scatter plots are rarely the prettiest ones. They're the ones that make you stop and investigate one pattern you wouldn't have noticed in a table.
Advanced Techniques to Enhance Your Scatter Plot
Once the base chart works, Tableau gives you several ways to deepen the analysis. Not every feature deserves a place in every dashboard. The right additions depend on the question, the audience, and the performance cost.
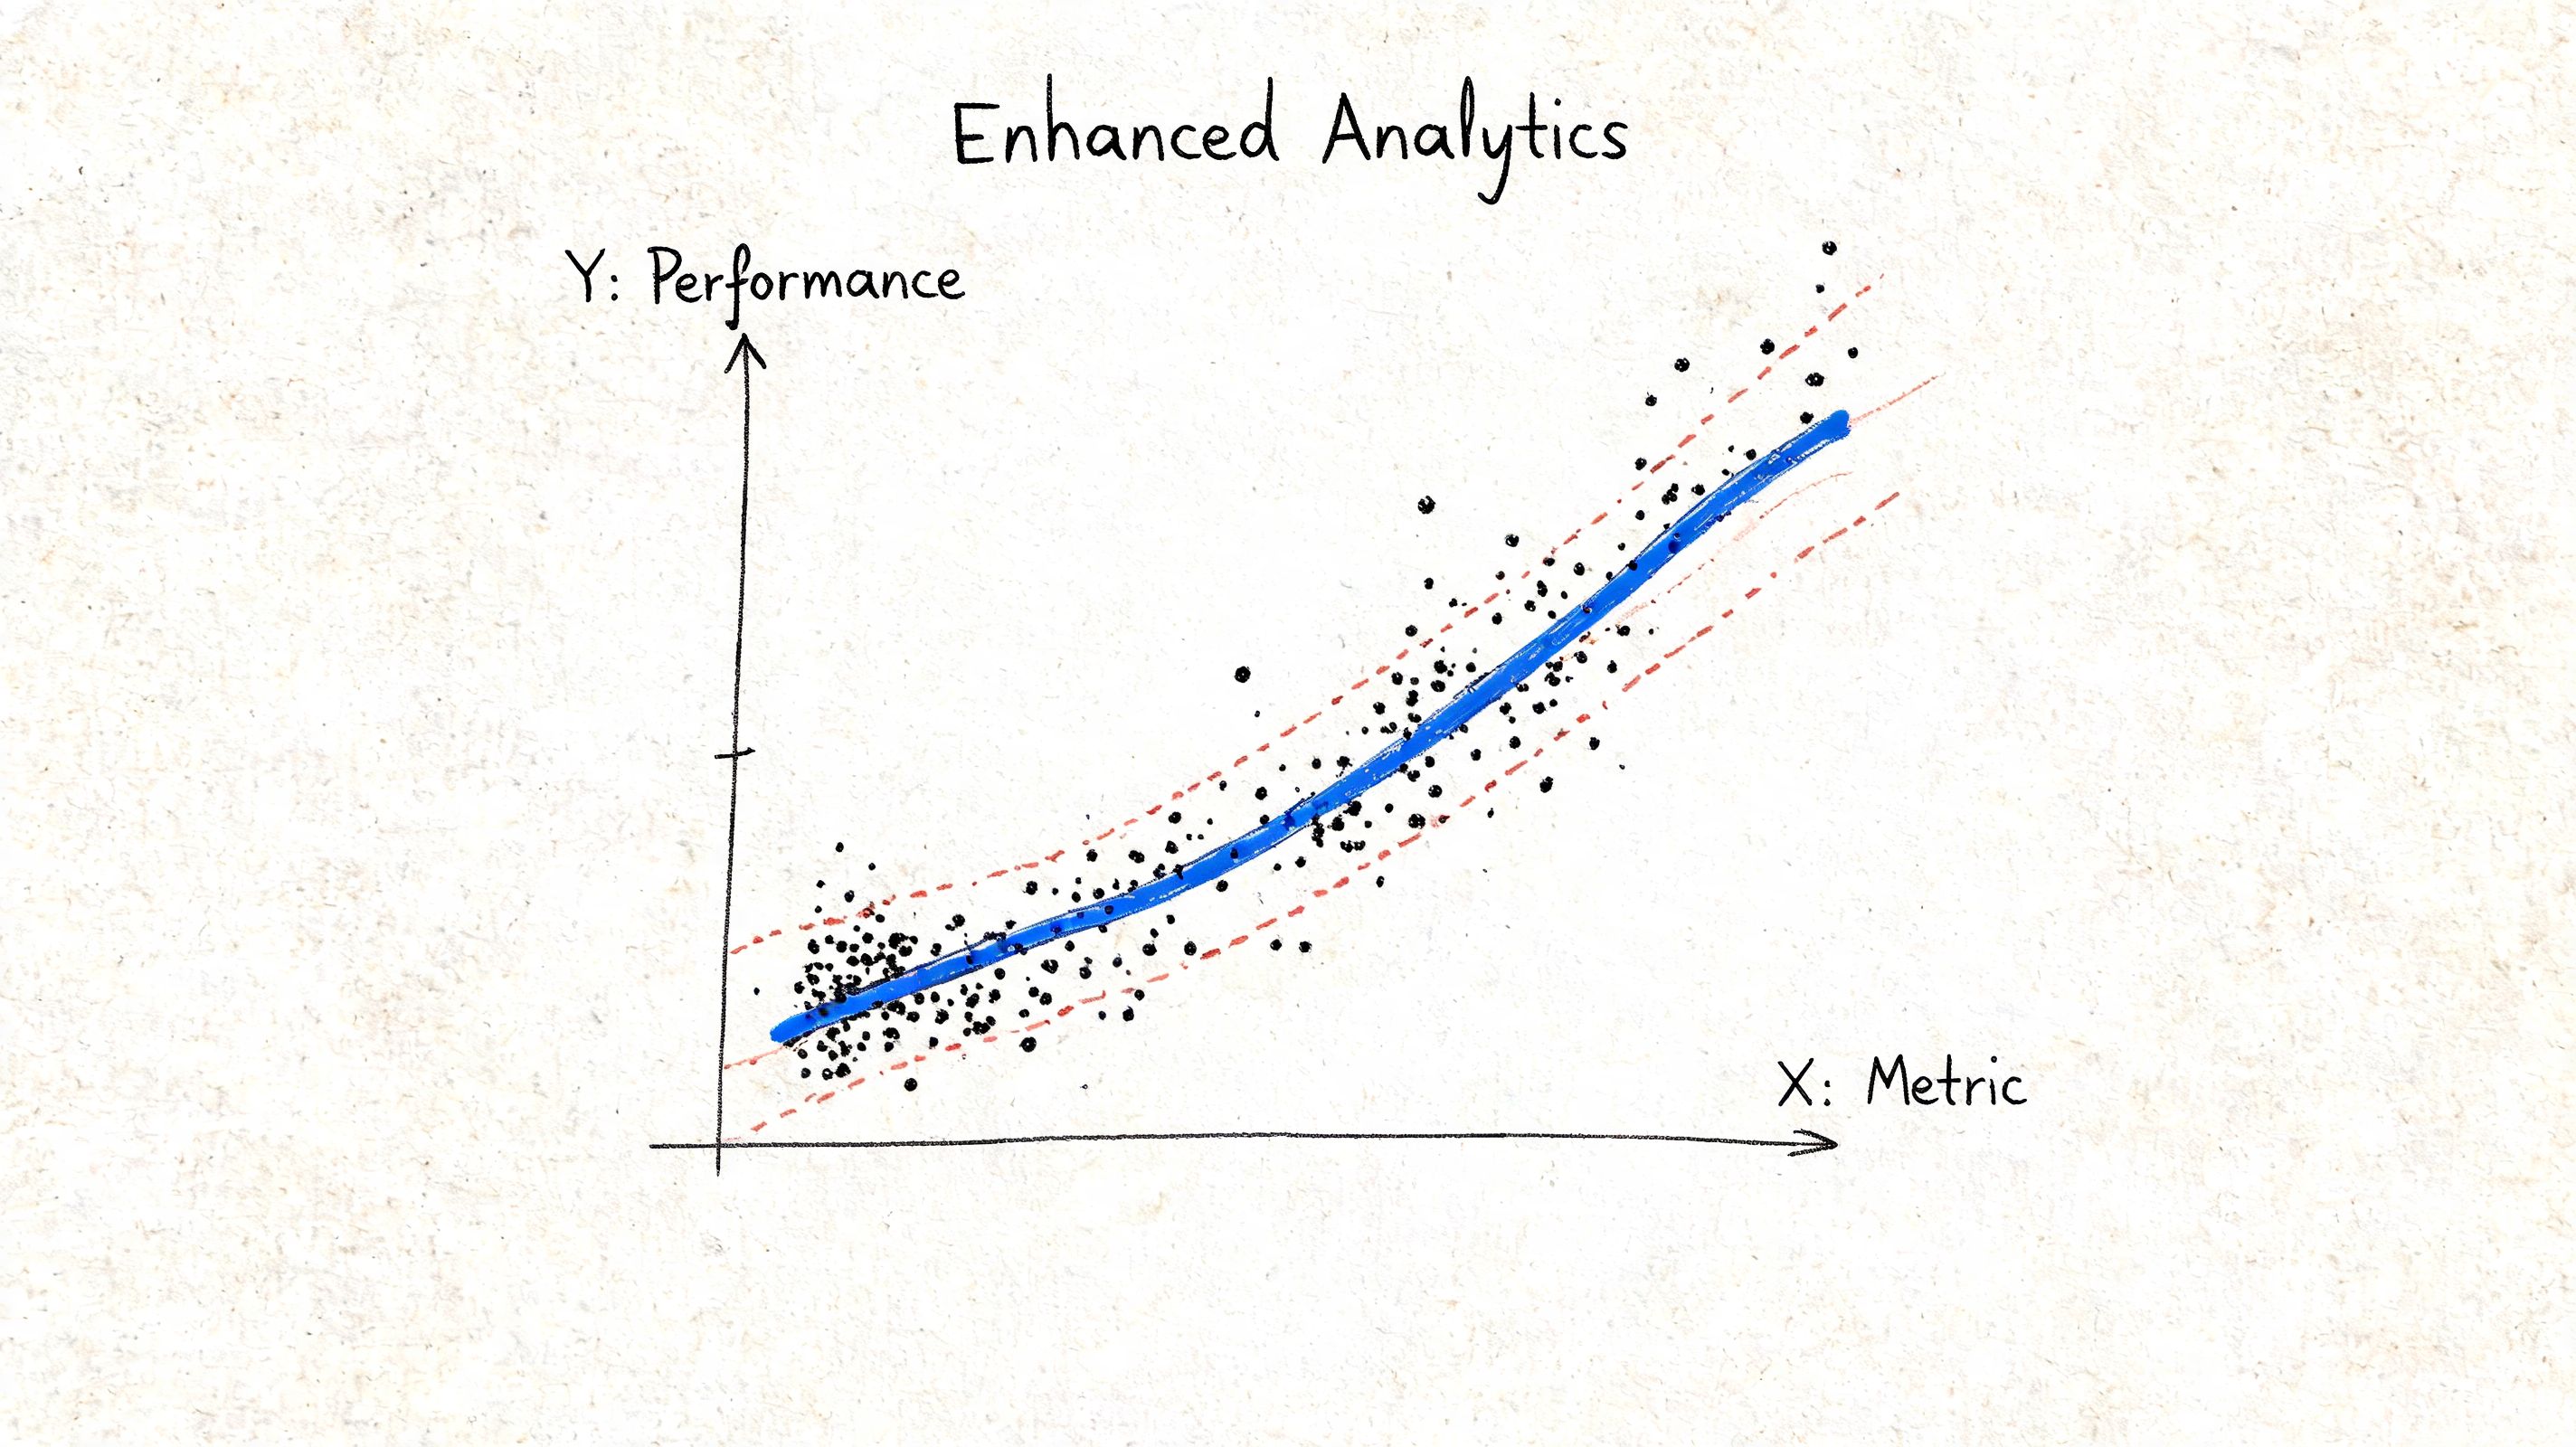
Use trend lines carefully
Trend lines are valuable when you want to quantify the overall direction instead of relying on visual instinct alone. In Tableau, you can add them from the Analytics pane. They're especially useful when a stakeholder sees random noise and you need a statistical summary of the pattern.
But don't overstate what a line means. A regression line summarizes a relationship in the displayed data. It does not prove causation, and it can hide meaningful subgroup behavior. If categories behave differently, one overall line may blur more than it clarifies.
Use trend lines when:
You need a summary signal for an exploratory discussion
You want to compare subgroup relationships after splitting the view
You're testing whether the visible pattern is strong enough to justify deeper modeling
Skip them when the audience is likely to interpret the line as a forecast without context.
Segment with dynamic clustering
Native clustering is one of Tableau's most underused scatter plot features. It can separate points into groups based on similarity without requiring a predefined label, which makes it useful for customer segmentation, product grouping, or behavioral pattern discovery.
The more interesting move is to make clustering dynamic. Tableau supports parameter-driven control of cluster count, so non-technical users can change the number of clusters in real time, and you can combine that with a calculated outlier flag such as a Z-score threshold above 2 for anomaly detection (Tableau clustering documentation).
This works well when you're exploring questions like:
Are we looking at one customer base or several distinct behaviors?
Do high-engagement users split into meaningful subgroups?
Which points sit far enough from the group to deserve manual review?
If you're building supporting logic around those segments, a solid grasp of Tableau calculated fields helps a lot. The calculations don't need to be fancy. They need to be explicit and easy to audit.
Fix dense views with visual restraint
Overplotting is a design problem with analytical consequences. If too many points overlap, your eye starts lying to you. You may miss clusters, understate density, or overlook exceptions near the center of the cloud.
Three fixes usually work:
Reduce opacity: This makes dense regions darker and sparse regions lighter.
Add borders to marks: Subtle outlines help points stay visible in crowded areas.
Avoid over-encoding: Too many dimensions across color, shape, size, and detail create chart junk.
There's also an accessibility concern many teams ignore. Color choices that feel obvious to the builder may fail for part of the audience. Red-green splits are a common problem. Use Tableau's palette editor carefully, test combinations, and rely on more than color alone when categories matter. Borders, shapes, and clear labels often do more work than another stylish palette.
When a scatter plot gets crowded, the answer usually isn't more encoding. It's less decoration and a clearer analytical priority.
Make tooltips do real analytical work
A dot without context is only half useful. A good tooltip turns hover behavior into a fast investigative workflow.
Don't stuff the tooltip with every available field. Include only what helps explain why the point sits where it does. Good tooltip fields often include the entity name, the two plotted measures, one explanatory dimension, and one contextual metric that helps the user judge whether the point is normal.
For example, if the scatter plot shows customer spend versus profit contribution, the tooltip might include:
customer name
region
sales
profit
order count
discount status or product mix indicator
That lets the user move from “this point is odd” to “this point is odd because it has high sales, low profit, and a discount-heavy order mix” without leaving the chart.
The principle for advanced work is simple. Every enhancement should help answer a business question faster. If it doesn't improve the question or the answer, leave it out.
Troubleshooting Common Scatter Plot Issues in Tableau
Most scatter plot problems in Tableau come from one of three places. Granularity is wrong, performance is strained, or visual encoding is doing too much.
A simple troubleshooting table is often more useful than another long tutorial.
When the chart shows one mark
If you place two measures on the canvas and see a single point, Tableau is aggregating to a higher level than you intended. That's normal behavior. The fix is to define the level of detail explicitly with a dimension on Detail.
When the chart gets slow or messy
Performance and readability often break at the same time. Analysts add more dimensions to explain the chart, then the chart becomes slower and harder to read.
When datasets exceed 100,000 data points, adding dimensions to the Marks card can degrade scatter plot performance by 30 to 40 percent, and the practical fix is to convert high-cardinality fields into Dimensions and place them on the Detail shelf to preserve row-level granularity more efficiently (DataFlair on Tableau scatter plot performance).
Scatter Plot Troubleshooting Guide
Problem | Likely Cause | Quick Fix |
|---|---|---|
Only one mark appears | Tableau is aggregating both measures at a high level | Add a dimension such as Order ID or Customer Name to Detail |
Points don't represent the business entity you expected | Wrong granularity | Define what one dot should mean, then use the matching dimension on Detail |
Chart becomes slow on large data | Too many dimensions added to Marks | Keep high-cardinality identifiers on Detail and reduce extra encodings |
Color or size behaves oddly | Field type or mark role doesn't fit the intent | Check whether the field should be discrete or continuous, and whether it belongs on Color, Size, or Detail |
View looks cluttered | Overplotting and too many encodings | Lower opacity, simplify marks, and remove nonessential dimensions |
Interpretation feels backward | Axes are conceptually reversed | Put the driver on x and the outcome on y |
A few trade-offs are worth remembering:
Disaggregation gives insight but adds noise: More marks can reveal outliers, but they can also create visual clutter.
Color improves segmentation but can redefine detail: In Tableau, fields on Color can change how many marks appear.
More context isn't always more clarity: Tooltips often beat additional on-chart encoding.
The fastest way to fix a bad scatter plot is to stop styling it and re-check granularity, axis meaning, and mark definition.
When a chart feels wrong, that's usually where the error lives.
Beyond the Scatter Plot Your Next Steps in Data Exploration
The fundamental value of a scatter plot in Tableau isn't the chart itself. It's the habit it builds. You start thinking in relationships, trade-offs, segments, and exceptions instead of just totals.
That's a more useful analytical posture for product and business work. Teams that can read scatter plots well tend to ask better follow-up questions. They know when a metric is moving. More importantly, they know when the movement hides very different behaviors underneath.
From there, the next step is usually deeper modeling. You might compare subgroup regressions, build parameterized views, or use a more explicit regression line scatter plot guide to move from visual exploration into stronger explanatory analysis.
Traditional dashboards still matter, but they can lock people into predefined questions. The stronger skill is exploratory thinking. Once you can define the right variables, pick the right level of detail, and interpret the pattern accurately, you're no longer limited to static reporting. You're doing real analysis.
If your team wants that kind of self-serve analysis without turning data analysts into a ticket queue, Querio is worth a look. It lets technical and non-technical users work directly on warehouse data with AI-assisted querying, notebooks, and flexible analysis workflows, so teams can move from dashboard consumption to actual investigation.

