Platform: platform business intelligence that accelerates decisions
Discover how platform business intelligence turns data into actionable insights, enabling faster decisions for every team.
https://www.youtube.com/watch?v=qFJF45viO6g
published
Outrank AI
platform business intelligence, embedded analytics, self service bi, data strategy, ai analytics
ad4a49bd-e681-4ee2-a129-e27dbb566c66

Imagine if your company’s data wasn’t trapped in a dozen different spreadsheets or locked away in separate software tools. What if, instead, it flowed freely through a central nervous system, delivering instant, reliable answers to anyone who needs them, right when they need them? That’s the core promise of platform business intelligence—a unified, scalable approach that goes far beyond traditional dashboards for both your internal teams and your customers.
What Is Platform Business Intelligence?
Platform business intelligence is a major leap from juggling isolated BI tools. It's about creating a single, integrated environment for all things data. Think of it like this: instead of a kitchen drawer full of mismatched gadgets—a standalone blender, a separate mixer, a clunky food processor—you have a fully-equipped professional kitchen where every component works together perfectly.
This approach brings together data querying, visualization, and AI-powered analysis into one secure, cohesive space. The ultimate goal is to give non-technical users, from product managers to finance analysts, the power to get answers from complex data without writing a single line of code or waiting for the data team to run a report.
The Central Nervous System for Data
At its heart, a BI platform acts as your organization’s data hub. It plugs into all your different data sources—your CRM, product database, financial software, you name it—and builds a unified "business dictionary" on top of them. This is often called a semantic layer, and its job is to translate cryptic database jargon into plain English. That way, when someone asks about "monthly recurring revenue," everyone gets the same, accurate number.
A true BI platform establishes your single source of truth. It ensures every team, from sales to operations, makes decisions using the same consistent, governed metrics. This finally puts an end to conflicting reports and arguments over whose numbers are "right."
This unified approach is quickly becoming mission-critical for businesses. The global market for business intelligence platforms is surging, projected to grow from $40.35 billion in 2024 to over $114 billion by 2035. This massive growth shows just how hungry companies are for reliable, data-driven decision-making.
Moving Beyond Simple Reports
While older tools were great for building static dashboards, a modern BI platform delivers a dynamic, interactive experience. It’s designed to answer not just the what, but to help you dig into the why. For a deeper dive on what makes a great report, check out our guide on business intelligence reporting.
These modern platforms make it possible with capabilities like:
AI-Powered Querying: Users can simply ask questions in natural language, like, "What was our customer churn rate last quarter by region?" and get an instant answer.
Drill-Down Capabilities: You can immediately click into any number on a chart to explore the underlying data and understand the root causes and trends behind it.
Centralized Knowledge: Insights aren't lost in email chains or Slack threads. They are saved and shared in a central repository, building a library of business knowledge over time.
By bringing all these features together, platform business intelligence transforms data from a static resource into an active, conversational partner for your entire organization.
The Architecture Powering Modern BI Platforms
So, what’s really going on under the hood of a platform business intelligence solution? It’s not some single, massive piece of software. A better way to think about it is a collection of high-tech digital Legos—each block has a very specific job, and they all snap together to turn raw, messy data into clear, trustworthy answers for everyone.
This approach creates a central hub that connects your internal teams and external customers directly to the insights they're looking for.
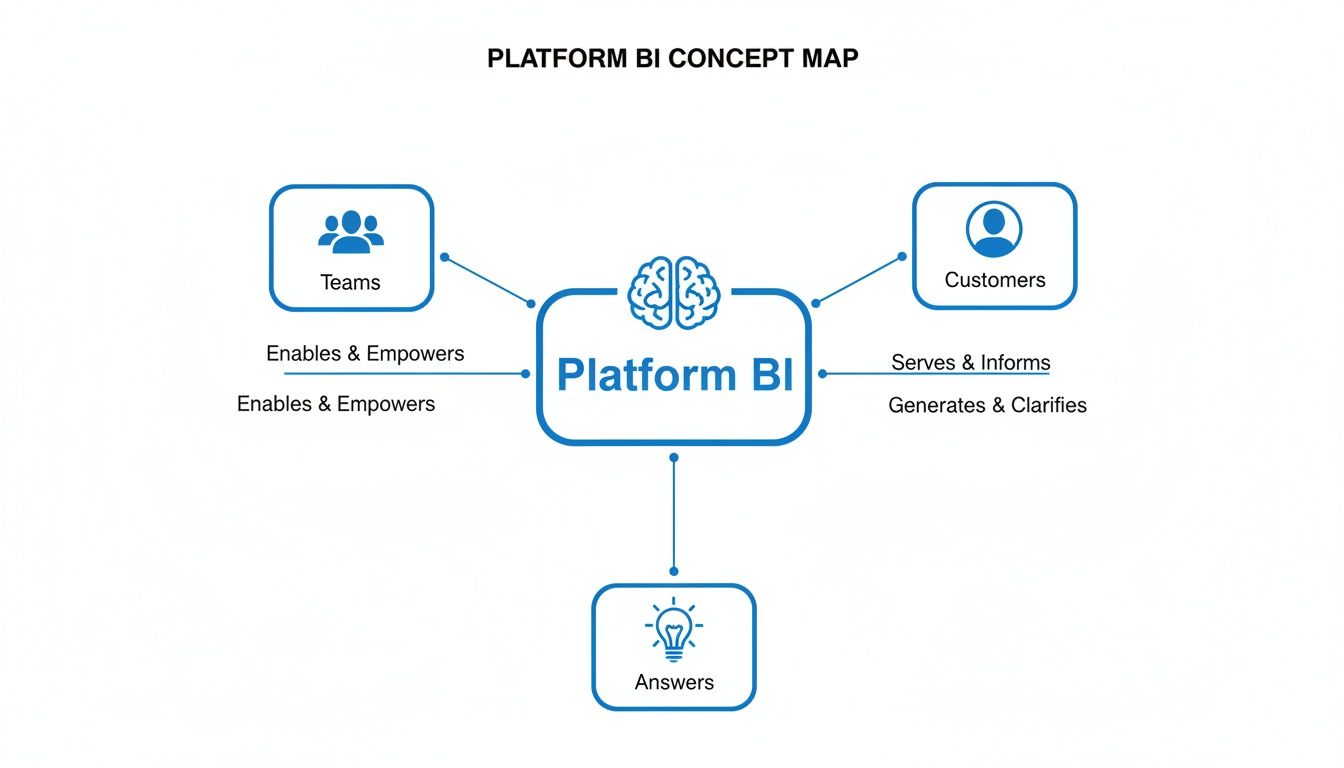
At its heart, the architecture is designed to be the single source of truth, making the journey from complex data to simple answers feel effortless.
The Foundation: Data Connection Layer
Everything begins by tapping into your data right where it is. A proper BI platform architecture has a strong data connection layer loaded with pre-built connectors for all sorts of data warehouses, databases, and business apps. This layer securely accesses your information—usually in a read-only mode—without having to copy or move huge datasets around.
This direct connection is a big reason why these platforms are so nimble. You’re always querying the most current data, which is critical for making smart decisions in the moment.
The Brains: The Semantic Layer
Once you're connected, you get to what is arguably the most important part of the whole setup: the semantic layer. Think of it as your company's official business dictionary or a universal translator for your data. It sits between your raw database tables and your end-users, defining all your important metrics and business rules in one central spot.
For instance, your database might have a table called sub_rev_fy24 with confusing column names like trx_amt and cust_id. The semantic layer translates this technical jargon into plain English:
sub_rev_fy24becomes "Financial Year 2024 Subscriptions"trx_amtbecomes "Transaction Amount"A complex SQL calculation just becomes "Monthly Recurring Revenue"
This means when a product manager asks for "MRR," they get the exact same number as the finance team. It’s a simple concept, but it’s incredibly powerful for eliminating data confusion and building trust across the business.
The semantic layer is where data teams set the guardrails. They define metrics, joins, and logic once, ensuring every self-serve query from business users is automatically accurate, secure, and fast.
The Magic: AI Query Engine and Visualization Layer
With all the business logic neatly defined, the next piece of the puzzle is the AI query engine. This is the smart component that understands natural language. When a user asks, "What were our top 10 products by sales in Q2?" the engine uses the semantic layer to translate that question into a perfect SQL query.
It then runs that query against your database, gets the results, and passes them to the visualization layer. This final layer instantly picks the best chart or table to present the answer clearly. This whole process—from a simple question to a visual answer—takes just a few seconds. It’s a core part of the modern analytics stack that truly makes self-service analytics possible. To see how this fits into the bigger picture, you can learn more about the modern analytics stack and its components in our detailed guide.
Core Architectural Principles
Finally, a few core principles are baked into the architecture from day one—they aren't just features tacked on later. Any true platform BI solution must have these fundamentals.
Multi-Tenancy: The ability to serve analytics to different clients or departments from a single platform while keeping their data completely separate and secure.
Row-Level Security (RLS): This enforces data permissions down to the individual row. A sales manager for North America sees only North American data, while the VP of Sales sees global performance—all from the very same dashboard.
Embeddable Components (SDKs): The entire system is built to be embedded. This means you can place charts, dashboards, or even an "Ask your data" search bar directly inside your own software, giving your customers a seamless, native analytics experience.
How Platform BI Drives Tangible Business Growth
It's one thing to talk about the architecture of a platform business intelligence solution, but let's get to the real point: how does it actually grow a business? The short answer is that it completely changes the pace and quality of your decision-making, moving you from a reactive, report-driven culture to a proactive, insights-first mindset.
For anyone in leadership, the most immediate change is the speed. The old way was a waiting game. You'd ask the data team for a report, wait days—or even weeks—and then start the whole cycle over with follow-up questions. A BI platform collapses that entire timeline into minutes. An executive can now ask, "Show me our month-over-month revenue growth by customer segment," and get a reliable answer on the spot.
But it’s not just about getting answers faster; it’s about everyone getting the same answer. When sales, marketing, operations, and finance all pull from a single, centralized semantic layer, the metrics are finally aligned. The endless debates over whose spreadsheet is right are over. Instead, everyone can focus their energy on what the data actually means for the business.
From Manual Chaos To Streamlined Operations
Think about the classic "before and after" for a SaaS company. Before, it's organized chaos. Finance is wrestling with complex Excel files, the product team has its own analytics tool, and marketing is using a completely different system for campaign data. To get a simple, 360-degree view of a customer, someone has to manually pull and piece together data from three different places. It's slow, prone to human error, and just doesn't scale.
After adopting a platform BI solution, that world looks entirely different.
Unified Data: All their data sources are now plugged into one platform. A shared business logic layer ensures that everyone agrees on what "Active Users," "Churn Rate," and "Customer Lifetime Value" really mean.
Self-Serve Empowerment: The product manager can track feature adoption in real time without filing a ticket. The head of marketing can instantly see campaign ROI tied directly to revenue, not just vanity metrics like leads.
Strategic Focus: The data team is finally free from the endless fire drill of ad-hoc report requests. They can now focus on bigger things, like refining the data model and hunting for the deep, strategic insights that guide the company's future.
This shift allows organizations to make smarter strategic moves by truly understanding what's happening in their market. To get a better handle on this, it's worth reviewing some competitive intelligence best practices.
Boosting Product Value and Market Speed
The impact on product and engineering teams is just as significant. If you've ever tried to build customer-facing analytics from scratch, you know it's a monumental effort that can consume engineering resources for quarters, if not years. A BI platform with strong embedding capabilities gives you a massive head start.
Using pre-built, white-label SDKs, product teams can drop rich dashboards, interactive charts, and even AI-powered "Ask your data" features right into their own application. It's a game-changer.

This picture says it all: it's the move from scattered, manual planning to clear, data-driven strategy on a single screen. This is the core promise of platform BI—turning messy data into a single source of truth that fuels intelligent business planning.
This approach dramatically shortens time-to-market, delivers immediate value to customers hungry for their own data, and carves out a serious competitive edge.
The demand for these advanced tools is exploding. North America currently represents 38% of the global business intelligence software market, but the entire pie is getting bigger. The market was valued at $47.04 billion in 2026 and is on track to hit a staggering $168.06 billion by 2035. This surge is largely driven by cloud BI tools that let teams ask questions in plain English and get back AI-powered answers, all without writing a line of code.
Ultimately, platform BI drives growth by making trustworthy data an asset for everyone in the company, not just a select few. To see how this plays out in dollars and cents, you can dig into the ROI of adopting AI-powered analytics tools.
Putting Platform BI To Work Across Your Organization
Understanding platform business intelligence in theory is one thing, but seeing it solve real, everyday business problems is where its power truly clicks. The magic happens when different teams stop wrestling with data in isolation and start using it to make smart decisions, fast.
Let's look at how a unified BI platform can change the game for key people across your company.
When you move from siloed tools to a single source of truth, you’re not just connecting data points; you’re building a cohesive, company-wide strategy.
For The Product Manager
Product managers are always asking: which features are people loving, and which are collecting dust? Without clear data, they're often flying blind, forced to rely on gut feelings or a handful of customer comments to build a roadmap. This guesswork frequently leads to wasted engineering hours on features that ultimately flop.
With a BI platform, that same product manager can simply ask, "Show me the adoption rate for our new checkout flow, broken down by user tenure." Instantly, the platform’s AI-powered search serves up a chart showing real-time engagement. From there, they can drill down to see if certain user groups are abandoning the process at a specific step.
The result? Product managers make data-validated decisions. They can confidently sunset underperforming features and invest more in what truly delights users, leading to a much better product and a more efficient development cycle.
For The Head Of Data
Data leaders are caught between a rock and a hard place. They need to empower the business with data, but they’re also the gatekeepers of governance, security, and accuracy. The old way of doing things—fielding an endless stream of ad-hoc report requests—creates a massive bottleneck that ties up their team.
A BI platform flips that script. The data team can build a governed, secure semantic layer that acts as the single source of truth. They define core metrics like "Monthly Active Users" or "Customer Lifetime Value" just once. After that, anyone in the business who asks for that metric gets the same consistent, accurate answer every time.
The data team shifts from being report-builders to strategic enablers. They establish the guardrails for safe self-service analytics, keeping control while freeing up their team to focus on high-impact projects.
This shift is a big reason why so many companies are adopting this approach. To dig deeper into how this works, check out our guide on how self-service analytics works and the best tools for the job.
For The Operations Team
Operations teams oversee incredibly complex systems, from supply chains to logistics networks. Even a small delay or a minor inventory error can cause huge problems down the line. When they have to rely on static reports, they’re always playing catch-up, reacting to issues long after they’ve happened.
Now, picture an operations manager with a live, central dashboard monitoring KPIs like "order fulfillment time" and "supplier delivery accuracy" in real time. If a metric drops, an alert fires. The manager can immediately ask, "Which warehouse is experiencing the longest delays this week?" and get a direct answer.
This gives the operations team proactive control. They can spot bottlenecks before they happen, optimize inventory, and fix problems before they escalate, directly boosting efficiency and cutting costs.
For The Finance Team
Finance teams spend a shocking amount of time on manual variance analysis—the painstaking process of comparing actual spending to the budget. This usually means exporting data from different systems into giant, unwieldy spreadsheets, a slow and error-prone nightmare.
A BI platform automates this entire process. At the end of the month, a financial analyst can just ask, "Show me the biggest variances between our forecasted and actual marketing spend for Q3." The platform instantly highlights where the budget was missed, and they can drill down to see the specific campaigns or channels responsible. Looking at actionable channel dashboard examples can provide a clear vision of how to consolidate this kind of data effectively.
Ultimately, the finance team gets back weeks of time previously lost to manual data crunching. The monthly close gets faster and more accurate, freeing them to focus on strategic financial planning instead of tedious data entry.
Your Guide to Implementing a BI Platform
Switching to a unified platform business intelligence solution might seem like a huge undertaking, but it doesn't have to be a painful, drawn-out affair. The good news is, modern platforms are built for speed. With a smart roadmap, you can go from evaluation to empowering your teams much faster than you’d expect.
The journey, however, doesn't start with technology. It starts with your people and your goals. Before you even glance at a demo, get your key stakeholders in a room—product, data, finance, operations—and define what a win actually looks like. What are the top five questions you desperately need answers to right now? Nailing this alignment upfront is the bedrock of a smooth implementation.
The Initial Setup and Data Connection
Once your goals are locked in, the technical work can begin, and it’s often surprisingly quick. The first real step is connecting the platform to your data sources, like a data warehouse or various databases. Thanks to modern connectors, this is a secure, read-only process that a developer can often knock out in minutes.
This is a critical point. You aren't moving or copying huge volumes of data. Instead, the platform is simply given permission to query your existing data right where it lives. This approach is not only faster but also far more secure, and it guarantees your teams are always working with the freshest information available.
With the connection live, the next vital phase is building out the semantic layer. Think of this as the Rosetta Stone for your data. Your data team steps in to translate complex database schemas into plain, everyday business terms. They’ll define your key metrics (like "Monthly Recurring Revenue" or "Customer Churn Rate"), set up relationships between data sets, and build the business logic that will power everything. This one step gets rid of data confusion for good.
The Buyer’s Checklist for a Modern BI Platform
Choosing the right platform is more than just a software purchase; it’s a strategic investment. You have to look past the slick dashboards and dig into the core architecture. That's what will determine if the solution can actually scale with your business and deliver on its promises.
A solid platform is built on a few non-negotiable fundamentals. Your checklist must include: multi-tenant architecture if you plan on offering analytics to your own customers, verifiable SOC 2 Type II compliance for enterprise-grade security, and well-documented embeddable SDKs that let you seamlessly integrate analytics into your own application.
These aren't just features to check off a list; they are the pillars that make a platform secure, scalable, and flexible enough for both your internal and customer-facing needs. A platform missing any one of these will eventually hold you back.
To make this process easier, here's a checklist to guide your evaluation and implementation. Thinking through these items early will save you major headaches down the road.
Platform BI Implementation Checklist
Phase | Key Action | Critical Feature to Verify |
|---|---|---|
Evaluation | Define both internal and external (customer-facing) use cases. | Multi-Tenancy: Can the platform securely isolate data for different clients or business units? |
Evaluation | Vet security and compliance with your InfoSec team. | Security Certifications: Does the vendor have SOC 2 Type II, HIPAA, or other relevant compliance? |
Evaluation | Plan how analytics will appear inside your own product. | Embedding & SDKs: Are the SDKs (Software Development Kits) robust, flexible, and well-documented? |
Implementation | Connect to your primary data warehouse (e.g., Snowflake, BigQuery). | Live Query Connectors: Does the platform query the warehouse directly without moving or caching data? |
Implementation | Define core business metrics and logic with the data team. | Semantic Layer: Is it easy to model data, define metrics, and set up reusable dimensions? |
Adoption | Plan role-specific training for business teams. | Ease of Use: Can a non-technical user ask a question and get a trusted answer in seconds? |
Ultimately, a thorough evaluation ensures the platform you choose is not just a tool for today, but a foundation for growth tomorrow.
Onboarding Users and Driving Adoption
With the technical foundation solid, the final and most important step is getting your people on board. This is where a true platform business intelligence solution really proves its worth. Because the semantic layer handles all the technical heavy lifting, your business users don't need to know SQL or have any coding skills to dive in.
Effective onboarding should focus on teaching them what questions to ask their data, not how to build a complex report from scratch.
A good rollout plan includes:
Role-Specific Training: Show the product team how to track feature adoption, and help the finance team automate their budget variance reports. Make it relevant to their day-to-day work.
Identify Your Champions: Find the enthusiastic power users in each department. They’ll become your go-to experts, helping their colleagues and spreading success stories organically.
Build a Knowledge Base: Encourage everyone to save and share their findings directly within the platform. This creates an ever-growing library of collective business wisdom that everyone can tap into.
By taking this kind of structured approach, you turn what could be a daunting project into an achievable plan. The implementation stops being a technical hurdle and becomes a strategic initiative that delivers real, measurable value right away.
Measuring Your Impact and Dodging the Usual Stumbling Blocks
So, you’ve launched your new platform business intelligence solution. That’s a huge step, but the real work—and the real value—is just beginning. If you want to know whether your investment is actually paying off, you need to look past simple usage numbers and start measuring how it's changing the way people work.
It’s not about system uptime or how many dashboards have been built. The true KPIs measure a shift in behavior and the quality of decisions being made. Are people getting answers faster? Are they more confident in their choices? That’s what we need to find out.
What Does Success Actually Look Like?
To get a real sense of your ROI, you'll want to keep an eye on a few key indicators:
Time to Insight: Forget tracking how long a query takes to run. The real question is: how long does it take for a business user to go from a new question to a confident, data-backed answer? This tells you if your platform is truly efficient.
Adoption by Business Users: What percentage of your non-technical folks are actively digging into the platform every week? When people who don't have "analyst" in their title start using data, you know you've built something intuitive and valuable.
Data-Driven Decision Rate: This one requires you to talk to your teams. Ask them: what percentage of your recent big decisions were backed by platform data versus gut feeling? Seeing this number climb is a sure sign of a cultural shift.
This drive for faster, smarter decisions is exactly why the market for digital intelligence platforms is booming. It's expected to jump from $21.07 billion in 2025 to $25.31 billion in 2026, fueled by the need for AI-powered decision-making. With over 95% of professionals calling analytics vital for success, knowing how to measure your own impact is critical. You can dig into these trends in this digital intelligence platform market report.
How to Sidestep the Most Common Traps
Even the best-laid plans can go sideways. A new BI platform is a significant change, and if you’re not careful, you can hit a few common—and entirely avoidable—roadblocks. Knowing what they are ahead of time is half the battle.
Here are the biggest traps we see people fall into:
Unleashing a "Self-Service Mess": Handing everyone the keys without strong data governance is a recipe for disaster. When every user defines "revenue" or "active customer" differently, you get conflicting reports and kill any trust in the data. Governance isn’t about restricting access; it’s about making sure everyone is speaking the same language.
Forgetting to Train the Humans: Don’t just show people where the login button is. You have to teach them what questions to ask and how the platform can solve their specific, day-to-day problems. If it doesn’t feel immediately relevant to their job, they’ll simply ignore it.
Picking a Tool That Can’t Grow With You: It’s easy to choose a tool that solves today’s immediate pain point. But what happens next year? If your platform lacks a solid multi-tenant architecture or robust embedding SDKs, you’ll find yourself completely boxed in when you want to offer analytics to your own customers or expand to new teams.
"We learned the hard way that a BI platform is only as good as the trust people have in it. We spent our first three months nailing down the semantic layer and governance. It felt slow at first, but it was the single best decision we made. Now, our teams can explore data freely because they know the answers are always accurate." – Fictional Head of Data
By keeping these metrics in your sights and proactively avoiding these classic blunders, your platform business intelligence initiative has a much greater chance of success. It stops being just another piece of software and becomes the engine that helps your entire organization make smarter, faster decisions.
Frequently Asked Questions About Platform BI
As you start to see the potential of a true BI platform, it’s natural for a few key questions to come up. We hear them all the time from leaders evaluating their options. Let’s tackle them head-on.
How Is Platform BI Different From An Embedded Analytics Tool?
This is a really common point of confusion. Think of it this way: embedded analytics is one important capability, but platform business intelligence is the whole system.
An embedded-only tool is built for just one job: putting charts and dashboards inside your app for customers to see. A BI platform does that, but it also serves all your internal teams with the same underlying system. You get one data model, one source of truth, and one security framework for everyone, both inside and out. It’s about creating a single, unified data experience instead of duct-taping separate tools together.
Will Our Data Team Lose Control With A Self-Serve Platform?
It’s actually the exact opposite. A well-designed BI platform gives the data team more meaningful control than ever before. It shifts their focus from being a reactive report factory to being strategic architects of the company's data.
Instead of fielding endless one-off ticket requests, they build and govern the central semantic layer. This is where they define business logic, lock down security rules, and ensure every metric is accurate and trusted. They build the guardrails that empower business users to explore data safely on their own, freeing the data team to work on a much higher level.
How Technical Is The Implementation Process?
You might be surprised. Modern, cloud-native platforms are designed to get you up and running in hours, not months. The initial setup is often as simple as a developer using pre-built connectors to link your data sources—a process that can literally take minutes.
Once the data team models the data, the real magic happens. Business users can start asking questions in plain English, with no technical expertise needed. The platform does all the heavy lifting of writing SQL and building visuals behind the scenes.
Is Platform BI Secure Enough For Enterprise Data?
Yes, and it has to be. For any serious BI platform, enterprise-grade security isn't just a feature; it's the foundation everything is built on. Top-tier platforms prove their security posture with credentials like SOC 2 Type II compliance and by enforcing read-only database access.
They also provide incredibly granular controls. With robust row-level security, you can guarantee that users only see the precise slice of data they are authorized to view. This layered, defense-in-depth approach is exactly why enterprises trust these platforms with their most sensitive information.
Ready to give every team the power of data-driven decisions? With Querio, you can turn curiosity into accurate answers in seconds. Explore our AI-powered platform today!

