Business Intelligence
The ROI of adopting AI-powered analytics tools
Explore how AI-powered analytics tools can significantly enhance ROI by streamlining processes, improving decision-making, and driving growth.

AI analytics can deliver $3.50 for every $1 spent. But success depends on clear goals, measuring ROI, and aligning AI with business needs. By 2025, AI is essential for cutting costs, improving decisions, and driving growth - but 42% of companies fail due to unclear value and rising costs.
Key Takeaways:
- Cost Savings: Automate tasks, reduce errors (e.g., 30% downtime reduction in mining, $5M saved in telecom operations).
- Faster Decisions: Real-time insights cut delays by 50% (e.g., AI in supply chains reduces forecasting errors by 50%).
- Revenue Growth: Personalized marketing boosts ROI by 20–30%, increases sales-ready leads by 25%.
- Proven Results: PayPal halved fraud losses; H&M’s AI assistant increased conversions by 25%.
Querio’s AI platform simplifies analytics with tools like natural language queries and real-time dashboards, helping businesses achieve measurable ROI. Start small with pilot projects, set clear metrics, and integrate AI into existing systems to maximize returns.
Data ROI Unlocked: Turning Analytics into Real Business Value, with Milan Dhore (Director of AI S...
::: @iframe https://www.youtube.com/embed/8GD23KZprwg :::
Core Business Benefits of AI-Powered Analytics Tools
AI-powered analytics bring measurable benefits by cutting costs, speeding up decision-making, and driving growth. These improvements directly impact ROI through better operations and increased revenue.
Cost Reduction and Process Efficiency
Cutting costs is one of the most direct ways to improve ROI, and AI-powered analytics excel in this area. By automating tasks and reducing errors, these tools free up employees for more strategic work. For instance, automation can reduce data processing errors by as much as 90%[5].
Deloitte’s research shows how effective these tools can be. Robotic process automation slashed the time needed to prepare management reports from several days to just one hour, while travel expense report preparation dropped from three hours to just 10 minutes[3]. In manufacturing, an automaker achieved a 97% defect detection rate with AI-based visual inspection systems, compared to just 70% for human inspectors[3]. Predictive maintenance is another area where AI shines. A mining company used AI to predict equipment maintenance, cutting downtime by up to 30%[3].
Other industries are seeing similar results. Bouygues Telecom used generative AI to analyze call center data, reducing pre- and post-call operations by 30% and saving over $5 million in the process[3]. Electrolux implemented AIOps to cut IT issue resolution times from three weeks to one hour, saving more than 1,000 hours annually by automating repair tasks[3]. In supply chain management, AI tools have reduced forecasting errors by up to 50% and slashed lost sales due to inventory shortages by as much as 65%[3].
Beyond cost savings, AI analytics transform decision-making by delivering real-time insights, enabling businesses to act faster and smarter.
Better Decision-Making Through Real-Time Data
Faster, smarter decisions can have a significant impact on ROI, and AI-powered analytics make this possible by providing actionable insights in real time. Instead of relying on routine reports, companies can now make predictive decisions. Businesses using AI analytics in their operations dashboards have reduced decision-making delays by over 50%[9].
In financial services, AI tools analyze market sentiment by scanning news and social media, delivering insights within minutes[6]. Healthcare organizations use continuous monitoring to predict complications, improving patient outcomes while optimizing resource use[6]. In manufacturing, AI predicts equipment failure and optimizes production lines, cutting downtime and boosting efficiency[6]. Supply chain management also benefits from real-time monitoring of inventory and shipments, allowing for quicker responses to changes[7].
These real-time insights not only enhance immediate decision-making but also lay the groundwork for scalable, long-term growth.
Business Growth and Flexibility
AI analytics pave the way for scalable growth, allowing businesses to expand revenues without a proportional rise in costs. These systems can handle larger workloads without increasing operational expenses[4], making growth not just possible but more profitable.
The numbers back this up: 84% of business leaders believe AI gives them a competitive edge, and 75% say it enables better decisions[8]. Over 30% of companies using AI report saving significant time, freeing up teams to focus on strategic priorities[8]. AI also democratizes data access, empowering non-technical teams to make informed decisions[9]. Integration capabilities further enhance this by providing a unified view of the business, fostering cross-functional collaboration[9].
Adaptability is another major advantage. AI analytics enable businesses to respond quickly to disruptions, improve customer experiences, and pivot when needed. For example, IBM used AI-driven supply chain solutions during the COVID-19 pandemic, saving $160 million and achieving a 100% order fulfillment rate[3].
AI also elevates marketing efforts through sophisticated personalization. By tailoring campaigns to individual preferences, businesses can enhance customer experiences and boost conversion rates[10]. Marketing teams can create highly targeted audience segments, maximizing ROI through precise microtargeting[10]. As Vivek Singh, Executive Vice President of Business and Delivery at PALNAR, puts it:
"AI tools are now vital to the scalability and growth potential of most organizations."[8]
Finally, predictive capabilities help businesses plan for the future. From forecasting trends to optimizing supply chains and managing inventories, AI analytics improve financial planning and long-term strategy[10].
Together, these benefits create a strong case for AI analytics, setting the stage for integrating Querio's AI-driven platform in the next section.
ROI Measurement: Metrics and Success Examples
Once the advantages of AI are clear, the next step is proving its worth. Measuring ROI involves tracking the right metrics - both numbers and experiences - and learning from real-world examples.
Key ROI Measurement Metrics
To get a full picture of AI's impact, it's best to look at both financial outcomes (like cost savings, revenue growth, and time efficiency) and qualitative benefits (such as better customer experiences, improved employee productivity, and smarter decision-making).
Before diving into AI analytics, companies should set SMART goals - specific, measurable, achievable, relevant, and time-bound[12]. Establishing a baseline is crucial. For instance, if your current customer acquisition cost is $150 per lead, you can track how AI tools improve that over time. The formula for ROI is straightforward: (Net Benefits ÷ Total Costs) × 100[12].
Interestingly, research shows that for every $1 spent on AI, companies see an average return of $3.50[17]. However, these results depend heavily on how well AI is implemented and monitored. Key metrics to track include:
- Cost savings: Automation can reduce operational expenses.
- Revenue growth: AI-driven targeting often boosts sales.
- Time efficiency: Faster data processing and reporting saves valuable hours.
- Customer satisfaction: Personalization leads to happier customers.
For example, marketing campaigns powered by AI have achieved 20–30% higher ROI, increased sales-ready leads by 25%, and cut customer acquisition costs by up to 25%[12][11]. Additionally, the EY AI Pulse Survey found that 75% of senior leaders using AI reported positive ROI, with key benefits in operational efficiency (77%), employee productivity (74%), and customer satisfaction (72%)[18].
Now, let’s explore some success stories from 2025 that highlight how precise ROI metrics translate into real-world results.
Case Studies: 2025 Success Examples
The following examples show how companies have successfully used AI to achieve measurable ROI by aligning AI-powered analytics with business strategy:
-
PayPal's Fraud Prevention: Between 2019 and 2022, PayPal nearly doubled its annual payment volumes, reaching $1.36 trillion while cutting its loss rate by half using advanced AI algorithms. By Q2 2023, PayPal reported $7.3 billion in revenue (a 7% year-over-year increase) and reduced losses by 11% through improved risk management, deploying AI models in just 2–3 weeks[1].
-
AI in Healthcare Diagnostics: A study published in March 2024 by the American College of Radiology revealed that an AI-powered diagnostic platform delivered a 451% ROI over five years. When factoring in radiologist time savings, the ROI jumped to 791%. Results varied based on hospital type and how quickly the technology was adopted[1].
-
H&M's Virtual Shopping Assistant: Within six months of introducing an AI-powered virtual assistant, H&M saw higher sales revenue and lower support costs. The system resolved 70% of customer queries without human help and boosted conversions on chatbot-assisted sessions by 25%[13].
-
Bank of America's Erica: Since its launch, Erica, the AI banking assistant, has handled over 1 billion interactions, saving millions in operational costs. It reduced call center traffic by 17% and increased mobile customer engagement by 30%[13].
-
Lufthansa's Multi-Language Chatbot: Lufthansa implemented an AI chatbot to handle customer service in multiple languages. It resolved 80% of queries without human agents, cut response times by 60%, and reduced the need for live agents by 40%[13].
-
AI for Retail Fit and Sizing: A sportswear retailer using AI for personalized fit recommendations saw a 297% increase in conversions, a 27% rise in average order value, and 28% fewer returns. Similarly, an ethical activewear brand reported a 332% jump in conversions and a 35% increase in average order value[14].
These case studies highlight a key takeaway: companies that align AI initiatives with specific business objectives - not just adopting tech for the sake of it - achieve the best ROI[15].
"Companies that use AI to inform their KPIs are far more likely to see improved metrics." - MIT Sloan Management Review [19]
In the healthcare sector, 74% of organizations using generative AI are already seeing returns[16]. Moreover, top-performing companies are twice as likely to extract value from AI compared to their peers[2]. The secret lies in setting realistic goals, monitoring progress, and implementing AI strategically over time.
sbb-itb-284a532
Maximizing ROI with Querio's AI-Driven Business Intelligence Platform
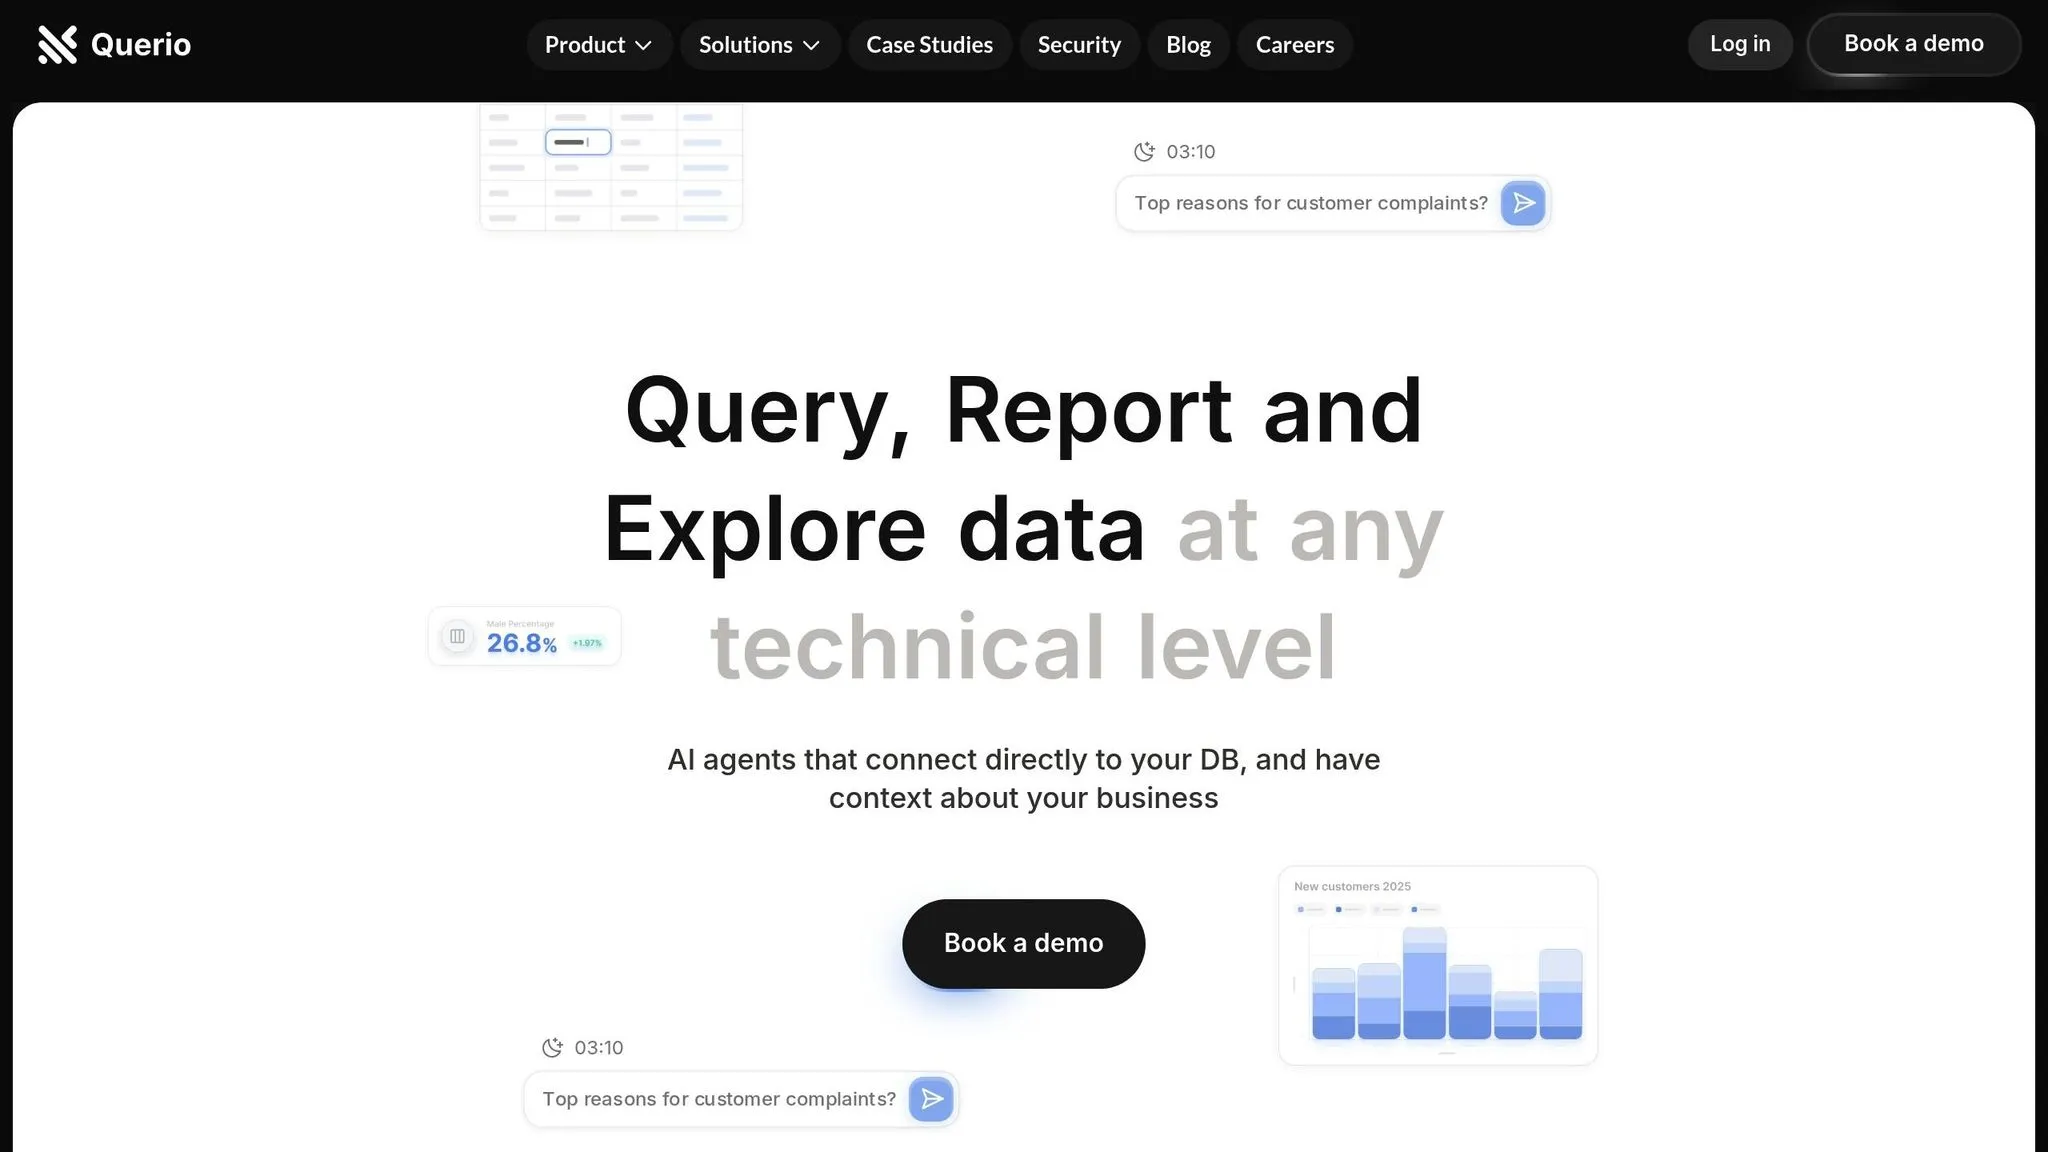
To achieve impactful results, having the right tools is essential. Querio's AI-driven business intelligence platform breaks down common barriers - like technical limitations, slow response times, and poor team collaboration - to help businesses get the most out of their analytics investments. By directly connecting to major databases and offering user-friendly tools, Querio makes data accessible across your organization, enabling quicker and more actionable insights. Let’s dive into how its intuitive features make data analysis more efficient.
Easy Data Analysis with Natural Language Queries
Traditional SQL queries often slow down decision-making, requiring specialized skills that can create bottlenecks. Querio simplifies this process with a natural language interface that turns everyday questions into precise database queries. For instance, a user could ask:
"Show me revenue growth from Q1 to Q3 this year for our West Coast stores, but only those that exceeded their quarterly targets" [20]
…and instantly receive the data they need. This Natural Language-to-SQL (NL2SQL) technology bridges the gap between human language and complex database structures. A real-world example? Uber’s internal NL2SQL tool cut average query times from about 10 minutes to just 3 minutes [20]. The result: faster insights and reduced operational costs.
Real-Time KPI Tracking with Dynamic Dashboards
Static reports and delayed updates can hinder agility. Querio’s dynamic dashboards solve this by providing real-time access to key performance indicators, empowering teams to make proactive decisions. These interactive dashboards allow users to drill down, filter data, and instantly generate reports. This self-service approach helps teams quickly identify and address issues before they escalate. As Ted Jackson, Co-founder of ClearPoint, puts it:
"Without context, data is noise. These dashboards clarify and direct strategic decisions." [21]
With quicker responses to challenges, organizations can fine-tune processes - whether it’s inventory management, cash flow optimization, or customer engagement - ensuring they stay ahead in industries like finance, healthcare, and e-commerce.
Better Collaboration Between Business and Data Teams
Strong collaboration between business and data teams is critical for maximizing ROI. Often, business users know what questions they need answered but lack the technical skills to access the data, while data teams might not fully understand the business context. Querio bridges this gap with AI tools that enhance teamwork. Its algorithms identify patterns and trends, freeing analysts from repetitive tasks and allowing them to focus on more strategic work. This is particularly valuable for organizations managing data from hundreds of sources - sometimes up to 400 [22].
Querio also offers a rich notebook feature that allows data teams to perform complex analyses in a flexible environment. These insights can then be easily shared with business stakeholders, improving overall outcomes. As Katrina Redmond, Chief Information Officer at Eaton, notes:
"AI is really playing a very strategic part across our own internal productivity or getting data insights and analytics from information in new ways." [23]
Implementation Steps for AI Analytics ROI Success
Bringing AI-powered analytics to life requires a shift from planning to action, with clear milestones and measurable results along the way. Businesses that see the best returns - averaging $3.50 for every $1 spent on AI investments [17] - follow a structured approach to minimize risk and maximize value. It all begins with setting clear, business-focused goals.
Define Clear Goals and Success Metrics
The foundation of any successful AI analytics project lies in a robust data analytics strategy with specific, measurable objectives. Without clear targets, 30% of generative AI projects fail [24]. These goals should directly tie to meaningful business outcomes, not just the novelty of the technology itself. Ask yourself: What matters most to your business? It could be increasing revenue through smarter pricing strategies, improving efficiency by automating repetitive tasks, or boosting customer retention by identifying at-risk customers with machine learning models [26].
Using frameworks like SMART goals (Specific, Measurable, Attainable, Relevant, Time-bound) can help structure these objectives [27]. For instance, you might aim to cut average response times by 40% within six months while maintaining a 95% customer satisfaction rate. Goals like this make it easier to measure progress and prove ROI to stakeholders.
Take Wells Fargo as an example. By setting clear objectives for its AI-driven fraud detection system - reducing fraudulent transactions while maintaining customer trust - the bank saved millions and significantly decreased fraud cases [25].
Once your goals are in place, the next step is to test your approach with small-scale pilot projects.
Start with Pilot Projects for Quick Wins
Instead of diving headfirst into a company-wide overhaul, many organizations start with focused pilot projects that deliver quick wins. These smaller initiatives validate the AI strategy while building confidence and expertise within the team.
AI consultant Jepson Taylor highlights the importance of this approach:
"Identify feasible, high-impact pilot projects."
Customer service, marketing, and sales are popular pilot areas, accounting for 16%, 14%, and 12% of implementations, respectively [24]. Amazon’s personalized shopping recommendations are a prime example. What began as basic product suggestions based on purchase history evolved into a sophisticated system analyzing customer data across multiple touchpoints. This approach led to a significant boost in engagement and sales [25].
For pilot projects, focus on areas where AI can deliver tangible results with minimal upfront investment. For example, conversational AI in customer support can reduce ticket volumes by 30–50%, while automating IT service management can save 1–4 hours per incident [28].
Taylor also stresses the value of learning from early failures:
"With failure, you have the time urgency: How can we fail faster? I'd rather fail this week than four months from now. And there are some innovative creative ways where you can fail faster on projects." [25]
Integrate with Existing Business Systems
To unlock the full potential of AI tools, they must integrate seamlessly with your existing systems. Without this alignment, even the best AI solutions can become costly burdens rather than valuable assets. Proper integration ensures AI tools work smoothly with databases, CRM platforms, and other business applications - without requiring major workflow changes.
Before rolling out any AI solution, take a close look at your current systems and processes [29]. Identify integration points and evaluate the quality of your data sources. This preparation minimizes surprises and ensures your AI tools access the data they need to deliver results. Integration is key to leveraging real-time data and driving efficiency.
Walmart provides a great example. Its AI-powered demand forecasting system pulls in weather data, local event schedules, and historical sales records to predict customer demand by region. This allows for automatic adjustments in pricing and inventory management, ensuring shelves are stocked with what customers need [25].
Similarly, Mayo Clinic’s predictive analytics platform integrates patient data from sources like medical histories and socio-economic factors. By connecting with existing electronic health records, the system identifies high-risk patients and enables targeted interventions, improving care outcomes while cutting costs [25].
When choosing AI platforms, prioritize solutions with robust integration capabilities. Look for tools that adapt to your workflows with minimal disruption, offering intuitive features that fit seamlessly into your existing processes [28].
Conclusion: Maximizing AI Analytics ROI Potential
AI-powered analytics can yield impressive returns when applied thoughtfully and strategically. With 76.5% of agencies already integrating AI into their daily workflows [32], the real question is no longer if businesses should adopt these tools, but how to get the most out of them. The key lies in smart implementation practices that amplify their potential.
The recipe for success combines advanced AI tools with precise execution to streamline processes, improve outcomes, and save valuable time [32]. As highlighted earlier, establishing clear metrics and starting with pilot projects are critical steps toward achieving measurable results.
It’s important to remember that AI should function as an enabler, not the strategy itself [31]. A compelling example of this is Boston Consulting Group’s collaboration with Querio. By using AI-driven analytics to uncover key topics like ESG and emerging industry trends, BCG delivered actionable insights that boosted client engagement by 15% [30]. This achievement was made possible by blending cutting-edge AI capabilities with human expertise, ensuring the insights aligned perfectly with specific business objectives.
For businesses looking to maximize their return on AI investments, Querio offers a practical starting point. Its features - like natural language analytics and self-service dashboards - deliver data reporting up to 20 times faster than traditional methods [33]. With a free plan and an impressive 4.7/5 rating [33], Querio provides an affordable way for organizations to test the value of AI analytics before scaling further. The next step, Core, is $2,499 a month, or $25,000 a year billed annually.
However, technology alone isn’t enough. Success also depends on maintaining high-quality data, fostering collaboration across teams, and committing to continuous learning. With AI expected to generate 97 million new jobs by 2025 [32], the opportunities are vast. Businesses that treat AI analytics as a growing, adaptable capability - rather than a one-time fix - will be best positioned to thrive in an ever-changing market landscape.
FAQs
::: faq
How can businesses set clear goals to maximize the ROI of AI analytics tools?
To get the most out of AI-powered analytics tools, businesses need to begin with clear, measurable goals that tie directly to their broader strategy. Think of objectives like cutting operational costs, boosting customer satisfaction, or driving revenue growth. Setting well-defined goals not only provides focus but also makes it easier to track progress and evaluate success.
Bringing together key stakeholders from different departments is the next step. This ensures the goals address various perspectives and priorities, fostering alignment and encouraging buy-in across the organization. Collaboration at this stage can make a big difference in how effectively the tools are adopted and used.
Another critical factor is ensuring data quality. AI tools are only as good as the data they analyze, so maintaining clean, well-organized, and reliable data is non-negotiable for generating accurate insights.
Finally, businesses should put a system in place for ongoing feedback and adjustments. Regularly reviewing the performance of AI tools, gathering insights, and tweaking objectives helps keep everything aligned with evolving needs. These steps can help businesses harness the full potential of AI analytics tools, delivering measurable and meaningful outcomes. :::
::: faq
What are the best practices for successfully integrating AI analytics tools into existing business systems?
Integrating AI analytics tools into your business systems can streamline operations and enhance decision-making. To make this process seamless, start by focusing on automating data preparation tasks. This includes cleaning and organizing data, which not only cuts down on manual errors but also frees up valuable time for more in-depth analysis.
Another key step is ensuring strong data governance. This means keeping your data accurate and up-to-date so that everyone is working with reliable information. Implementing a single source of truth, like semantic layers, can further improve consistency and build trust in the insights your AI tools provide.
Finally, equip your team with self-service analytics tools. These tools empower employees to explore data on their own, enabling quicker and more informed decision-making. By adopting these practices, you can foster a data-driven mindset and get the most out of your AI analytics investment. :::
::: faq
What metrics should companies use to measure the ROI of AI-powered analytics tools?
To evaluate the ROI of AI-powered analytics tools, businesses should examine both financial gains and non-financial advantages. On the financial side, this means looking at metrics like cost reductions, revenue increases, productivity boosts, and operational improvements. For instance, companies can measure savings from lower overhead costs or track revenue growth driven by insights into customer behavior.
Equally important are the non-financial benefits, such as smarter decision-making, enhanced customer experiences, and higher employee morale. These factors contribute significantly to long-term success. To measure ROI effectively, it’s essential to define clear objectives and key performance indicators (KPIs) before rolling out the tools. By setting baseline metrics and comparing them to results after implementation, businesses can assess both short-term and long-term impacts. When these outcomes align with strategic goals, the value of AI investments becomes evident. :::