Unlock kpi reporting meaning: Convert Metrics into Actionable Growth in 2026
Explore the kpi reporting meaning and learn how to turn data into actionable insights that drive smarter decisions and growth.
https://www.youtube.com/watch?v=6Tr92NGzbQ4
published
Outrank AI
kpi reporting meaning, kpi reporting, business intelligence, performance metrics, data strategy
2462a130-d339-404b-bf72-4529d0233098

So, what exactly is KPI reporting? Forget the jargon for a moment. At its heart, it’s the practice of translating raw business data into a clear, understandable story about your performance. It’s how you answer the most important questions: “Are we winning?” and “Where do we need to focus our energy right now?”
What KPI Reporting Actually Means for Your Business
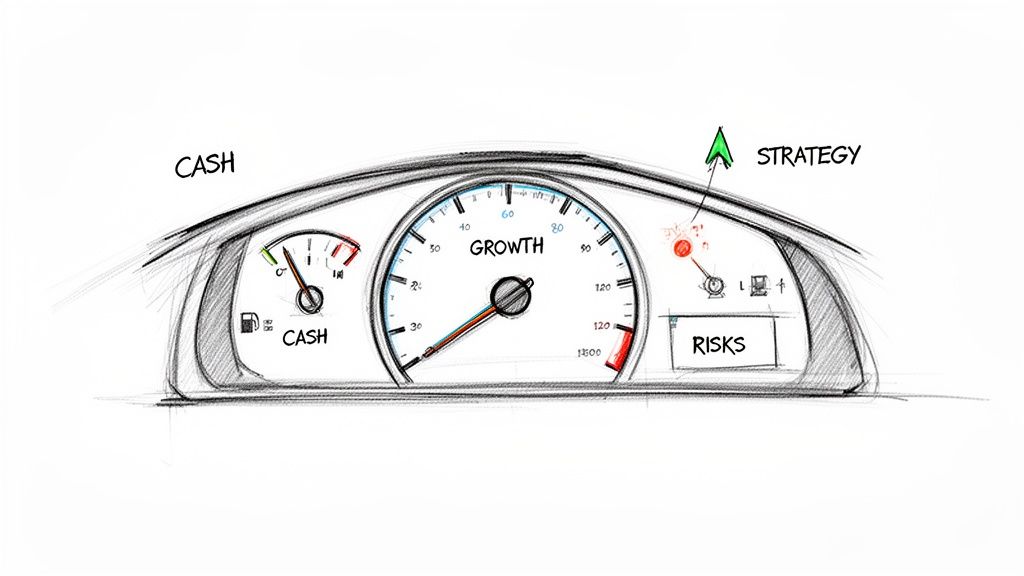
Think of your business like a car on a long road trip. You wouldn't drive by just staring at the speedometer. You need the whole dashboard—fuel gauge, engine temperature, tire pressure, and your GPS. KPI reporting is that dashboard for your company.
It’s not about drowning in every number your business produces. It’s about carefully selecting and presenting the critical indicators that tell you if you're on the right path to your destination.
Separating the Signal from the Noise
A common point of confusion is the difference between a KPI vs Metric. Your company generates thousands of metrics every day, from page views to email open rates. Most of these are just noise.
KPIs are the vital signs of your business. They are a select few metrics directly tied to your most critical strategic objectives. Everything else is just supporting data.
To make this crystal clear, here’s a quick breakdown of the core concepts.
KPI Reporting Core Concepts at a Glance
Component | What It Means for Your Business |
|---|---|
KPI | A vital, measurable value that tracks progress toward a key strategic goal. (e.g., Customer Lifetime Value) |
Metric | Any quantifiable measure. Many are useful but not "key" to strategic success. (e.g., website visits) |
Reporting | The process of visualizing and sharing KPIs to inform decisions and align teams. |
This table shows how each piece fits together to create a powerful system for strategic guidance.
Good KPI reporting pushes teams to move beyond gut feelings and make decisions grounded in hard evidence. It creates a single source of truth that keeps everyone aligned and accountable. When you review these reports regularly, you can:
Spot trends before they become major issues.
Identify opportunities for growth you might otherwise miss.
Allocate your budget and resources with confidence.
Communicate performance clearly to your team, board, and investors.
Ultimately, proper KPI reporting brings clarity and focus. It’s the bridge between your ambitious goals and the tangible results you need to achieve them.
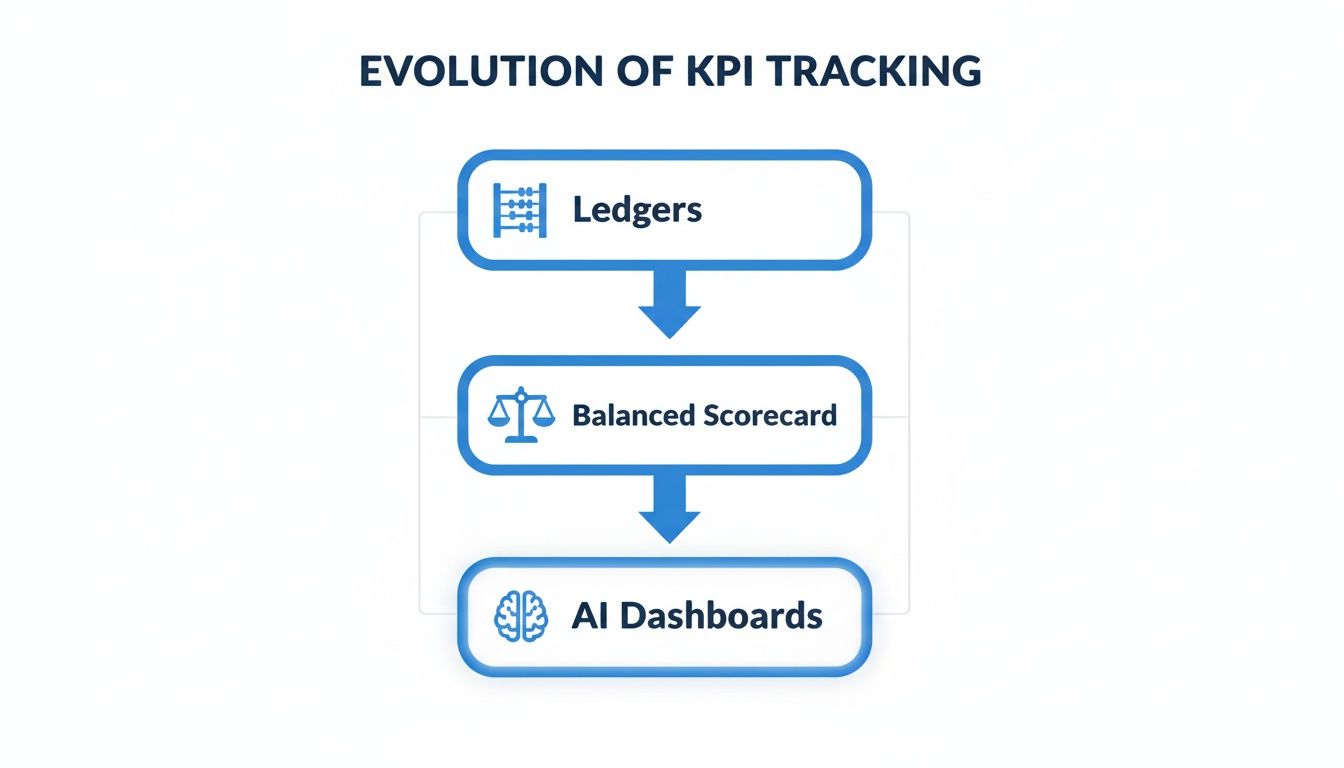
From Dusty Ledgers to Predictive AI: The Evolution of KPI Reporting
If you think KPI reporting is a recent tech-era invention, think again. The practice is as old as business itself, though it looked a lot different in the early 20th century. For decades, tracking performance meant poring over historical financial ledgers—static, paper reports that only showed you where you’d already been.
The first major shake-up came in the 1990s with the introduction of the Balanced Scorecard. This was a genuine breakthrough. For the first time, businesses were pushed to look beyond just the bottom line and consider a more complete picture of health across four areas: financial, customer, internal processes, and growth.
This new framework completely changed the kpi reporting meaning. It was no longer about simple bookkeeping; it became a strategic tool for balancing priorities to build a stronger future. The idea caught on fast. By 2004, over 60% of Fortune 1000 companies were using it to guide their strategy.
The Leap to Real-Time Intelligence
But even that feels like ancient history now. The slow, manual process of compiling historical reports has been replaced by automated, real-time platforms. Modern BI and AI tools have turned reporting from a rearview mirror into a forward-looking GPS for your business.
Today, the goal isn't just to report what happened but to predict what will happen next and prescribe the best course of action. This is the new frontier of KPI reporting.
The results speak for themselves. According to an analysis from Spider Strategies, companies that connect their KPIs to strategic goals with modern tools achieve 40% higher efficiency and hit their targets 35% faster. A huge part of this comes from automation, which can slash the time spent on manual reporting by up to 70%.
You can dig deeper into how strategic KPIs drive business growth to see the full impact. Ultimately, this evolution frees up your data teams from tedious report-building, allowing them to focus on delivering the forward-looking insights that actually move the needle.
Choosing Your North Star KPIs by Department
Knowing what KPI reporting is in theory is one thing. Actually picking the right KPIs to track is a completely different ballgame, and it's where most teams stumble. The goal isn't to track everything; it's to find your "North Star" KPIs—that handful of numbers that tell you, without a doubt, if your strategy is paying off.
This means learning to tune out the noise. It’s so easy to get hooked on vanity metrics, those flashy numbers that look great in a presentation but don't actually mean your business is healthy. For instance, a product team might brag about shipping 10 new features. But if nobody uses them, did you really accomplish anything? A true North Star KPI cuts straight to the chase.
A vanity metric is for showing off. An actionable KPI is for making smart decisions. One helps your ego, the other helps your business.
To make this concrete, let's look at how to separate the meaningful from the meaningless across different teams.
Actionable KPIs vs. Vanity Metrics by Department
This table contrasts meaningful KPIs with common vanity metrics for key business functions, helping you focus on what truly drives strategic decisions.
Department | Actionable KPI (What to Track) | Vanity Metric (What to Avoid) |
|---|---|---|
Product | Feature Adoption Rate: What percentage of users engage with a new feature? | Number of Features Shipped: How many things did we build? |
Growth & Marketing | Customer Acquisition Cost (CAC): How much does it cost to get a paying customer? | Social Media Likes/Followers: How many people clicked a button? |
Finance | Customer Lifetime Value (LTV): What's the total predictable revenue from one customer? | Total Revenue: A big number that ignores profitability or sustainability. |
Customer Success | Net Promoter Score (NPS): How likely are customers to recommend us? | Number of Tickets Closed: Measures activity, not customer satisfaction. |
Focusing on the "Actionable" column is what separates high-performing teams from those just spinning their wheels. The "Vanity" column is full of distractions that can send your strategy off course.
The Right KPIs Tell a Story
Let's zoom in on a couple of these. For a Product team, the job is to build something people genuinely need and enjoy using. Instead of just celebrating a launch, they should be obsessed with metrics that prove ongoing value.
Daily Active Users (DAU): This isn't just a count; it's a direct measure of how sticky your product is. Are people coming back day after day?
Feature Adoption Rate: This tells you if the hard work you put into a new feature actually mattered to your users. It validates your product roadmap.
Meanwhile, a Growth or Marketing team is on the hook for expanding the business, not just making noise. Page views and social media likes don’t pay the bills. Profitable growth does.
Just as our metrics have gotten smarter, so has the way we report on them. We've come a long way from dusty old ledgers to the intelligent dashboards we have now.
This shift isn't just about better visuals; it's about moving from simply looking back at what happened to proactively shaping what happens next. That’s why these two growth KPIs are so critical:
Customer Acquisition Cost (CAC): This number keeps your marketing spend honest. It answers the simple, crucial question: Are we paying too much to win new business?
Customer Lifetime Value (LTV): This is your long-term crystal ball. It predicts the total revenue you can expect from a customer, helping you decide how much you can afford to spend on acquiring them and who your best customers really are.
Getting a handle on these kinds of metrics is fundamental. For a more detailed guide, you can read more on what metrics really matter and how to surface them effectively.
The Anatomy of an Effective KPI Report
What’s the real difference between a KPI report that gets a quick scan and one that actually makes things happen? It’s not about packing it with more charts. The best reports are built on a solid foundation that turns data from a simple check-in to a powerful tool for making smart decisions.
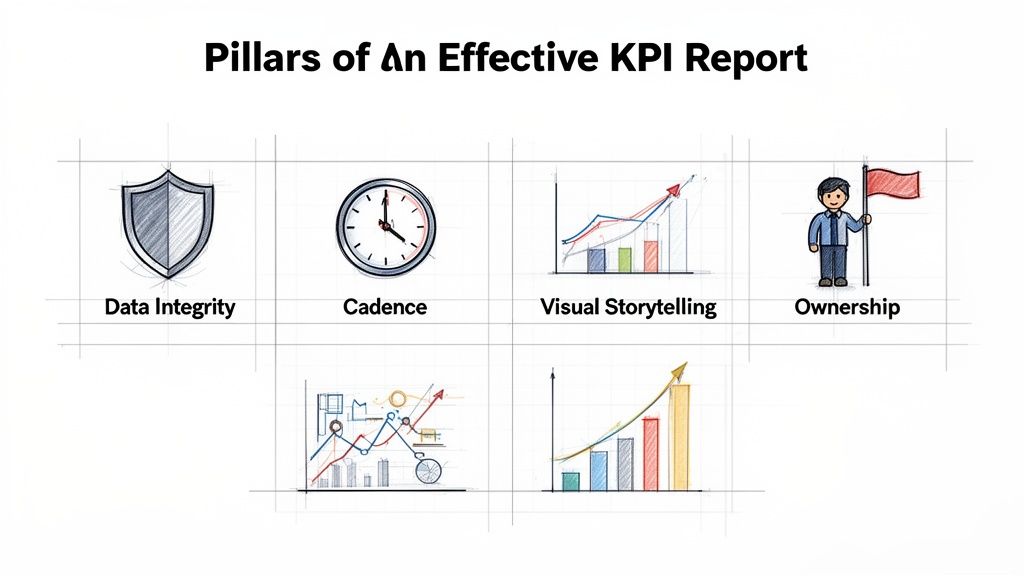
This foundation rests on four core pillars. Get these right, and you’ll have reports that people trust and, more importantly, act on.
The first, and arguably most important, is data integrity. Let's be blunt: your report is useless if the numbers are wrong. You absolutely need a “single source of truth”—one clean, trusted dataset that everyone in the company agrees on. This single step prevents meetings from getting stuck in pointless arguments over whose numbers are right and lets you focus on what to do next.
The 4 Pillars of a Great KPI Report
Once you know you can trust your data, you can build out the other components that make a report truly effective.
Reporting Cadence: How often you report is just as important as what you report. A metric like website uptime needs to be monitored in real-time. Tactical sales goals, on the other hand, are often best reviewed weekly. For big-picture strategic KPIs like market share, a monthly or quarterly review makes more sense. The goal is to match the report's frequency to how quickly you can realistically respond to the information.
Visual Storytelling: We process visuals far faster than text. A great report uses clean charts, simple annotations, and a clear layout to tell a story at a glance. Think about it: a simple line chart showing revenue climbing toward its target is immediately understandable and far more impactful than a dense table of numbers.
The best KPI reports don't just show you data points. They weave a narrative that guides you to a conclusion or a specific action. This is how reporting shifts from a passive task to an active part of your business strategy.
Finally, you need clear ownership. Every single KPI in a report should have a designated owner. This is the person or team who is directly accountable for that number. It creates a culture of responsibility; when a metric starts to dip, everyone knows who is on point to investigate why and figure out a plan to fix it.
Ultimately, powerful reporting goes beyond just data. It’s about creating honest and transparent communication, with companies like Patagonia setting new standards in business reporting. When you build your reports on these four pillars, you foster a culture of accountability and real, continuous improvement.
To dig deeper into this process, check out our complete guide to modern business intelligence reporting and learn how to get the most out of your data.
Common KPI Reporting Pitfalls to Avoid
You’ve built the dashboards, the data is flowing, but a few weeks later, you realize nobody is using them. This is an all-too-common story. Even the most well-designed KPI reporting can become a waste of time if you stumble into a few classic traps.
The most seductive trap is focusing on vanity metrics. These are the numbers that feel good to report but have no real connection to your bottom line—think social media likes instead of qualified leads. It creates an illusion of progress while your actual business goals stagnate.
True KPI reporting isn't about tracking activity; it's about measuring impact. If a KPI doesn't trace back to revenue, customer happiness, or a core business goal, it's just noise.
Misaligned and Cluttered Reporting
Another surefire way to make your reports irrelevant is by creating cluttered, unfocused dashboards. When you try to track everything, you end up highlighting nothing. This "data dump" approach just overwhelms people, burying the critical insights under a mountain of noise. For a deeper dive, check out our guide on avoiding common pitfalls in BI dashboards to keep your visuals clean and actionable.
Just as damaging is when teams operate with inconsistent definitions. If your sales team's definition of a "lead" is different from marketing's, your reports become a source of confusion, not clarity. Before you know it, you're wasting entire meetings arguing over semantics instead of solving problems, and trust in the data quickly erodes.
This kind of disconnect is incredibly costly. In fact, some studies show that misaligned tracking can waste up to 40% of a marketing budget. Chasing metrics like video views without connecting them to actual leads is a perfect example of this "activity illusion," and you can read more about the impact of tracking the wrong digital marketing KPIs to see how it plays out.
The fix? Make sure every single team and department KPI flows directly from your high-level company objectives. This creates a clear line of sight, connecting daily work to the ultimate success of the business.
How Modern BI and AI Accelerate Your Reporting
The days of poring over static, month-old KPI reports are thankfully coming to an end. Modern business intelligence (BI) and AI have completely changed the game, turning reporting from a backward-glance exercise into a forward-looking strategic advantage. This isn't just about making prettier charts; it's about getting real, actionable data into the hands of everyone who needs it.
For example, today’s BI platforms can be connected directly to a company's data warehouse. This approach establishes a single source of truth, empowering people across the organization—not just data specialists—to dig in and find answers on their own. It frees up your data team from a constant backlog of report requests, allowing them to focus on much bigger strategic challenges.
Imagine your sales manager just asking, "What were our top-performing regions last quarter?" and getting an instant answer. That's the power of natural-language querying, and it’s making data accessible to everyone.
From Manual Reports to Automated Insights
This new wave of technology is built for speed, flexibility, and proactive intelligence. By automating the grunt work, modern tools are solving some of the most persistent headaches that have always held back KPI reporting.
Let’s be honest, data quality is a huge problem, affecting around 70% of organizations. Inaccurate reports, which can cost a business an average of $15 million a year, often happen because different departments are just measuring the same things differently. Automation tackles this head-on. Automated data validation can slash those error rates by 60%, while AI-powered forecasting can now predict metrics like MRR with up to 92% accuracy—a massive leap from the 65% you might get with manual guesswork. You can learn more about how these AI-powered insights are changing performance metrics.
Other huge advancements include:
Embedded Dashboards: KPIs are no longer trapped in a separate platform. They can be placed directly inside the tools your team lives in every day, like your CRM, offering insights right where decisions are made.
AI-Driven Anomaly Detection: These systems act like a 24/7 watchdog for your data. They can automatically flag a sudden drop in conversion rates or a weird spike in churn, alerting you to problems long before a human would have noticed.
These capabilities make real-time KPI monitoring with AI a competitive necessity, not just a nice-to-have. It’s the next logical step for any company serious about building a data-driven culture where everyone feels empowered to ask and answer their own questions.
Frequently Asked Questions About KPI Reporting
Once you've wrapped your head around the fundamentals of KPI reporting, a few practical questions almost always surface. We've heard them all, so let's clear up some of the most common points of confusion.
What's the Real Difference Between KPIs, Metrics, and OKRs?
It’s easy to get these terms tangled up, but they have distinct roles. The best way I’ve found to think about it is like planning a road trip.
Metrics are like all the individual readings on your car's dashboard—your current speed, the engine temperature, the RPMs. They're all data points, but not all of them are critical for reaching your destination.
KPIs (Key Performance Indicators) are the crucial gauges you watch constantly to know if you're making progress. Think of your fuel level, ETA, and miles to the next turn. You’ve specifically chosen these to measure progress toward a goal, like increasing organic search traffic by 20%.
OKRs (Objectives and Key Results) are the entire trip plan. The ‘Objective’ is your destination (e.g., "Arrive in San Francisco"), and the ‘Key Results’ are the KPIs that confirm you're on track (e.g., maintain an average speed of 65 mph, cross the Colorado border by noon).
To put it simply: OKRs define the destination, and KPIs are the critical road signs that tell you if you're on the right path. Metrics are just all the other data points you notice along the journey.
How Many KPIs Should We Actually Track?
One of the biggest mistakes companies make is tracking everything. When you have dozens of "key" indicators, the signal gets lost in the noise, and you end up with analysis paralysis. If everything is a priority, nothing is.
The golden rule here is less is more.
A great starting point is to identify 5-7 top-level KPIs for the entire company. These should reflect your ultimate business goals, like profitability or customer retention. From there, each department should own 3-5 KPIs that directly influence those company-wide numbers. This framework keeps everyone focused on what truly moves the needle.
How Often Should We Review Our KPI Reports?
There’s no one-size-fits-all answer—the right cadence depends entirely on how quickly the data changes and how fast you can realistically act on it.
Real-time: Essential for operational teams. Think server uptime for an engineering team or production line output in a factory. You need to know the second something goes wrong.
Daily or Weekly: Perfect for tactical work. A marketing team will want to check campaign performance daily, while a sales team might review their pipeline weekly.
Monthly or Quarterly: Best for the big picture. High-level, strategic KPIs like market share, customer lifetime value, or overall profitability don't swing wildly day-to-day, so a monthly or quarterly review makes the most sense.
The key is to match your review frequency to your team's ability to make meaningful changes based on what the report is telling you.
Ready to move beyond static reports and empower your entire team with self-service analytics? Querio deploys AI agents directly onto your data warehouse, transforming your data team from a bottleneck into a strategic enabler. Learn how Querio works.

