How to clean up data: Quick guide for clean insights
Discover how to clean up data with a practical, step-by-step approach - audit quality, fix errors, and automate hygiene for reliable insights.
https://www.youtube.com/watch?v=0O6hzZtBuOE
published
Outrank AI
how to clean up data, data cleaning, data hygiene, data quality audit, clean data
a12f2b2d-343d-4611-8d12-4136c22df3a2

Knowing how to clean up data isn't just about running a script. It's a methodical process that starts with auditing your data to find the root problems—things like duplicates, missing values, and wildly inconsistent formats. From there, you apply specific cleaning techniques to fix those issues, validate that your fixes actually worked, and then figure out how to automate the whole process to keep your data clean over time.
Why Clean Data Is Your Strongest Asset

Before we get into the "how," let's talk about the "why." It’s easy to dismiss inaccurate or "dirty" data as a minor annoyance, but it’s actually a huge liability. Bad data quietly undermines your business intelligence, eats up resources, and leads to flat-out wrong strategic decisions.
Think of it like this: trying to build a business on dirty data is like trying to build a skyscraper on a shaky foundation. It’s only a matter of time before things start to crumble.
Every flawed dataset poisons your analytics, skews your marketing campaign results, and can even throw your entire supply chain into chaos. So, let’s stop thinking of data cleanup as a technical chore. It's a strategic necessity for any company that wants to achieve sustainable growth and operational excellence.
The Real-World Cost of Bad Data
Poor data quality has real, tangible costs. When your teams can't trust the numbers in front of them, productivity grinds to a halt. I’ve seen analysts spend more time second-guessing the data than actually finding insights. And you can bet that decision-makers are going to hesitate when they suspect a report is built on bad information.
That hesitation hits the bottom line. Just look at these common scenarios:
Wasted Marketing Spend: Inaccurate customer lists mean bounced emails and undeliverable mail. That's marketing budget thrown right in the trash.
Faulty Business Forecasts: Inconsistent sales data can trick leaders into misjudging market demand, leading to costly inventory shortages or overstocks.
Poor Customer Experience: Duplicate customer records might cause the same person to get conflicting messages, creating confusion and frustration.
The need for quality data becomes even more critical in advanced fields. For instance, high-stakes sectors that rely on data analytics and machine learning in venture capital simply cannot function without pristine inputs.
Dirty data is the silent killer of good decisions. It introduces uncertainty and friction into every process, turning what should be a data-driven advantage into a source of constant frustration and costly mistakes.
The table below breaks down just how damaging dirty data can be—and the incredible upside of getting it right.
The High Cost of Dirty Data
Problem Caused by Dirty Data | Business Impact | Benefit of Clean Data |
|---|---|---|
Duplicate Customer Records | Wasted marketing spend, skewed analytics, and a confusing customer experience. | Improved ROI on campaigns and a clear 360-degree view of the customer. |
Missing Contact Information | Inability to reach leads and customers, leading to lost sales opportunities. | Higher contact rates, better lead conversion, and increased revenue. |
Inconsistent Formatting (e.g., Dates, Addresses) | Failed data integrations, inaccurate reporting, and operational errors. | Reliable automation, accurate BI dashboards, and streamlined operations. |
Outdated Product or Inventory Data | Poor inventory management, incorrect pricing, and customer dissatisfaction. | Optimized stock levels, accurate financial forecasting, and better customer trust. |
Ultimately, investing in data quality isn't an expense; it's a direct investment in efficiency, profitability, and smarter decision-making across the board.
A Growing Market Confirms The Need
The explosion of data has pushed data cleanup to the top of the priority list for organizations everywhere. It's no surprise that the global market for data cleaning tools is expected to jump from $3.09 billion in 2024 to $6.47 billion by 2029.
This massive growth is a direct response to rising data complexity and the urgent need for reliable, real-time insights. You can discover more insights about these market trends on giiresearch.com.
Building strong data hygiene isn't just a "nice-to-have" anymore; it’s a competitive requirement. For more on building a durable framework, see our guide to data governance best practices.
First Things First: Kick-Off with a Data Quality Audit
You can't fix what you can't see. Before you write a single line of a cleaning script or delete one suspicious row, your first move should always be a comprehensive data quality audit. This isn't just a preliminary check; it's the foundation of your entire cleanup project. It’s what turns that vague feeling of "our data is a mess" into a concrete, prioritized action plan.
Think of it as a doctor's diagnostic for your datasets. The goal here is to profile your data and get an unvarnished, crystal-clear picture of its structure, completeness, and overall health. We need to look past the surface and start putting real numbers to the problems.
Profile Your Data to Uncover the Problems
Data profiling is all about generating summary statistics and a few quick visualizations to really understand the character of your data. Instead of guessing, you get hard numbers that show you the true scope of the mess. This initial deep dive helps you prioritize what to fix first, so you can focus your energy where it'll make the biggest difference.
I always start by hunting for the usual suspects:
Duplicates: How many records are just copies of each other? Are we looking at multiple entries for the same customer, product, or transaction?
Missing Values: Are critical fields empty? How many records are missing an email address, an order date, or a shipping address?
Inconsistent Formats: Are dates a mess, showing up as "MM/DD/YYYY" in one table and "Day, Month DD, YYYY" in another? What about phone numbers or addresses?
Outliers: Do any values just look wrong? I'm talking about things like a customer age of 200 or a negative purchase amount.
With smaller datasets, you might be able to spot-check these things manually in a spreadsheet. But for any real-world database, you need a more systematic approach. This is where automated tools become indispensable, scanning millions of rows to find those hidden errors you'd never catch by hand. It's no surprise the global market for data cleaning tools hit $2.5 billion in 2023 and is expected to reach $7.1 billion by 2032. The demand for efficiency is driving a huge investment in AI-powered tools that can automate this kind of error detection.
Set a Baseline with Key Metrics
How will you know if your cleanup efforts actually worked? You need a "before" picture. Documenting a few key data quality metrics gives you that essential baseline to measure against later. It’s how you prove the value of your work and confirm that your changes are actually making things better.
Your audit should culminate in a report that tracks metrics like:
Completeness Rate: The percentage of fields that aren't empty for each critical column. For instance, you might discover your
customer_emailfield is only 75% complete.Duplicate Percentage: The share of records that are exact or even "fuzzy" duplicates. Finding out that 15% of your customer records are redundant is a game-changer.
Format Consistency: The percentage of values that stick to a standard format, like a valid phone number structure or a consistent date format.
Validity Score: The percentage of data that falls within an expected range. For example, ensuring a
statefield contains only valid two-letter state codes.
A data quality audit is simply non-negotiable. It replaces assumptions with facts and gives you a clear roadmap for cleaning things up effectively. Without this initial deep dive, you risk spinning your wheels on low-impact fixes while the major issues continue to poison your analytics.
This whole process of measurement and validation is fundamental. You're not just tidying up; you're turning your data into a reliable, trustworthy asset. If you're ultimately aiming for advanced applications like machine learning, it's worth checking out our guide on how to assess data readiness for AI adoption to see just how high the bar is.
Once your audit is done, you'll walk away with a prioritized list of issues, a set of measurable goals, and a clear path forward for your data cleaning strategy.
Hands-On Data Cleaning Techniques That Work
Alright, your data quality audit is done. You've got a clear map of where the problems are hiding. Now it's time to roll up your sleeves and get to work transforming that messy data into a reliable asset. This is where we shift from diagnosis to cure, tackling the most common culprits one by one.
Understanding these frequent data problems is the first real step toward building a solid cleanup plan. This visual guide quickly breaks down the usual suspects you'll find.
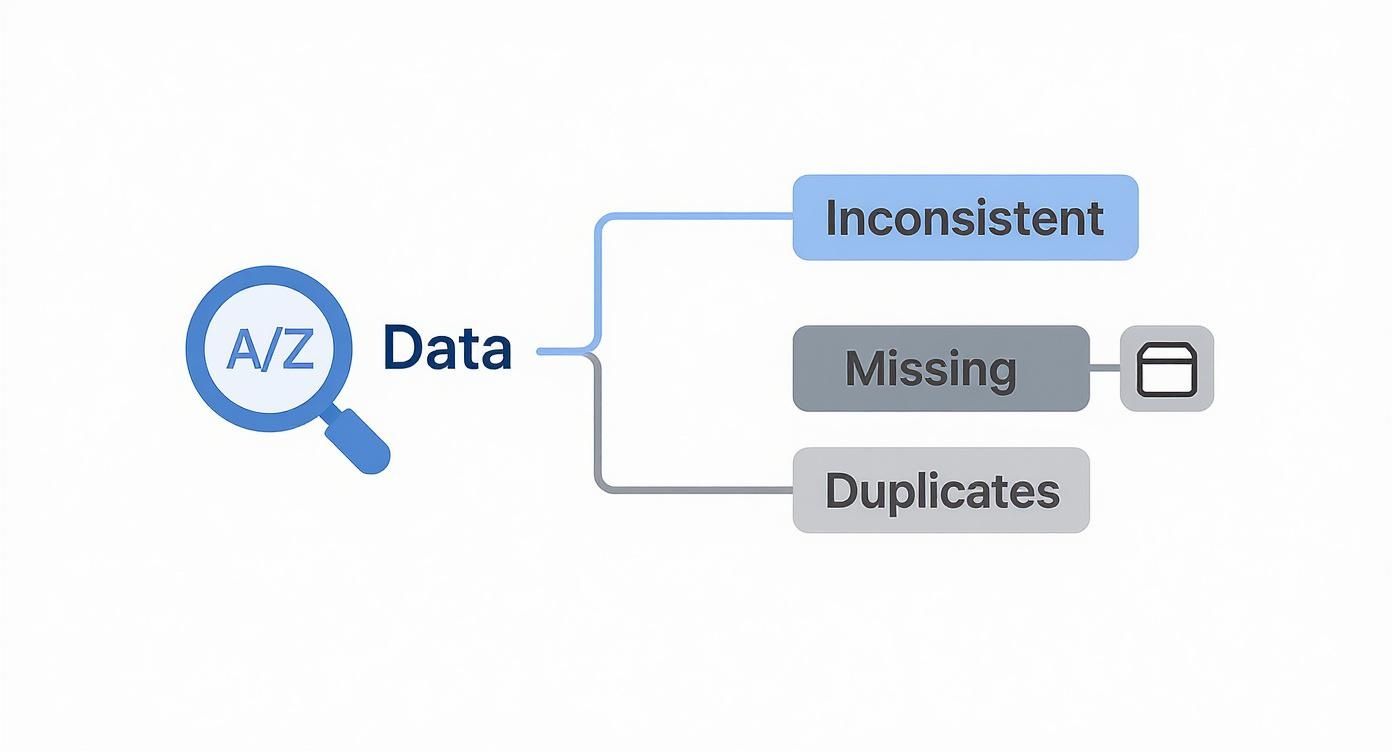
The flowchart shows how issues like inconsistent formats, missing values, and duplicate records are the prime offenders in poor data quality. Each one requires its own specific fix.
Tackling Missing Values
Few things are more aggravating than a dataset full of empty cells. Missing values can completely derail calculations, warp your analysis, and make entire records useless. How you handle them really depends on the context and how important that missing piece of information is.
You've got two main strategies here:
Deletion: This is the most straightforward approach. If a record is missing something critical (like an email in a customer list) and you have thousands of other records, just deleting the entire row might be the cleanest move. Similarly, if a whole column is mostly empty and isn't vital for your analysis, dropping the column is a valid option.
Imputation: This is all about filling in the blanks with a substitute value. It's the go-to method when you can't afford to lose the data. Common imputation tricks include filling gaps with the mean, median, or mode of the column, which works great for numerical data. For trickier situations, you might use regression to predict what the missing value should be based on other data in the same record.
Pro Tip: Never just default to one method. Always ask yourself, "How much data is missing, and how crucial is it to what I'm trying to do?" Deleting 5% of your records might be perfectly fine, but dropping 30% could introduce some serious bias into your results.
Finding and Merging Duplicate Records
Duplicate records are the silent killer of efficiency. They bloat your database, burn through your marketing budget, and create a confusing mess for customers. The tricky part is that they often aren't perfect copies. A customer might show up once as "John Smith" and again as "J. Smith" with the same address.
Your first job is to define what actually makes something a duplicate in your dataset. This usually means combining a few fields—like first_name, last_name, and email_address—to create a unique key for each person or entity.
Once you’ve found them, the goal is to merge them into a single "golden record." This is a careful process:
Pick one record to be the primary or "master" version.
Pull any valuable information from the duplicates over to the primary record. For example, if one has a phone number and the other has a mailing address, combine them.
Finally, archive or delete the now-empty duplicate records.
Following these steps ensures you don't lose any critical information while cutting out all the noise.
Standardizing Inconsistent Data
Inconsistency is probably the most common and frustrating data quality issue out there. It sneaks in from manual data entry, messy system migrations, or just a lack of clear rules. Knowing how to clean up data means bringing uniformity to the chaos.
Think about these real-world examples:
Dates: A single
order_datecolumn might have entries like "10/05/2024," "Oct 5, 2024," and "2024-10-05." To make this data useful, you have to parse each format and convert everything into one standard, like YYYY-MM-DD.Addresses: The same state could be listed as "California," "CA," and "Calif." Building a simple mapping dictionary or a lookup table is the best way to standardize these to a consistent format, like the two-letter postal code.
Categories: You might see product categories entered as "Men's Apparel," "menswear," and "Men's Clothing." A quick find-and-replace script or a CASE statement in SQL can group these under a single, official category.
Standardization can feel tedious, but it's absolutely essential for accurate reporting and aggregation. For a deeper look into keeping your data in good shape, you can explore various strategies to solve data integrity problems that organizations often run into.
The Right Tools for the Job
To make this whole process a lot less painful, it's worth having a reference guide handy. This table matches common problems to the right solutions.
Common Data Problems and Cleaning Solutions
Data Issue | Description | Common Cleaning Technique | Example Tool/Function |
|---|---|---|---|
Duplicate Records | The same entity appears multiple times, often with slight variations. | Deduplication using unique identifiers; fuzzy matching algorithms. | SQL |
Missing Values | Null or empty fields in a dataset. | Deletion (of rows/columns) or imputation (mean, median, mode, regression). |
|
Inconsistent Formats | Data in the same column is represented differently (e.g., date formats). | Parsing and converting all values to a single, standard format. | Regular expressions (Regex), date-parsing libraries, SQL |
Data Typos | Spelling mistakes or incorrect data entry. | Manual correction, spell-check scripts, or rule-based validation. | Dictionaries, fuzzy string matching libraries (e.g., FuzzyWuzzy). |
Outliers | Data points that significantly differ from other observations. | Removal, transformation (e.g., log), or capping at a certain value. | Z-score calculation, Interquartile Range (IQR) method. |
This table is a good starting point, but remember that the best technique always depends on your specific data and goals.
While you can definitely tackle many of these tasks with spreadsheets or SQL scripts, specialized tools can speed things up dramatically. Modern platforms use algorithms to spot fuzzy duplicates, suggest standardization rules, and even automate imputation. The market is full of great options, and you can learn more about various AI tools for data profiling and quality that can help streamline these workflows.
By methodically applying these hands-on techniques, you'll turn that unreliable raw data into a clean, structured, and trustworthy asset. Every correction you make builds a stronger foundation for the insights and decisions that come next.
Validate Your Results to Ensure Accuracy
You’ve put in the hard work of cleaning your data, but how can you be certain your efforts actually paid off? This is where validation comes in. It’s the crucial quality assurance step that separates a hopeful cleanup project from a confirmed success.
Without it, you’re essentially flying blind. You might have introduced new errors without even realizing it. Validation is what builds unshakable trust in your dataset, proving that it’s not just clean, but correct.
Compare Before and After Metrics
The most direct way to prove your work made a difference is through a simple "before and after" snapshot. Remember that initial data quality audit you ran? It's time to dust it off and see just how far you've come.
Run the exact same profiling scripts you used at the beginning. This isn't about creating more work; it's about generating hard evidence of your progress. It’s also the best way to justify the time and resources you’ve invested.
Your comparison should zero in on tangible improvements:
Completeness: Was the
customer_emailfield only 75% complete before? Maybe you've pushed that number up to a solid 95%.Duplicate Count: Did you successfully slash that 15% duplicate record rate down to almost zero?
Format Consistency: Has the percentage of records with a standardized
order_dateformat jumped from a chaotic 60% to a clean 100%?
Seeing these numbers improve is not just satisfying—it's concrete proof that your data cleaning strategy was effective.
Use Visuals and Stats to Spot Anomalies
Even the best automated scripts can miss things. This is where summary statistics and simple data visualizations become your best allies for catching any lingering outliers or strange patterns.
First, recalculate the basic descriptive stats for your key numerical columns, both for the original and the cleaned dataset:
Mean and Median: Did the average transaction amount shift dramatically? A massive change could be a red flag that you accidentally filtered out valid, high-value orders.
Min and Max: Do the minimum and maximum values finally make sense? For instance, a
customer_agefield shouldn't have a max value of 200 anymore.Standard Deviation: A sudden drop in standard deviation might suggest you’ve unintentionally flattened the natural variance in your data, making it less representative.
After checking the numbers, throw the data into a few quick charts. A histogram or a box plot can instantly show you if a distribution looks off or if a few stubborn outliers managed to survive your cleaning rules. This visual gut check is often much faster and more revealing than just scanning rows in a spreadsheet.
Validation isn't about just checking boxes; it's about building institutional trust. When your team knows the data has been rigorously cleaned and verified, they can make decisions with confidence instead of second-guessing every report.
Create a Golden Record for Key Entities
One of the most powerful concepts in data hygiene is the "golden record." Think of it as the single, authoritative, and most accurate version of any key business entity, whether that’s a customer, a product, or a supplier.
It’s the ultimate source of truth, pieced together by merging the best information from all your duplicate or fragmented records.
For example, when you deduplicate a customer list, you don't just delete the copies—you consolidate their useful information. One record might have the right phone number, another has the most current shipping address, and a third has an updated email. The golden record intelligently combines all these pieces into one complete and reliable profile.
This ensures that when the marketing team pulls a list for a campaign, they're getting the definitive version of each customer, not one of five slightly different entries. Creating this single source of truth is fundamental to making your data cleanup efforts last. Advanced tools can even automate much of this; you can read more about how AI-powered data validation works to accelerate this consolidation.
Automate Data Hygiene for Long-Term Success

One-off data cleaning projects are a bit like bailing out a leaky boat with a bucket. You get the water out, but you haven't fixed the hole. It's a reactive cycle that just doesn't scale. The real win is moving from these sporadic cleanups to a state of continuous data hygiene, where quality is built-in and maintained automatically.
You have to shift your mindset from fixing messes to preventing them in the first place. This means building systems that not only correct the problems you have now but stop future ones from ever cropping up. Instead of constantly fighting fires, you’re essentially building a fireproof data infrastructure.
Building Automated Data Pipelines
The heart of any durable data quality strategy is an automated data pipeline. Think of it like a factory assembly line for your information. Raw data comes in from all your different sources and immediately passes through a series of automated checkpoints and transformations before it ever lands in your data warehouse or analytics dashboards.
You can build this pipeline using ETL (Extract, Transform, Load) tools or custom scripts. The trick is to embed the cleaning logic you've already developed right into the flow.
Standardization Scripts: Set up rules to automatically convert all incoming dates to a single format (like YYYY-MM-DD) or standardize state abbreviations the moment they're ingested.
Validation Rules: Implement checks that automatically reject records with critical missing info, like an order that has no customer ID attached.
Deduplication Logic: Run automated scans to flag potential duplicates based on key fields before they poison your main database.
By baking these rules directly into your data flow, cleaning stops being an afterthought. It becomes a fundamental part of how your data gets processed every single day.
The Critical Role of Data Governance
Automation handles the technical side of the equation, but data governance tackles the human element. Strong governance means setting clear, company-wide standards for how data is created, entered, and managed. Honestly, it’s always more efficient to prevent bad data at the source than to clean it up downstream.
A solid data governance framework establishes a few key things:
Data Ownership: Clearly defining which team is on the hook for the quality of specific datasets. For example, the sales team owns the customer contact data.
Data Dictionaries: Creating a single source of truth that defines every data field and what a valid entry actually looks like.
Input Validation: Enforcing rules right at the point of entry. A classic example is using dropdown menus instead of free-text fields in your CRM to eliminate weird spelling variations for country names.
Data governance is what turns good intentions into clear policy. It ensures everyone in the organization understands their role in maintaining data quality, effectively creating a "first line of defense" against dirty data. Without it, even the best automation is fighting an uphill battle.
Proactive Monitoring and Alerting
You can't just set it and forget it. The final piece of the puzzle is a solid monitoring and alerting system that acts as your data quality watchdog. This system should continuously scan your data and immediately notify you the moment something looks off, letting you jump on issues before they snowball into major problems.
Many modern business intelligence platforms can help here. For instance, you can use a tool like Querio to set up dashboards that track key data quality metrics in real-time. It's pretty straightforward to build visualizations that keep an eye on things like:
The daily count of null values in critical columns.
Sudden spikes in records that fail a validation rule.
The rate at which new duplicate records are creeping in.
When a metric crosses a threshold you've defined—say, the percentage of incomplete records jumps by 5% in an hour—an automated alert can fire off to the right team's Slack channel or email. This proactive loop is what separates true data hygiene from simple cleanup. It transforms the process from a periodic chore into a continuous, self-correcting system that maintains trustworthy data over the long haul. This approach is absolutely essential for anyone who wants to reliably clean up data and keep it that way.
Got Questions About Data Cleanup? We've Got Answers.
Even with a perfect plan, you're bound to hit a few snags once you start digging into a messy dataset. It happens to everyone. Here are some quick, practical answers to the questions that pop up most often.
Where on Earth Do I Start With Cleaning Data?
The absolute first thing you should do—before you touch a single cell—is a data quality audit. You can't fix what you can't see, so you need a clear, objective map of the problems you're dealing with.
This means profiling your data to get a handle on the scope of the issues. How many missing values are there? Are we talking 5% or 50%? How many duplicate records are clogging up the system? What about inconsistent formats, like dates written as "Jan 1, 2024," "01/01/2024," and "2024-01-01" all in the same column?
This initial assessment gives you a baseline and helps you triage. You can then focus your energy on the fixes that will actually make a difference, instead of getting lost in the weeds.
Should I Delete Rows With Missing Data or Try to Fill in the Blanks?
This is a classic dilemma, and the right call really depends on your specific situation. There’s no one-size-fits-all answer, but you can think about it like this.
When to Delete: If only a tiny fraction of your records have missing values—say, less than 5%—and those gaps aren't in a mission-critical column, just deleting the incomplete rows is often the cleanest and quickest solution.
When to Impute (Fill): On the other hand, if a huge chunk of your data is missing or the gaps are in a really important field (like customer contact info or sales figures), you can't afford to just throw those records away. That's when you turn to imputation. Simple methods involve filling the blanks with the column's mean, median, or mode. For more complex cases, you might even use a regression model to predict what the missing value should be based on other data in that record.
The core trade-off is this: is it better to lose an entire record, or to introduce a calculated (and therefore less accurate) value? Always think about how your choice will ripple through to your final analysis.
How Often Does Data Need to Be Cleaned?
Think of data cleaning less like a one-time deep clean and more like regular maintenance. You'll likely need a big, initial scrub to get things in order, but the real goal is to build a system for ongoing data hygiene.
The right frequency really hinges on how fast your data moves:
Real-Time or Daily: For high-velocity data that powers immediate decisions—like e-commerce transactions or web analytics—you need automated cleaning and validation running constantly in the background.
Weekly or Monthly: For data that's more static, like employee directories or product catalogs, a regular check-in every week or month is probably enough to keep things tidy.
The key is to get into a rhythm and automate as much as you can. This is what keeps small data quality issues from snowballing into massive, confidence-crushing problems. Knowing how to clean up data is ultimately about building sustainable habits, not just pulling off a single, heroic rescue mission.
Ready to stop wrestling with messy data and make analysis effortless for your whole team? With Querio, you can swap manual drudgery for an AI-powered platform that lets anyone ask questions in plain English and get trusted answers in seconds. Explore Querio and see how fast you can turn data into decisions.

