Guide
Data Warehouse Analytics: A Practical Guide for Data Teams
Master data warehouse analytics with architecture insights, governance best practices, and self-serve strategies that free your data team
A familiar pattern plays out in companies that have outgrown spreadsheet reporting. A product manager asks why activation changed, finance needs a clean revenue cut, and sales wants an answer before the next customer call. The data team opens its ticket queue, remembers which tables contain the relevant fields, writes a query, checks the result, and sends a chart. The request may look small, but the interruption is real, and repeated interruptions turn analysts into a human API for the business.
Data warehouse analytics addresses that operating model, not just the query itself. The warehouse becomes the governed place where data is modeled, documented, and queried, while reusable interfaces let more people answer recurring questions without starting a new analyst task. BARC's 2023 adoption survey found that 79% of analytics environments included a data warehouse, compared with 42% for data lakes and 41% for independent data marts (BARC's data warehouse and data vault adoption research). The practical lesson is clear: newer architectural components haven't eliminated the warehouse. They've increased the importance of putting useful, governed analytics directly on top of it.
Table of Contents
- Why Data Warehouse Analytics Matters Now
- How Data Warehouse Architecture Supports Analytics
- Warehouse-Native Analytics Versus Traditional BI Stacks
- Real-World Use Cases for Warehouse Analytics
- Implementation Best Practices and Governance Guardrails
- Enabling Self-Serve Analytics on Your Warehouse
- Navigating Governance and Trust in AI-Assisted Analytics
Why Data Warehouse Analytics Matters Now
The warehouse matters because it gives teams a shared analytical plane. Source applications still optimize for transactions, workflow execution, and operational consistency. A warehouse organizes data from those systems into structures designed for filtering, joining, aggregating, and comparing business activity over time. That distinction changes the question from “Which analyst knows how to find this?” to “Which trusted model or reusable analysis should answer it?”
A data warehouse also creates a boundary between raw ingestion and business consumption. Analysts shouldn't have to reconstruct customer, order, subscription, or product definitions from application tables every time someone asks a question. They need curated datasets with documented grain, stable keys, freshness expectations, and metric logic. Without those layers, self-service becomes a permission grant to confusion.
The operational test: If every new question requires a person to rediscover the schema, write one-off SQL, and explain the result, the team hasn't built self-service. It has built a request queue.
The business case is capacity, but capacity doesn't mean removing analysts from the process. It means moving their work upstream. Instead of repeatedly answering the same category of question, data professionals maintain models, metric definitions, access policies, tests, and reusable analyses. They spend more time improving the system that produces answers and less time manually producing each answer.
This is why the distinction between a warehouse and “a database that runs queries” matters. A warehouse-backed analytics environment includes ingestion, transformation, modeling, documentation, permissions, observability, and consumption tools. The query engine is only one component. The operating model around it determines whether business users can safely explore data or whether every request still lands in a data team channel.
For a practical overview of how ingestion, transformation, warehouses, and analysis tools fit together, see the modern analytics stack. The useful question for leaders isn't whether the organization has a warehouse. It's whether the warehouse has become a dependable product for the people who need answers.
How Data Warehouse Architecture Supports Analytics
A useful architecture separates where data arrives, how it becomes trustworthy, and how users consume it. Source systems send events, transactions, customer records, billing details, and operational states into an ingestion layer. The raw landing area preserves source fidelity, which helps with replay, debugging, and historical reconstruction, but it usually isn't the right place for business users to explore.
Transformation then turns source-shaped records into analytical models. Staging models standardize names and types. Intermediate models resolve joins and business rules. Curated fact and dimension models expose stable grains, such as one row per order, account, event, or subscription period. A semantic layer can sit above those models to define metrics such as active users, conversion, retention, or recurring revenue consistently across dashboards, notebooks, and applications.
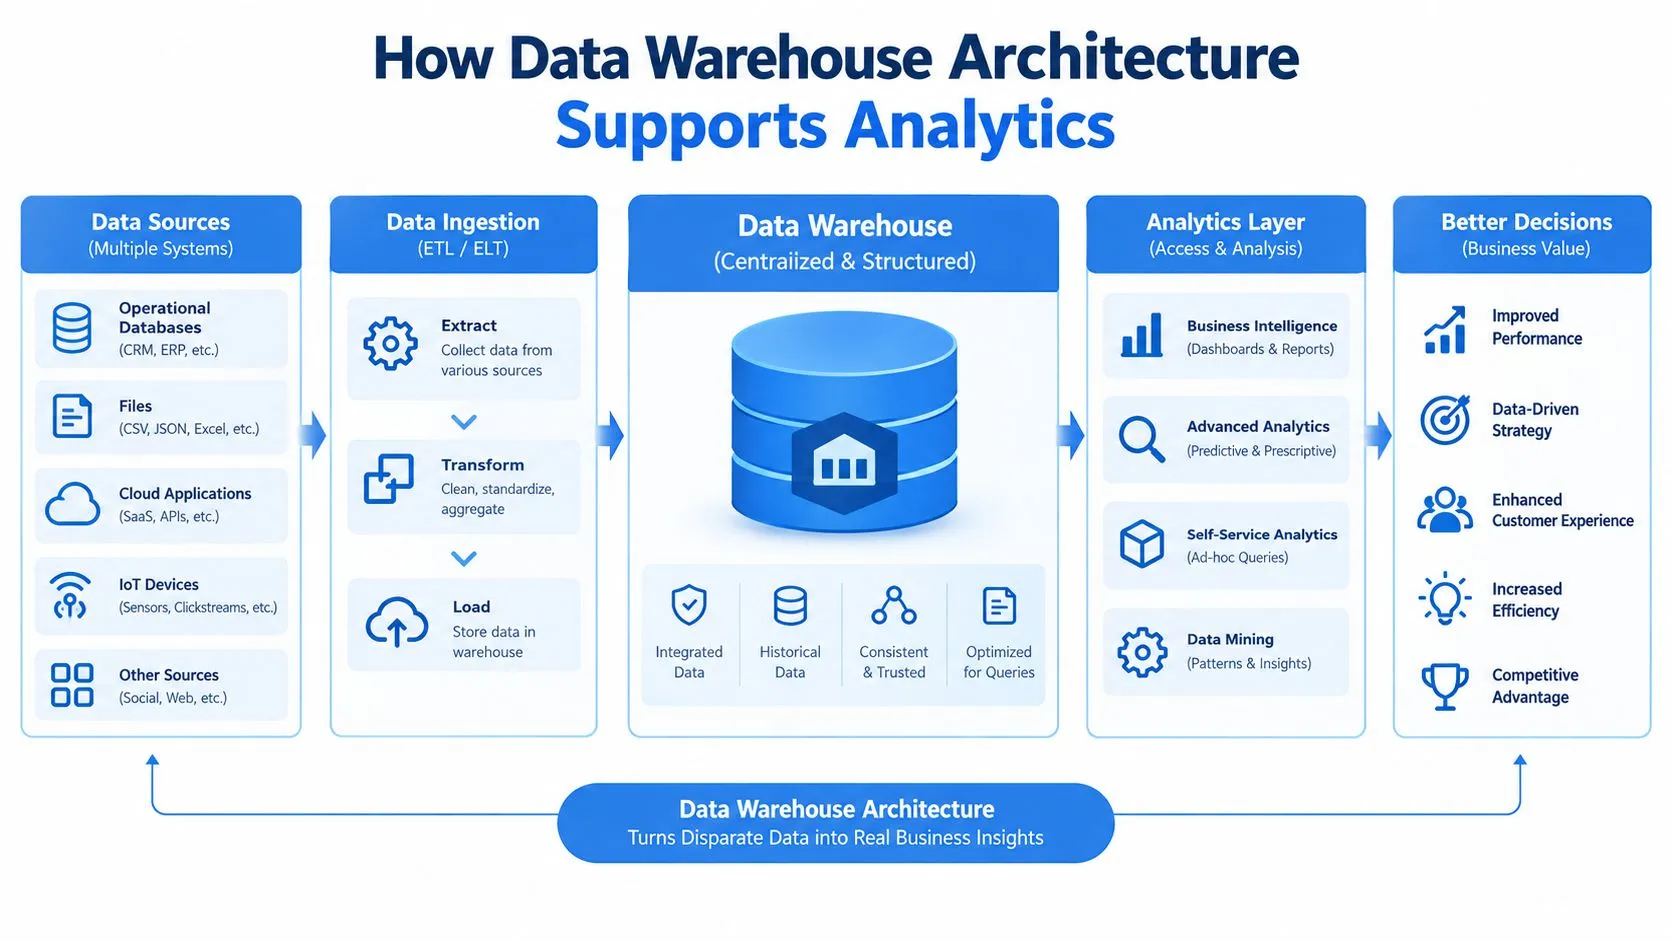
The layers that make exploration possible
The storage and compute design affects more than engineering convenience. Modern cloud warehouses can separate storage from compute, allowing teams to allocate processing capacity to different workloads instead of forcing dashboards, transformations, and exploratory queries to compete for one fixed resource pool. That separation helps, but it doesn't excuse poor modeling. An expensive join across unfiltered event data can still produce a poor experience, regardless of where the query runs.
A star schema often works well for governed reporting because it gives users a recognizable structure. Fact tables hold measurable events, while dimensions describe entities such as customers, products, dates, or regions. Teams deciding how to model these relationships can use star schema data modeling guidance as a practical reference.
The warehouse also supports patterns beyond internal dashboards. A business may expose curated metrics through a customer portal, embed analytical views in a product, or provide data feeds to partners. A useful overview of popular data as a service use cases helps frame those experiences as products with their own reliability, access, and documentation requirements.
Benchmark the path, not just the query
Raw SQL duration is an incomplete performance measure. The operational path includes source ingestion, transformation, testing, table maintenance, freshness, and the final read. The ClickHouse performance-per-dollar benchmark makes this point directly by treating preparation and reads as part of real-time analytics performance.
For decision-support workloads, TPC-DS remains a useful reference because it exercises complex joins, aggregations, sorting, filtering, subqueries, concurrency, and large analytical queries, rather than measuring only simple dashboard reads (AWS's TPC-DS reference for Redshift Serverless). A warehouse that handles a basic KPI quickly may still struggle when several users explore the data at once or when a question requires multiple transformations.
Warehouse-Native Analytics Versus Traditional BI Stacks
Traditional BI tools still solve important problems. They provide polished dashboards, scheduled distribution, filters, alerts, and familiar views for recurring metrics. A certified finance dashboard should usually remain stable, reviewable, and easy to locate. The trouble starts when a BI layer becomes the only route to new questions and stores its own competing versions of business logic.
Warehouse-native analytics keeps the warehouse closer to the user's question. Instead of extracting data into a separate reporting structure or relying on a cache that may drift from the source of truth, the analysis runs against governed warehouse models. That can reduce translation between a business question and the SQL, Python, or metric definition that answers it.
| Capability | Traditional BI Tools | Warehouse-Native Analytics |
|---|---|---|
| Recurring dashboards | Strong visual presentation, scheduling, and distribution | Possible, but usually not the primary advantage |
| Ad hoc exploration | Often constrained by predefined datasets and dashboard design | Better suited to direct SQL, Python, notebooks, and reusable analyses |
| Data freshness | Depends on extracts, refresh schedules, and cache behavior | Can query current warehouse data, subject to pipeline freshness |
| Metric governance | Centralized in the BI model, but may diverge from warehouse logic | Can align directly with warehouse models and semantic definitions |
| Analyst workflow | Frequently begins with a ticket when users hit a dashboard ceiling | Encourages reusable files, notebooks, and governed exploration |
| User experience | Strong for standardized audiences and fixed reporting | Flexible for technical users and carefully designed self-service |
| Maintenance risk | Report proliferation, duplicated logic, and semantic drift | Warehouse complexity, permissions, query cost, and interface design |
The choice isn't binary. Keep traditional BI for stable executive reporting, operational monitoring, and regulated outputs that need a fixed presentation. Move exploratory work closer to the warehouse when the question changes frequently, requires joins across curated models, or would otherwise create another ticket.
The trade-off is that warehouse-native analytics demands stronger foundations. If the warehouse has ambiguous fields, inconsistent dimensions, and undocumented transformations, giving users direct access magnifies the confusion. Teams considering this transition can compare architectural patterns in warehouse-native AI analytics versus lakehouse BI, then decide which workloads benefit from reducing the BI translation layer.
Real-World Use Cases for Warehouse Analytics
The strongest case for data warehouse analytics appears in the request queue. Different requests need different interfaces, but each can become more self-serve when the warehouse contains the right model and the team defines clear boundaries.
Product analytics at event level
Product teams need to move from aggregate usage to sequences of behavior. They may ask which events precede activation, where users abandon onboarding, or how feature adoption differs by account type. The warehouse should preserve event-level detail while exposing tested models for users, sessions, accounts, experiments, and time periods.
A common failure mode is forcing product managers to choose between a rigid dashboard and raw event tables. The dashboard hides useful detail, while the raw tables require technical knowledge and can produce inconsistent counts. A reusable notebook or parameterized analysis can expose the important controls without making each user rebuild the joins.
Operational reporting with fresh data
Support, operations, and revenue teams often need a current view of queues, failed processes, inventory states, or account activity. Scheduled extracts can introduce uncertainty when users don't know when the last refresh occurred. Warehouse-native reporting works when ingestion and transformation pipelines publish freshness indicators and when the query path is designed for the required response time.
The wrong approach is promising real-time visibility while updating upstream data irregularly. A fast dashboard cannot repair stale inputs. Document the freshness contract beside the metric, and make delayed or incomplete data visible to the user.
Customer-facing data experiences
A SaaS product may let customers inspect usage, consumption, adoption, or performance from inside the application. These experiences need tenant isolation, predictable query behavior, stable metric definitions, and carefully limited access. They also need product thinking, because customers don't want an internal schema. They want an understandable answer to a question about their own business.
Curated warehouse models can supply that experience without copying every metric into a separate store. The application still needs authorization and performance controls, but the analytical definition can remain aligned with internal reporting.
Ad hoc questions from nontechnical stakeholders
A sales leader may need an account comparison before a call. A finance partner may want to understand a variance. A product executive may want to slice a metric by segment without waiting for a new dashboard. These requests are ideal candidates for reusable analyses that accept parameters such as date range, segment, account, or product area.
Broader architectural context is available in this overview of big data trends 2026, but implementation should begin with the backlog already in front of the team. Classify requests by repetition, risk, freshness, and required depth. Then build the smallest governed interface that removes the recurring manual step.
Implementation Best Practices and Governance Guardrails
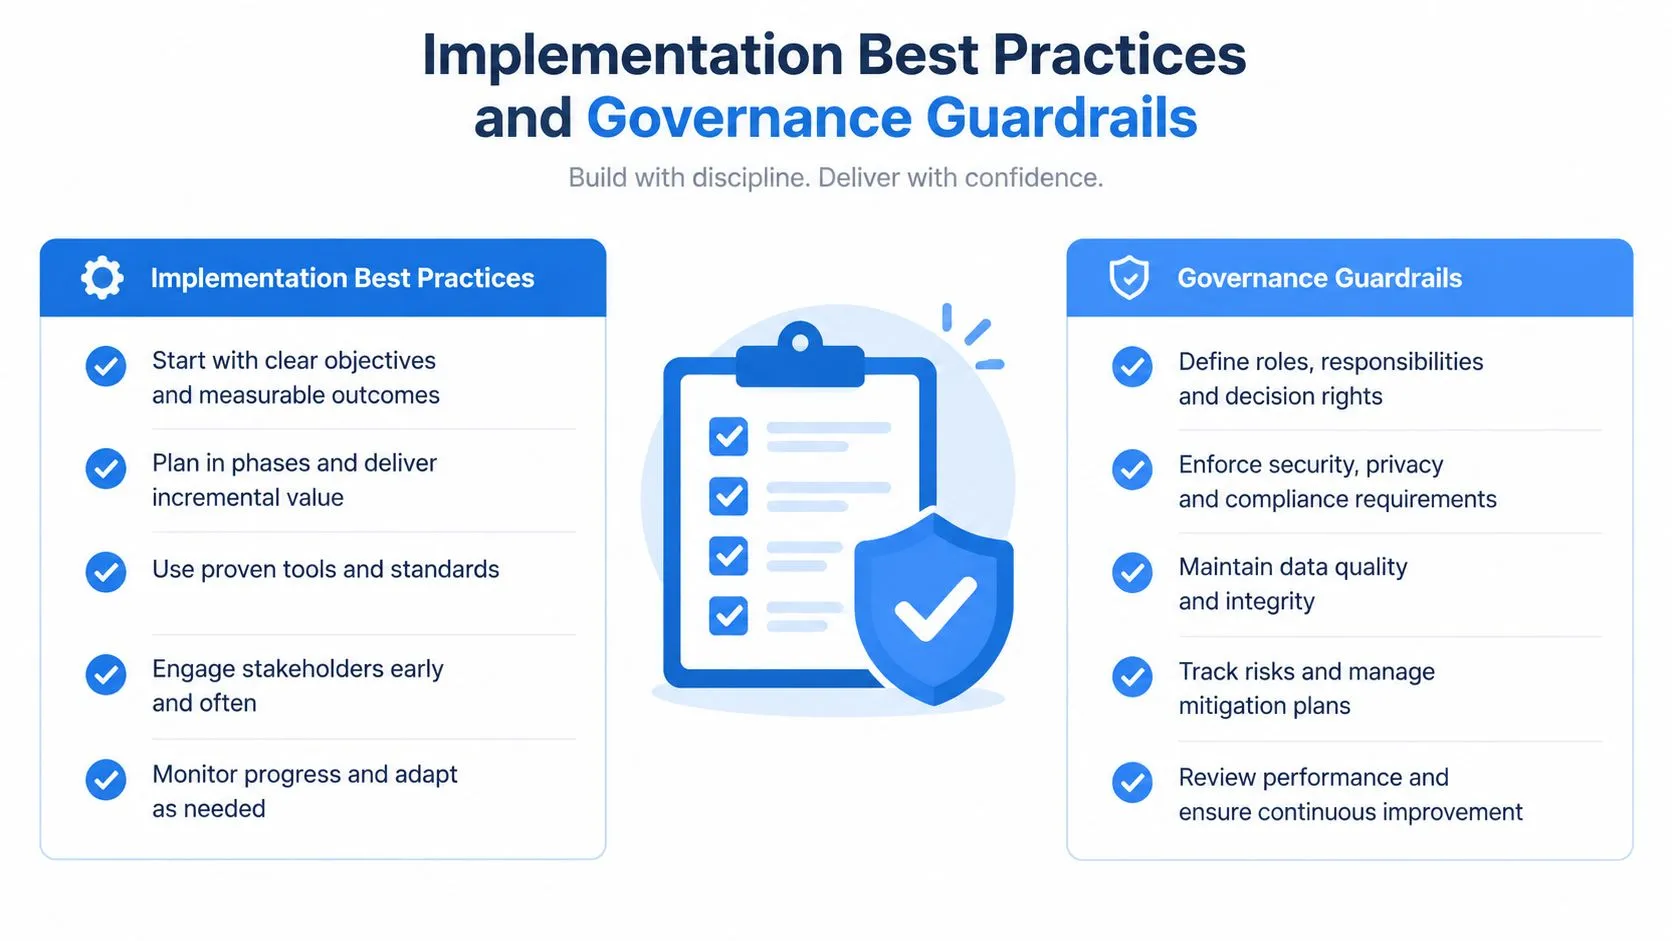
Self-service fails in two opposite ways. One team opens every raw table and calls the result democratization. Another adds so many approval steps that users still wait for analysts. The workable middle is governed freedom: users can explore approved data without requesting permission for every question, while the data team controls sensitive access, trusted definitions, and production pathways.
Start with the warehouse contract
Define what each published model promises. Record its grain, owner, source systems, freshness expectation, known exclusions, and approved joins. Apply role-based access at schema, table, view, and column levels, and separate sensitive raw data from broad analytical models.
Metric definitions need the same discipline. “Active customer” should have one documented meaning for dashboards, notebooks, customer views, and AI-generated queries. If two teams need different definitions, give them distinct names and explain the difference rather than allowing both to use an ambiguous label.
Automate the work that creates bottlenecks
Documentation is often the first task teams postpone, yet undocumented models force analysts to provide context manually. Generate catalog entries from transformation code where possible, attach owners to models, surface lineage, and publish freshness and test results alongside the data product.
Automation should also cover SQL or native code generation, repeated model changes, and cross-platform management. A 2025 warehouse automation survey identified automated documentation, SQL or native code generation, and cross-platform management as executive priorities, while low automation and inefficient workflows remained major obstacles (WhereScape's 2025 data warehouse automation report). The lesson isn't to automate every decision. It's to remove mechanical maintenance so specialists can review the decisions that require judgment.
Governance needs observability as well. Log who accessed sensitive models, which analyses feed production dashboards, and where metric definitions are reused. Give users a clear route to report a suspicious result, and make the owner responsible for resolving it.
A short demonstration can help teams align on how governed analytics should work in practice.
For a broader framework covering policies, roles, and operating patterns, see these data governance framework examples. The goal isn't to prevent access. It's to make the safe path easier than the improvised one.
Enabling Self-Serve Analytics on Your Warehouse
Raw warehouse access isn't self-service. It's a transfer of complexity from the data team to everyone else. A user who sees hundreds of tables still needs to understand grain, joins, naming conventions, slowly changing entities, null behavior, and business exclusions. Drag-and-drop BI can hide some of that complexity, but it often creates a ceiling when users need a custom cohort, a multi-step calculation, or a reusable analytical workflow.
A file-system and notebook-driven approach offers a more practical middle ground. Technical users can create Python and SQL modules that encode the difficult parts once. Nontechnical users can then supply parameters, run approved analyses, inspect outputs, and reuse the same workflow for a different segment or date range.
Build reusable analysis as infrastructure
The unit of self-service shouldn't be a raw table. It should be a well-named analysis with a clear purpose, inputs, outputs, documentation, and ownership. A retention notebook might accept cohort date and customer segment. A revenue analysis might accept region and reporting period. The code can query the warehouse directly, apply the approved definitions, and produce a chart or export.
This model scales because it preserves technical depth without requiring every user to become a data engineer. It also creates a reviewable artifact. A data professional can inspect the SQL, test the Python, update the metric logic, and publish a new version without rebuilding a dashboard manually.
Give users a safe path from question to answer
A strong experience offers several levels of access:
- Guided analyses: Parameterized notebooks for common questions.
- Exploratory workspaces: Flexible SQL or Python for trained users.
- Certified outputs: Reviewed dashboards and reports for high-stakes decisions.
- Reusable building blocks: Shared models, functions, metric definitions, and documentation.
Querio is one option in this category. It connects to warehouses including Snowflake, BigQuery, Amazon Redshift, ClickHouse, and PostgreSQL, provides live read-only access without duplicating warehouse data, and supports plain-language requests that produce SQL or Python for analysis. The important design choice is not the interface alone. It's whether the tool lets the data team maintain reusable, governed work rather than generating isolated answers that nobody can inspect or update.
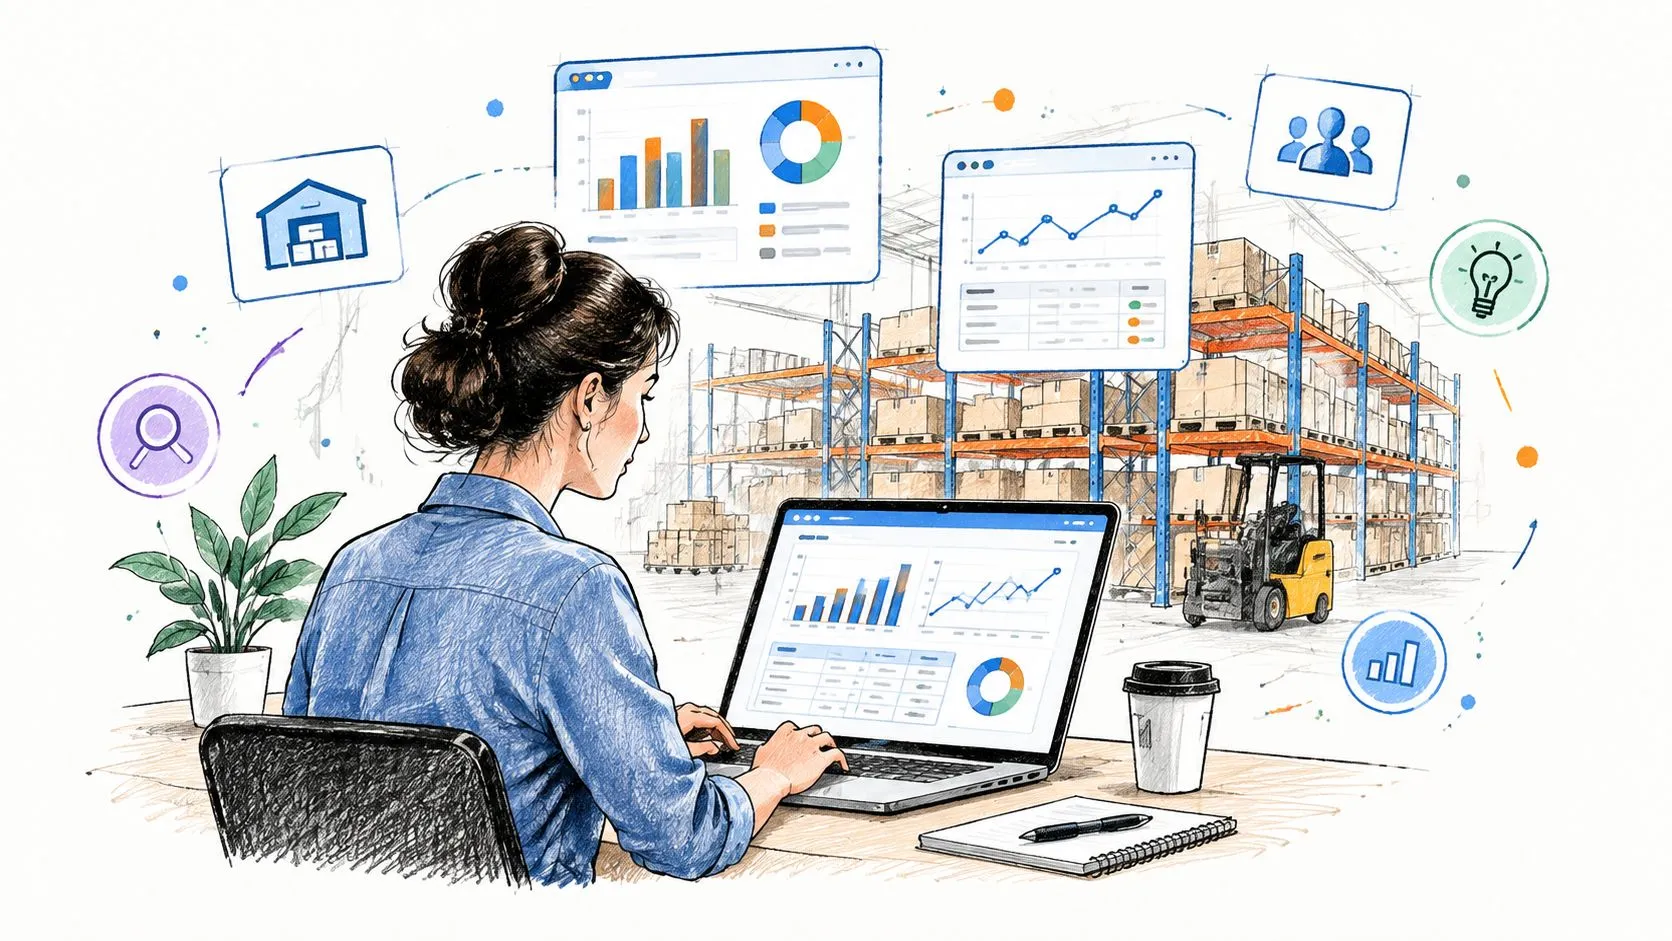
The data team's role changes from answering every question to maintaining the environment that answers whole classes of questions. That includes reviewing high-impact analyses, retiring stale workflows, and teaching users when a result is exploratory rather than certified.
Navigating Governance and Trust in AI-Assisted Analytics
AI-assisted analytics can reduce the friction between a question and a query, but it doesn't remove the need for judgment. An agent may generate syntactically valid SQL that uses the wrong grain, joins a dimension incorrectly, or applies a business definition that sounds plausible but isn't approved.
Data quality remains the foundation. BARC's 2026 trend reporting identifies data quality as the leading analytics trend while agentic AI, data and AI governance, and warehouse modernization rise together (BARC's Data, BI and Analytics Trend Monitor 2026). The same report says 67% of organizations plan to run most analytics on lakehouses within three years and 85% already use lakehouses for AI model development, which makes metric portability and governance more urgent as architectures diversify.
Use three guardrails:
- Constrain access. Give AI systems approved models and least-privilege credentials, not unrestricted raw data.
- Expose context. Make metric definitions, field descriptions, lineage, freshness, and exclusions available to the analysis layer.
- Require review for consequential outputs. Ask the system to show its SQL, validate row counts and filters, and route financial, regulatory, customer-impacting, or executive decisions through human review.
Trust should be earned per workflow, not granted to the technology as a whole.
Querio helps data teams put AI-assisted analysis directly on warehouse data through live, read-only connections, reusable Python and SQL workflows, dashboards, and shared metric definitions. If your analysts are still acting as the human API for routine questions, visit Querio to evaluate a warehouse-native path to governed self-serve analytics.