Data Driven Insight: A Startup Founder's Guide
Unlock growth with data driven insight. Learn the process, avoid common pitfalls, and see how self-serve analytics helps startups make better, faster decisions.
https://www.youtube.com/watch?v=eA5h-p81eIc
published
Outrank AI
data driven insight, startup analytics, product management, business intelligence, self-serve analytics
e83cba42-32d4-4047-b49c-d0cd8562978e
Organizations often already have dashboards. They have weekly KPI reviews, a backlog of ad hoc requests, and a Slack channel where someone drops screenshots from Looker, Hex, or Excel every day. What they usually don't have is confidence. A chart spikes, everyone reacts, and three days later someone discovers the filter was wrong, the event definition changed, or finance and product were looking at different versions of revenue.
That gap is where data driven insight either becomes an operating advantage or a source of expensive confusion. At a startup, the cost of acting on bad insight is rarely academic. It shows up as wasted roadmap cycles, misread retention patterns, and growth bets placed on noise.
The teams that get this right stop treating analytics as report production. They build a system for producing insights that are trustworthy enough to act on, fast enough to matter, and accessible enough that the business doesn't queue behind a small data team.
Table of Contents
What Is a Data-Driven Insight Really
A lot of teams use the phrase data driven insight to describe anything that came out of a dashboard. That's too loose to be useful. A report tells you what happened. An insight tells you what happened, why it matters, and what decision should change because of it.
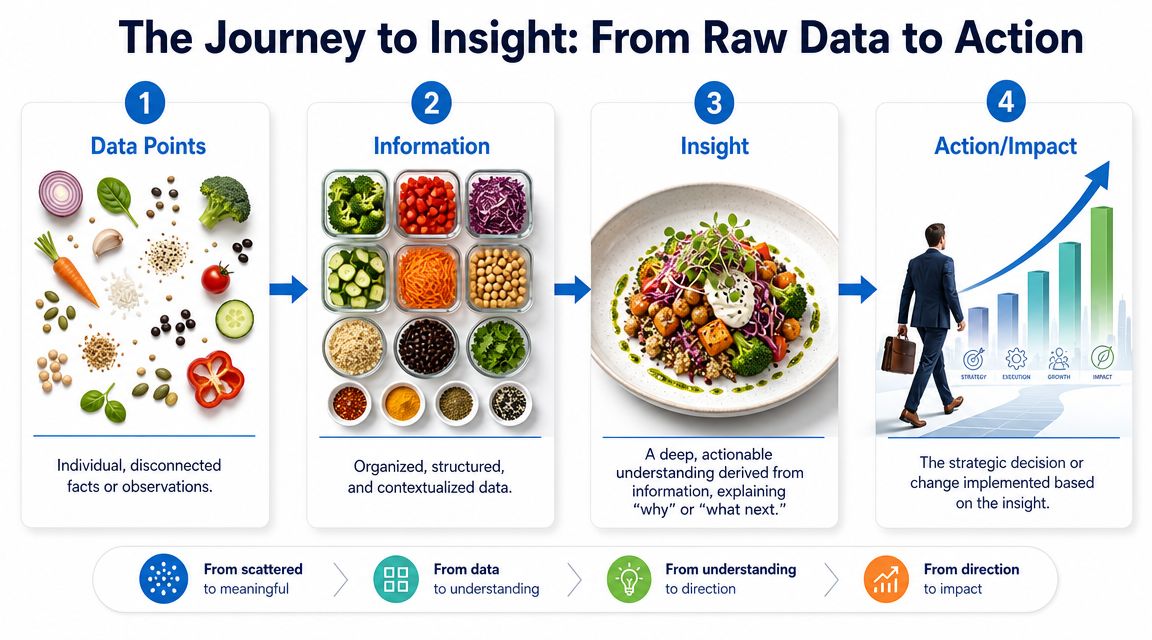
From ingredients to action
The easiest way to explain the difference is with a kitchen analogy. Data points are ingredients on a counter. A user clicked a button. A lead converted. A customer churned. A shipment arrived late. On their own, those facts are disconnected.
Information is what you get when you organize those ingredients. You sort events by customer segment, group spend by channel, or combine product usage with support tickets. Now you can describe what's going on.
A data driven insight is the recipe logic. It explains why one combination matters and what to do next. If you learn that users who complete a certain onboarding step tend to stay engaged while others stall before reaching value, that's no longer just information. That's a decision prompt. You can redesign onboarding, change messaging, or shift success resources.
If your team still mixes up reporting and insight, it helps to separate descriptive work from decision work. This guide to descriptive analytics is useful because it shows the difference between summarizing the past and producing something a leader can use.
Practical rule: If the output doesn't change a decision, it isn't an insight yet.
How to recognize the real thing
A useful insight has a few traits that weak analysis doesn't.
It answers a business question. "What happened to activation in the last cohort?" is a real question. "Let's pull some numbers" isn't.
It connects multiple signals. The strongest findings often sit between sources, such as product usage, billing data, and customer feedback.
It can be challenged. Someone else should be able to inspect the logic, definitions, and filters behind it.
It points to an action. Change pricing. Simplify onboarding. Reallocate sales effort. Stop funding a channel.
IBM describes data-driven decision-making as using data and analysis instead of intuition, and outlines a repeatable cycle of organizing and exploring data, performing analysis, drawing conclusions, and implementing and evaluating outcomes against predefined KPIs in its overview of data-driven decision-making. That's the standard to hold your team to.
The important shift is cultural. Strong teams don't celebrate the slide. They celebrate the decision quality that comes after it.
Why Data-Driven Insight Is Non-Negotiable for Startups
Startups don't fail because they lack opinions. They fail because they scale the wrong ones. In an early-stage company, almost every major choice is made with incomplete information, so the goal isn't perfect certainty. It's reducing the odds of being confidently wrong.
Startups don't get many wrong bets
Founders often start with sharp instincts. That's useful at the beginning. But as the company adds channels, pricing experiments, product surface area, and more customer segments, intuition stops scaling cleanly.
One startup keeps shipping based on whoever argued most convincingly in the room. Another startup checks onboarding behavior, retention patterns, sales cycle friction, and support themes before changing direction. They may both move quickly, but only one is learning in a way that compounds.
That matters commercially. Data-driven organizations are 23 times more likely to acquire customers, 6 times more likely to retain them, and 19 times more likely to be profitable. Further research shows these businesses experience an average 8% profit increase and 10% cost reduction, according to Keboola's summary of McKinsey Global Institute and BARC findings.
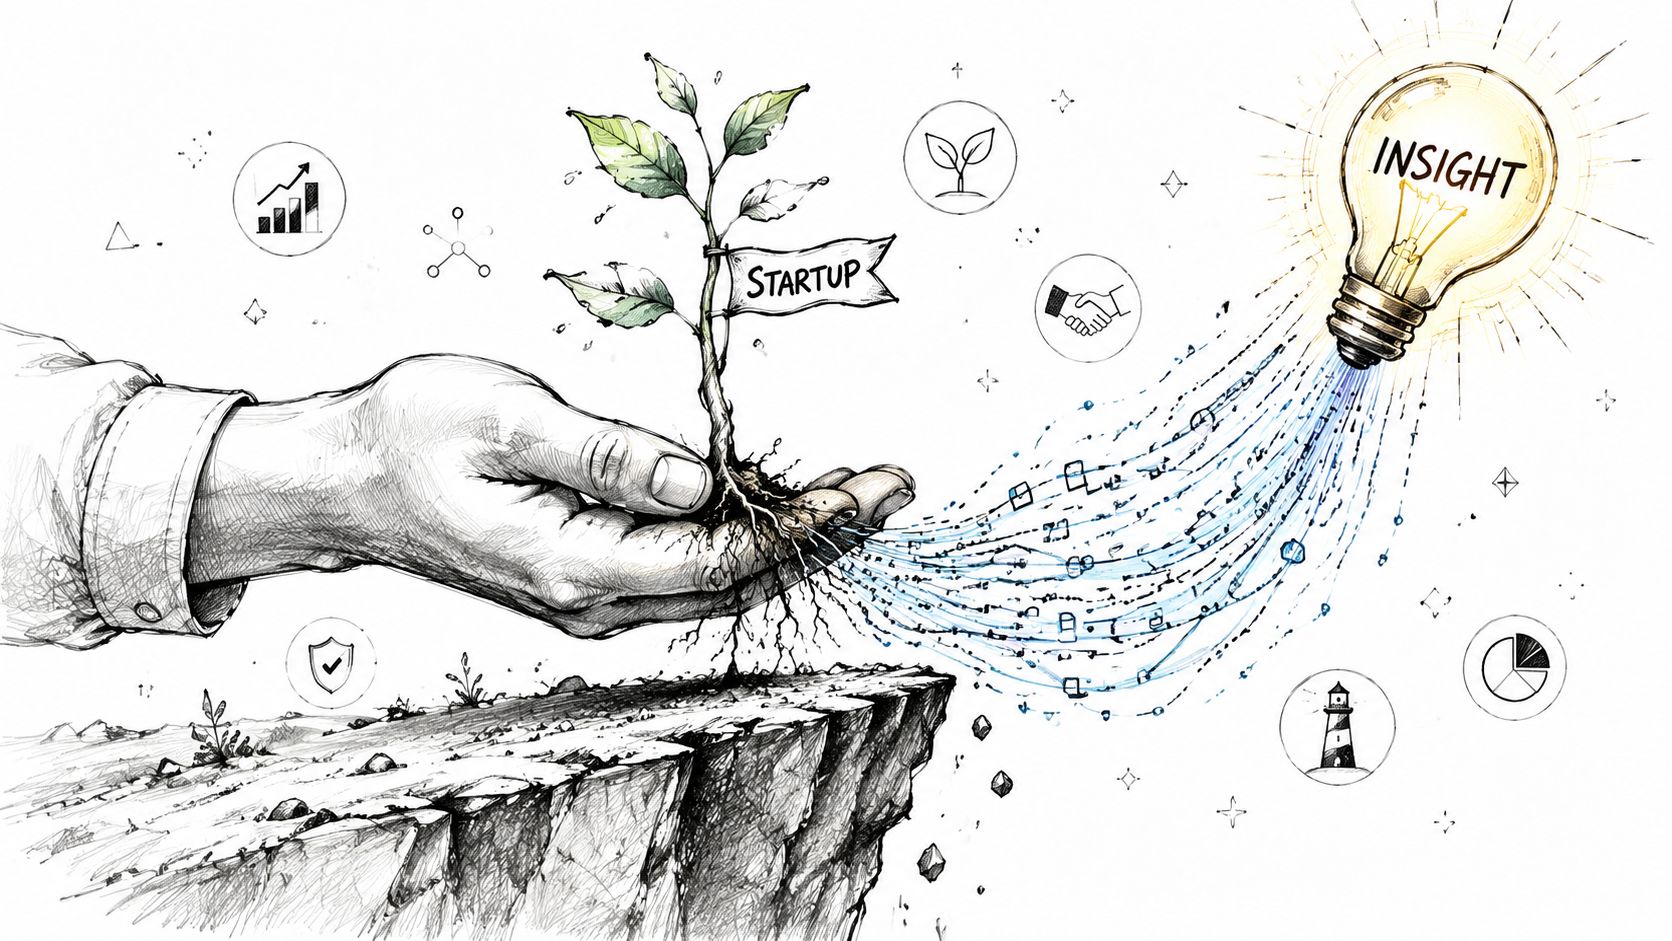
The point isn't that every startup needs a giant analytics function. The point is that startups need a disciplined way to test assumptions before they become expensive habits.
Insight is a de-risking tool
Three startup questions usually matter more than everything else:
Business question | Weak approach | Better approach |
|---|---|---|
Are we finding product-market fit? | Rely on anecdotal customer calls | Pair usage, retention, and feedback signals |
Where are we losing customers? | Look only at logo churn after the fact | Track behavior leading up to drop-off |
Are unit economics improving? | Use channel-level summaries only | Connect acquisition, conversion, retention, and cost data |
When founders raise capital or report to a board, they need more than a story. They need evidence that the business is learning. That's why frameworks around crowdfunding verified metrics can be a useful reference point even outside fundraising. They reinforce a habit that strong operators share. Claims should be anchored in numbers that can be checked.
If you're building that capability from scratch, a practical starting point is to define which decisions your team needs to make weekly and which data should inform them. This overview of data analytics for startups is a good operational primer because it frames analytics as a growth discipline rather than a reporting exercise.
The startups that learn fastest usually aren't the ones with the most dashboards. They're the ones that can tell which signals are reliable.
The Anatomy of a Data-Driven Insight Engine
Reliable insight doesn't come from a clever analyst working late. It comes from a system. If the same question produces different answers depending on who pulled the data, you don't have an insight engine. You have a reporting lottery.
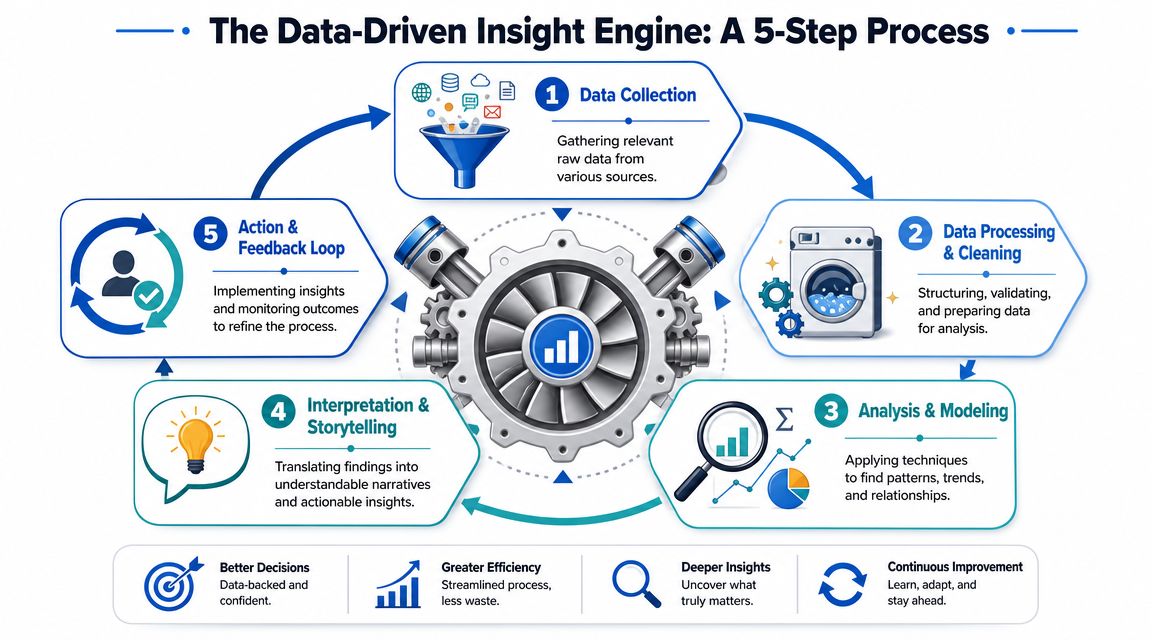
Near the start, it's worth grounding this in a simple visual model.
The five parts that matter
I think about the engine in five connected parts.
First, data sources. Every company has them. Product events in Segment or RudderStack. CRM records in Salesforce or HubSpot. Payments in Stripe. Support conversations in Zendesk or Intercom. Finance records in the ERP. The mistake isn't lacking data. It's failing to decide which sources are authoritative for which questions.
Second, instrumentation. Many teams gradually lose trust in this domain. Event names drift. Product and marketing define activation differently. A metric gets copied into a spreadsheet and detached from the underlying logic. Instrumentation isn't glamorous, but it is the starting point for repeatability.
A short explainer helps here if your team is still assembling the plumbing. This introduction to the modern data stack captures the core idea of keeping collection, transformation, storage, and analysis tightly connected.
Third, analysis and modeling. Here, you go from tables to understanding. Funnel analysis, cohort analysis, segmentation, forecasting, attribution logic, experiment reads. The method matters less than whether it fits the question.
IBM's definition is useful because it treats insight generation as a cycle rather than a one-off task. It includes organizing and exploring data, analyzing patterns, drawing conclusions, then implementing changes and evaluating them against predefined KPIs, as outlined earlier in its guidance on data-driven decision-making.
Later in the process, teams often benefit from a walkthrough of how these pieces fit together in practice.
Fourth, governance and quality. This is the part teams tend to underinvest in until they get burned. Metric definitions, ownership, access controls, data freshness expectations, test coverage, and change logs all sit here. Governance sounds heavy, but in healthy startups it's lightweight and specific. Who owns revenue? Which table is trusted for active users? What breaks if this event disappears?
Fifth, metrics and KPIs. This closes the loop. An insight only matters if someone can observe whether the action worked. That means predefining how success will be measured before the change goes live.
What breaks the engine
Here are the failure points that show up repeatedly:
Conflicting source systems: Sales trusts CRM, finance trusts billing, product trusts event logs.
Loose metric definitions: "Active user" means one thing in product review and another in board slides.
No feedback loop: Teams identify a pattern, make a change, and never evaluate whether it improved the KPI.
Centralized bottlenecks: Every question depends on one analyst translating business requests into SQL.
A strong insight engine doesn't just produce answers. It produces answers people trust enough to act on.
Real-World Examples of Insight in Action
The easiest way to spot the difference between reporting and insight is to look at what changed after the analysis. Strong teams don't stop at "we found something interesting." They make a business move.
A SaaS onboarding pattern worth acting on
A B2B SaaS team thought their onboarding issue was too many steps. Product managers wanted to shorten setup, sales wanted more white-glove handoff, and customer success wanted more training calls. Their dashboard showed completion rates, but that didn't settle the argument.
The useful insight came from connecting onboarding events to later account behavior. The team found that users who completed one high-intent setup action early behaved differently from users who completed lots of low-value setup tasks. That changed the roadmap. Instead of making onboarding shorter in general, they redesigned it to drive users toward the one action that correlated with value realization.
The report said users dropped off. The insight said which moment mattered.
An e-commerce segment that changed the plan
An e-commerce brand assumed its best customers were high-frequency discount shoppers because those buyers generated visible campaign activity. The marketing team kept optimizing for repeat purchase volume.
Cohort analysis told a different story. A less obvious segment bought fewer times but purchased with higher intent, returned less often, and created cleaner margin over time. Once the team saw customer behavior, product mix, and financial outcomes side by side, they shifted acquisition spend and adjusted promotions.
That wasn't a flashy machine learning project. It was a disciplined read of unified data that challenged an attractive but misleading assumption.
A mobile funnel leak hidden in plain sight
A mobile app team spent weeks debating top-of-funnel conversion. Paid traffic looked fine, install rates were acceptable, and leadership assumed the problem sat in ad targeting.
Funnel analysis revealed the primary leak happened deeper in the journey. Users accepted the first permissions prompt, explored a key feature, then hit a confusing account requirement before completion. Because reporting had been split across acquisition and product analytics, nobody had seen the full path clearly.
The fix was operational, not abstract. Rewrite the screen copy, move the account requirement later, and monitor completion quality afterward.
Good examples of data driven insight have one thing in common. The analysis narrows the decision, not just the discussion.
Common Pitfalls That Turn Data Into Noise
Most analytics problems aren't caused by a lack of tools. They're caused by teams treating every chart as equally credible. That's how bad insight scales. It looks polished, moves fast, and arrives with just enough confidence to get funded.
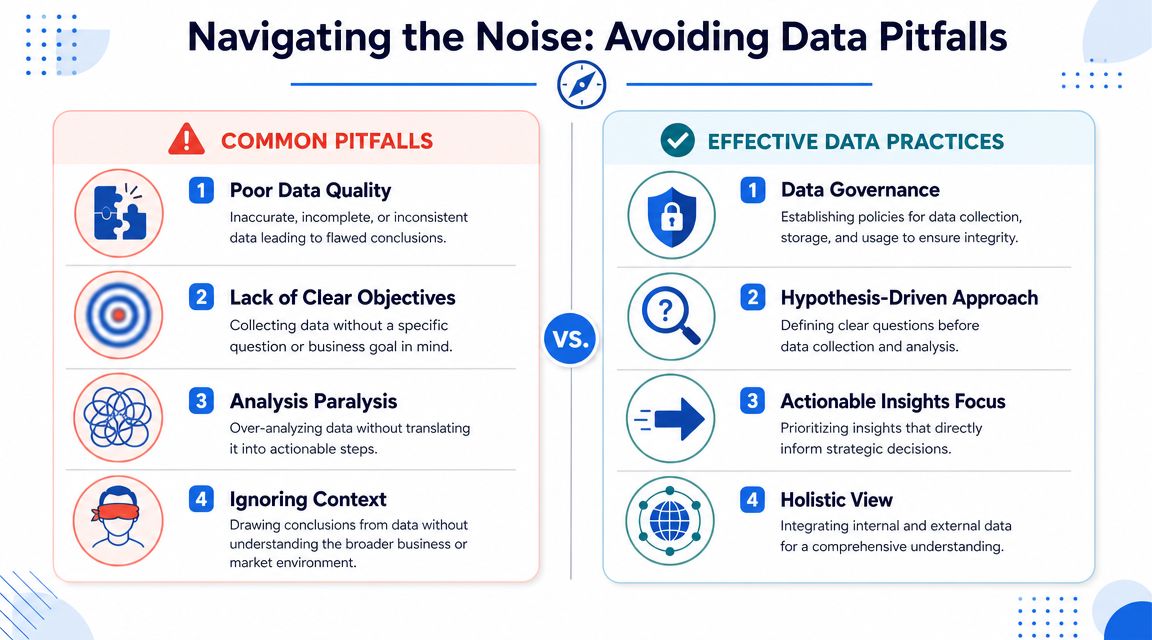
The failure modes I see most often
The first trap is vanity metrics. Signups, pageviews, downloads, open rates. These can help with context, but they often become a substitute for outcome metrics. If a metric looks good but doesn't connect to activation, retention, margin, or customer value, it may only be telling you that your funnel is noisy.
The second trap is confirmation bias. Leaders often ask for analysis after they've already formed a view. Analysts feel the pressure. They slice the data until they find support for the preferred story. Nobody says this out loud, but it happens in almost every company.
The third trap is data silos. Product sees behavior. Finance sees revenue. Support sees pain. Sales sees pipeline. Each team can produce internally consistent reports and still miss the truth because the signals never meet.
The fourth trap is analysis paralysis. Teams keep exploring because exploration feels productive. They postpone the harder step, which is making a decision and defining what outcome would prove them wrong.
What disciplined teams do differently
Acceldata makes a point that deserves more attention: while many guides explain how to analyze data, few explain how to ensure the resulting insight is trustworthy enough to act on. It argues that the effectiveness of a data-driven strategy hinges on data quality, timeliness, accuracy, and relevance, in its discussion of how data-driven insights transform decisions and growth.
That's the right standard. Trust isn't built by adding more reporting. It's built by operational controls.
Define metric ownership: One person or team should own each core metric's logic.
Set freshness expectations: Some decisions need live or near-live data. Others don't. Make that explicit.
Require decision context: Every analysis should state the business question, not just the output.
Inspect joins and definitions: Most bad insights come from quiet mismatches, not dramatic errors.
Use challenge sessions: Ask someone outside the project to pressure-test assumptions before acting.
Countermove: Treat insight review the way engineering treats code review. The goal isn't to slow work down. It's to catch expensive mistakes before production.
A healthy data culture isn't one where everyone trusts the dashboard blindly. It's one where people know what has earned trust and what still needs checking.
How Self-Serve Platforms Accelerate Trusted Insights
The traditional startup model turns the data team into a ticket queue. A PM asks a question. An analyst rewrites it into SQL. The business waits. By the time the answer arrives, the context has shifted and three more follow-ups have appeared.
That model breaks for two reasons. It's slow, and it encourages private logic. Every urgent question becomes a custom one-off analysis with limited visibility into how the answer was produced.
Why the human API model fails
Integrate.io describes a practical workflow for usable insight: define the business question, integrate the necessary data, analyze the unified dataset, and visualize the result. It also notes that insight quality depends on reconciling disparate sources, and that platforms enabling this directly on the warehouse accelerate the cycle, as explained in its piece on what data-driven insights are.
That warehouse-centric approach matters. If your self-serve layer sits far away from the governed source of truth, users move faster but trust often drops. People export CSVs, create local definitions, and rebuild the same metric five ways.
A better model gives non-technical users direct access to governed data while preserving lineage, definitions, and reviewability.
What good self-serve looks like
A self-serve setup works when it includes both freedom and guardrails.
What users need | What the platform must provide |
|---|---|
Ask questions in business language | Clear semantic definitions and governed tables |
Move from question to answer quickly | Direct warehouse access and transparent logic |
Explore without filing tickets | Permission controls and reusable models |
Trust the output | Visibility into SQL, calculations, and source lineage |
Tools differ in meaningful ways. Some teams use Looker for governed metrics, Hex for exploratory work, and notebooks for advanced analysis. Others want a single interface closer to the warehouse. Querio is one option in that category. It deploys AI coding agents on the warehouse and uses a file-system approach with Python notebooks so technical and non-technical users can query and analyze governed company data without routing every request through an analyst. If you're evaluating this model, it's worth understanding the mechanics of self-serve business intelligence before selecting tooling.
The cultural payoff is larger than the tooling choice. When self-serve is done well, PMs ask better questions, finance and product stop debating whose spreadsheet is correct, and data teams spend less time being a reporting help desk.
From Insight to Action Your First Steps
Most companies make this harder than it needs to be. They assume becoming data-driven means buying a large platform, redesigning the entire stack, and retraining the whole organization at once. It usually starts much smaller.
Start smaller than you think
Pick one business question that matters right now. Not ten. One. A churn spike in a key segment. A drop in activation. A mismatch between pipeline growth and revenue realization. If the question doesn't matter enough to change a decision, it's the wrong place to start.
Then identify the minimum data needed to answer it. Usually that's a mix of product behavior, customer records, and one outcome metric. Keep the scope tight enough that the team can inspect definitions, validate joins, and agree on what "good" looks like.
Finally, give a small cross-functional group room to explore. One product lead, one operator, one data person is often enough. The goal isn't to produce a polished dashboard pack. The goal is to produce one trustworthy insight and connect it to one concrete action.
Use this checklist:
Choose a decision: Name the exact decision the analysis should improve.
Clarify the source of truth: Decide which systems and metric definitions are authoritative.
Set a trust threshold: Agree on what checks must pass before acting.
Define the follow-through: Decide how you'll measure whether the action worked.
Teams build momentum when they prove that trusted insight can change outcomes quickly. After that, process becomes easier to justify because people have seen the cost of guessing.
If your team is stuck between slow analyst queues and unreliable self-serve, Querio is worth a look. It gives companies a way to let more people explore warehouse data with transparent SQL and Python logic, while keeping analytics close to governed source data instead of scattering definitions across disconnected tools.

